Space Exploration TechnologiesNASDAQ:SPCX
Report date: June 16, 2026. SpaceX completed the largest IPO in history on June 12, pricing at $135 per share for a valuation of roughly $1.77 trillion; the stock closed its first session up 19% at $160.95 and kept climbing — about $178 on June 15 and a fresh all-time high near $218 intraday on June 16 (up ~13% on the day, +61% versus the offer price), a market cap of roughly $2.86T.
Per its S-1 and June roadshow: 2025 revenue was $18.7B (+33% YoY) on $6.6B of adjusted EBITDA. The Connectivity (Starlink) segment alone did $11.4B of revenue and $7.2B of adjusted EBITDA (a 63% margin, +50% YoY) — already a powerful cash cow. The group still posted a $4.9B net loss, driven by $20.7B of capex and AI investment rather than weak core economics. As it is not yet profitable at the group level, P/E does not apply; on a sum-of-the-parts (SOTP) basis the existing businesses are worth about $63–133 per share, which we treat as a conservative floor. What drives the valuation is the forward opportunity: on management's own targets (growth rising further from 33%, gross margin 49%→70%, net margin −26%→+45%, addressable AI market of $3.8T near-term / $26.5T long-term), our three-year scenarios are about $300 (base) and $420+ (bull).
We are long-term bullish and rate the stock Overweight. At about $218 (a fresh all-time high) it still offers roughly 38% upside to our three-year base target of $300, with a bull case above $420. The premium above the floor is the market pricing SpaceX's scarce position as the only single-stock basket offering “access to space + frontier AI” — a re-rating we think has further to run, not a bubble. Expect sharp, periodic deep pullbacks in the near term — a newly listed stock at >100x sales with lock-up supply is highly volatile; for long-term bulls those deep dips are a better entry, not a reason to step aside.
§01Investment Summary
SpaceX is a great company — but the question this report sets out to answer is not whether it is excellent, but how much growth the market is right to price above the $135 offer. Since the group is not yet profitable and P/E does not apply, we first set a conservative floor with a sum-of-the-parts (SOTP) build (valuing Starlink, Launch, Starship and xAI/AI separately) and then size the three-year growth runway against management's forward targets.
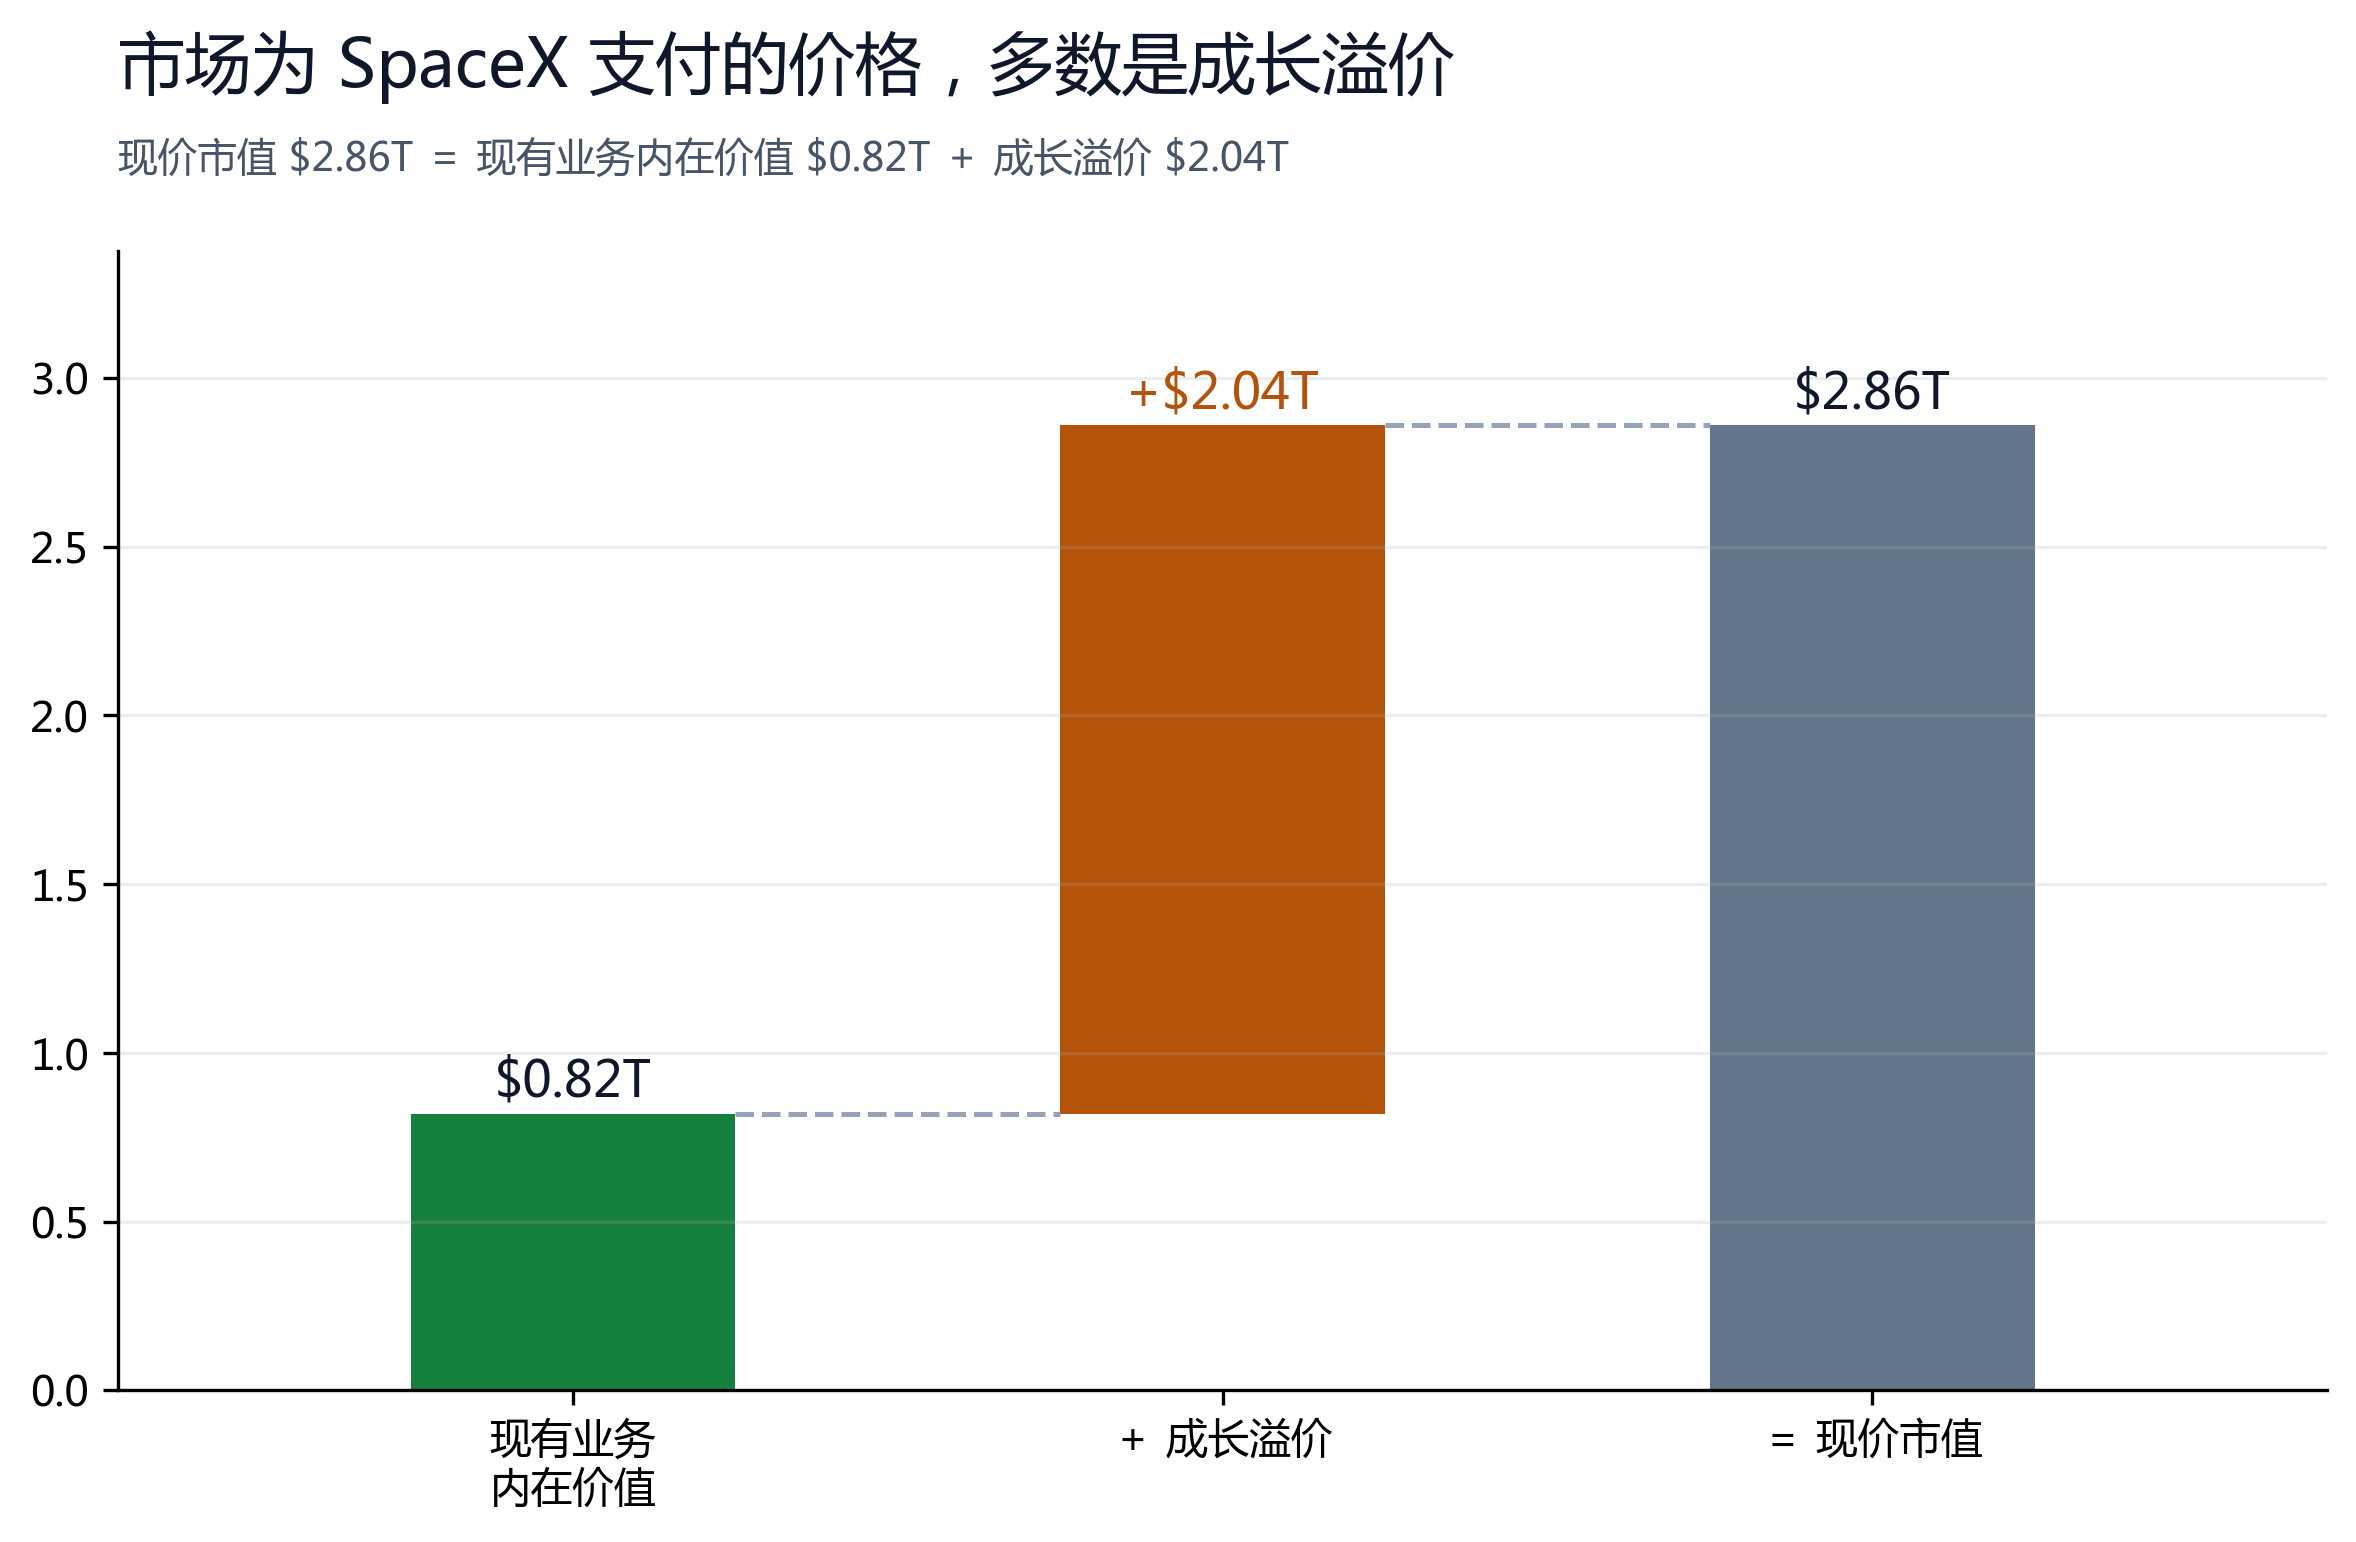
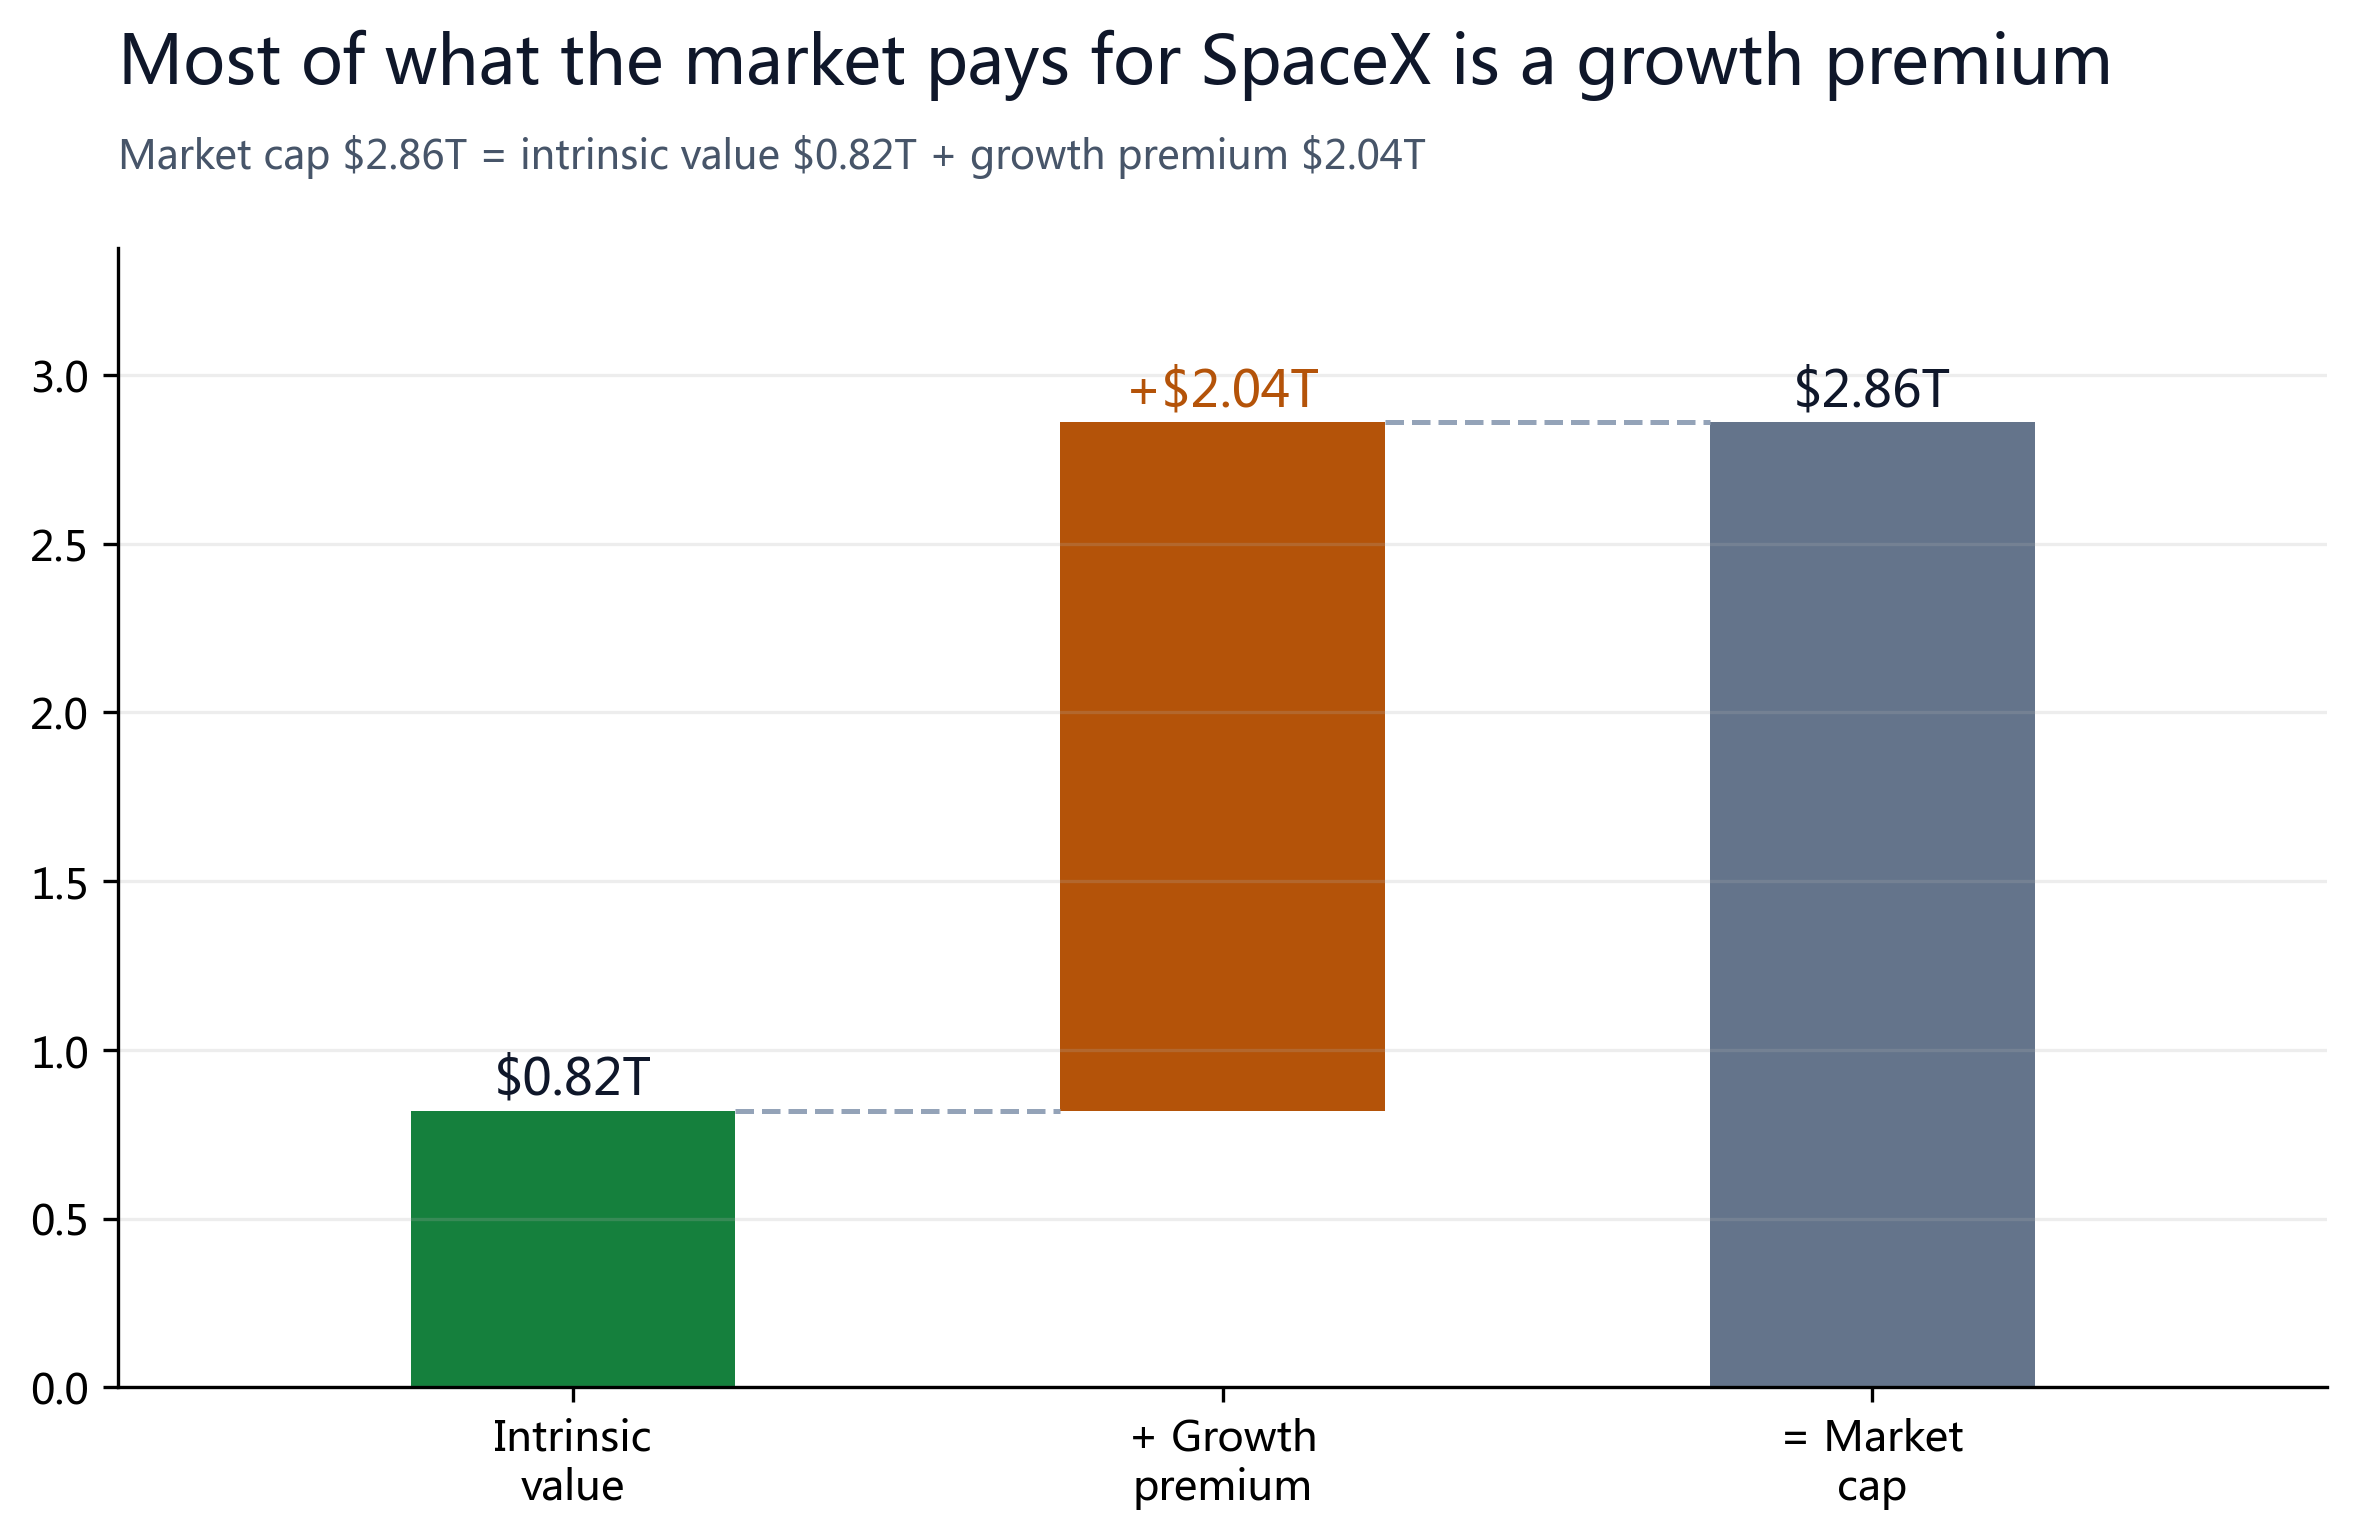
Start with the floor: in the base case the monetizable businesses are worth about $0.82T, or roughly $63 per share, with an optimistic SOTP ceiling near $133. At about $218 and a $2.86T cap the stock does trade above that floor — but the excess is not pure narrative: it reflects SpaceX's singular positioning across launch, orbital compute, connectivity and frontier AI (see §06).
The key is that this floor is rising fast: on management's targets — revenue growth climbing further from 33%, gross margin heading toward 70%, AI turning from drag to engine — our three-year base fair value is about $300 per share, with a bull case above $420.
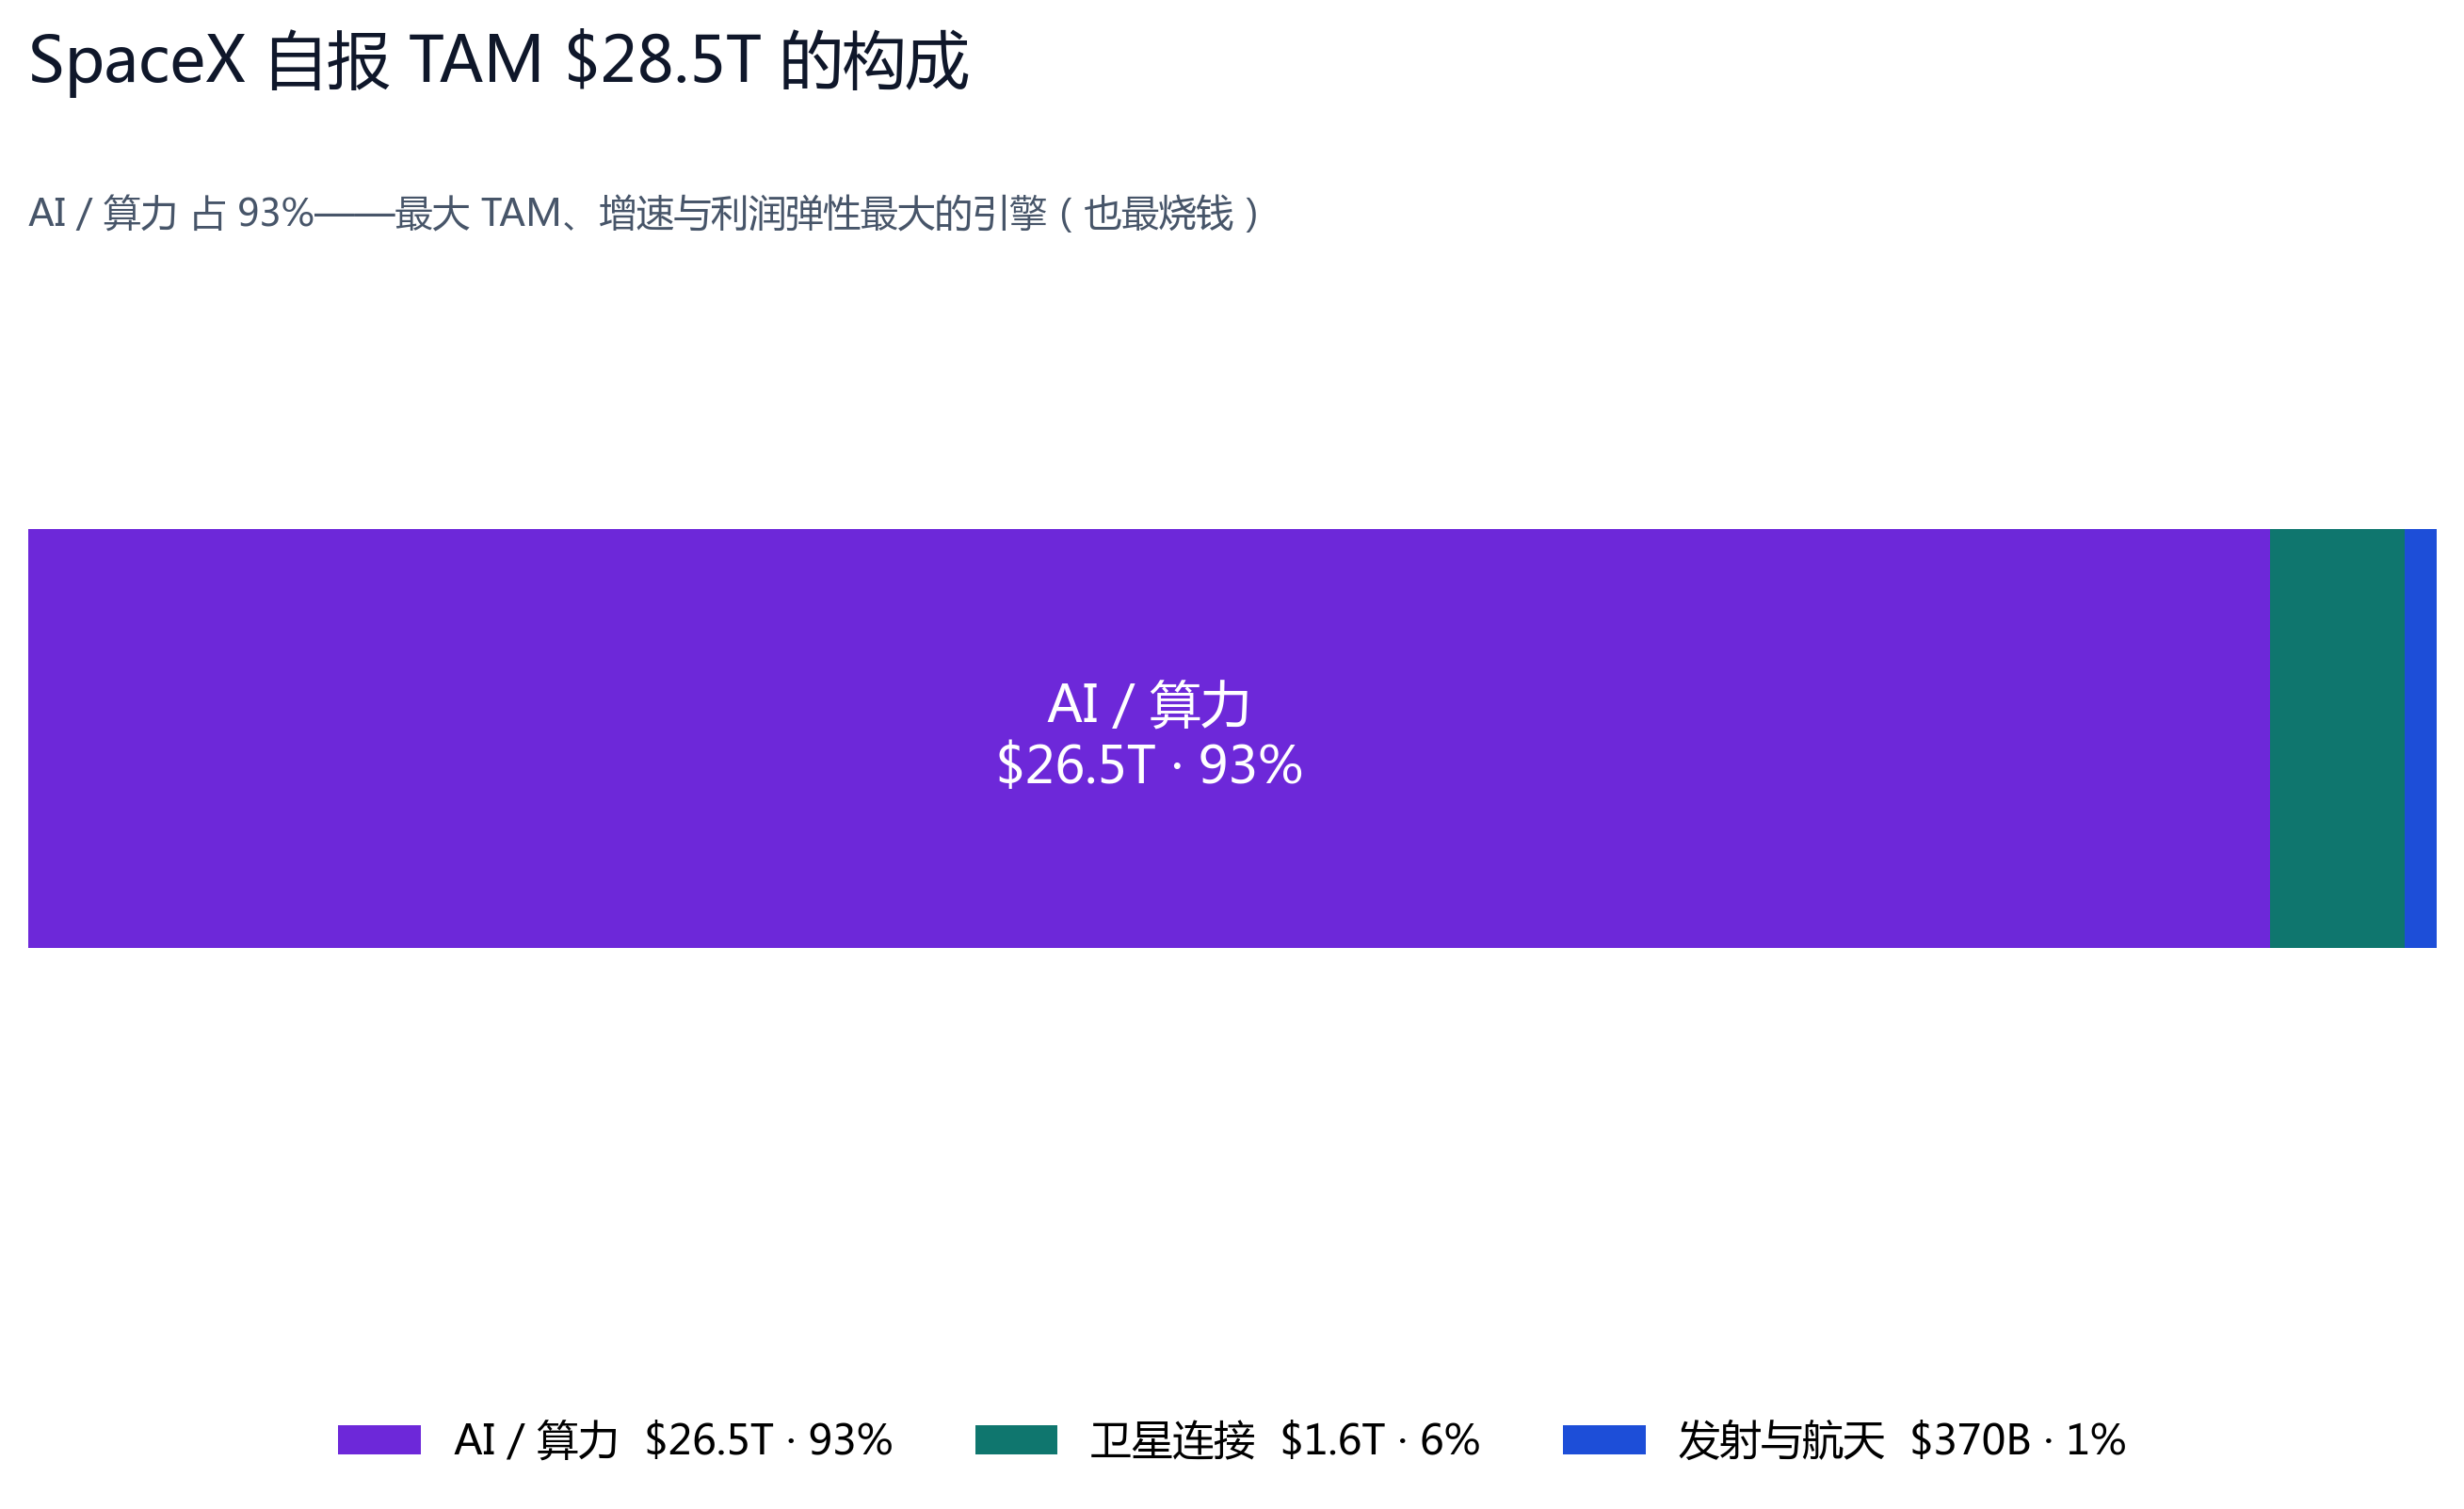
At $218, even at an all-time high, the stock still offers roughly 38% upside to our base target. We are clear-eyed that the premium rests on AI/compute — today the most cash-intensive, least-proven piece (2025 AI operating loss $6.36B, 76% of capex) — but it is also the largest TAM ($26.5T) and the engine with the most growth and margin leverage, and only SpaceX can launch compute to orbit cheaply. That is the core of our bullish call.
In practice: long-term bulls can build a position at current levels; a deep pullback driven by the ~20% lock-up release after the Q2 report plus a soft quarter (watch the ~$150 area, near the 52-week-low support zone) would be a better place to add. This is a valuation and direction call, not a timing call; downside risks are in §09.
§02IPO and Price
SpaceX listed on Nasdaq on June 12, 2026 under SPCX at $135 per share, raising about $75B at roughly a $1.77T valuation — the largest IPO ever, about 4x oversubscribed. The stock closed its first session up 19% at $160.95, touching $176 intraday.
Given that it has only a few trading days of history and no reliable long-term price record, we do not construct a long-term price curve. Price path: $135 offer → $160.95 first-day close (June 12) → about $178 on June 15 → a fresh all-time high near $218 intraday on June 16 (about +13% on the day, +61% versus the offer). The newly listed shares are highly volatile, so treat the price as a range rather than a point. The full valuation range versus the current price is shown in §06 and §08.
§03Bull/Bear View
Bull: the only publicly tradable space + AI super-platform
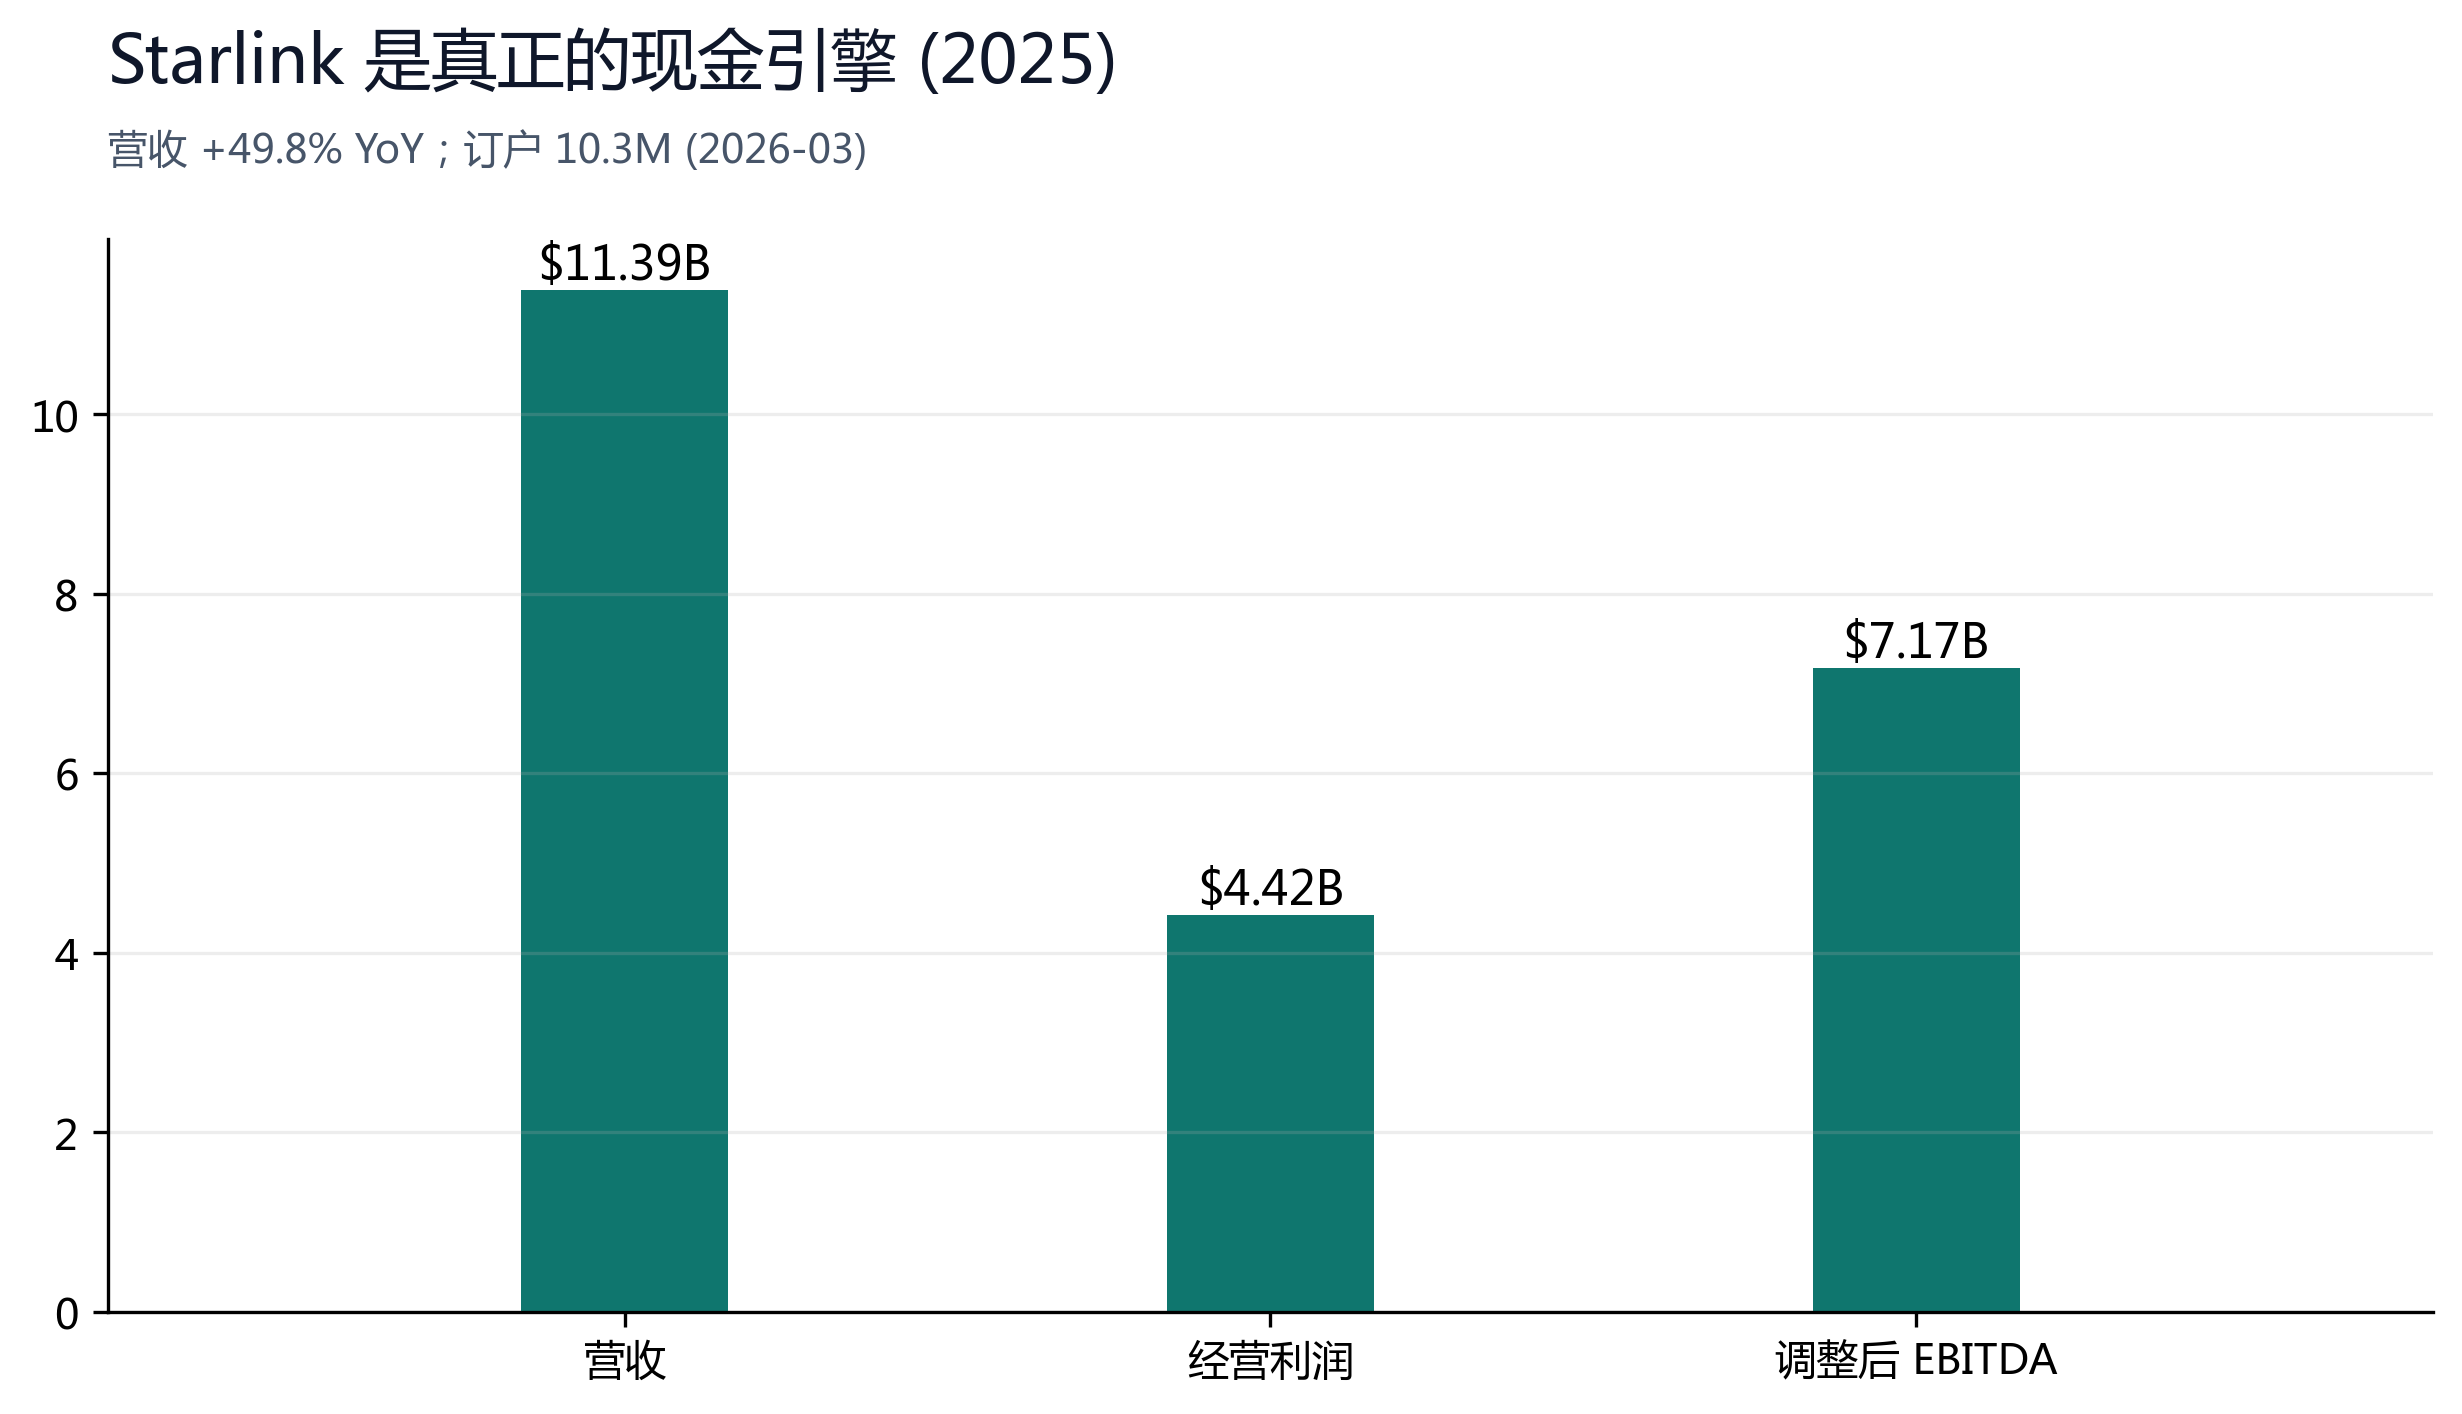
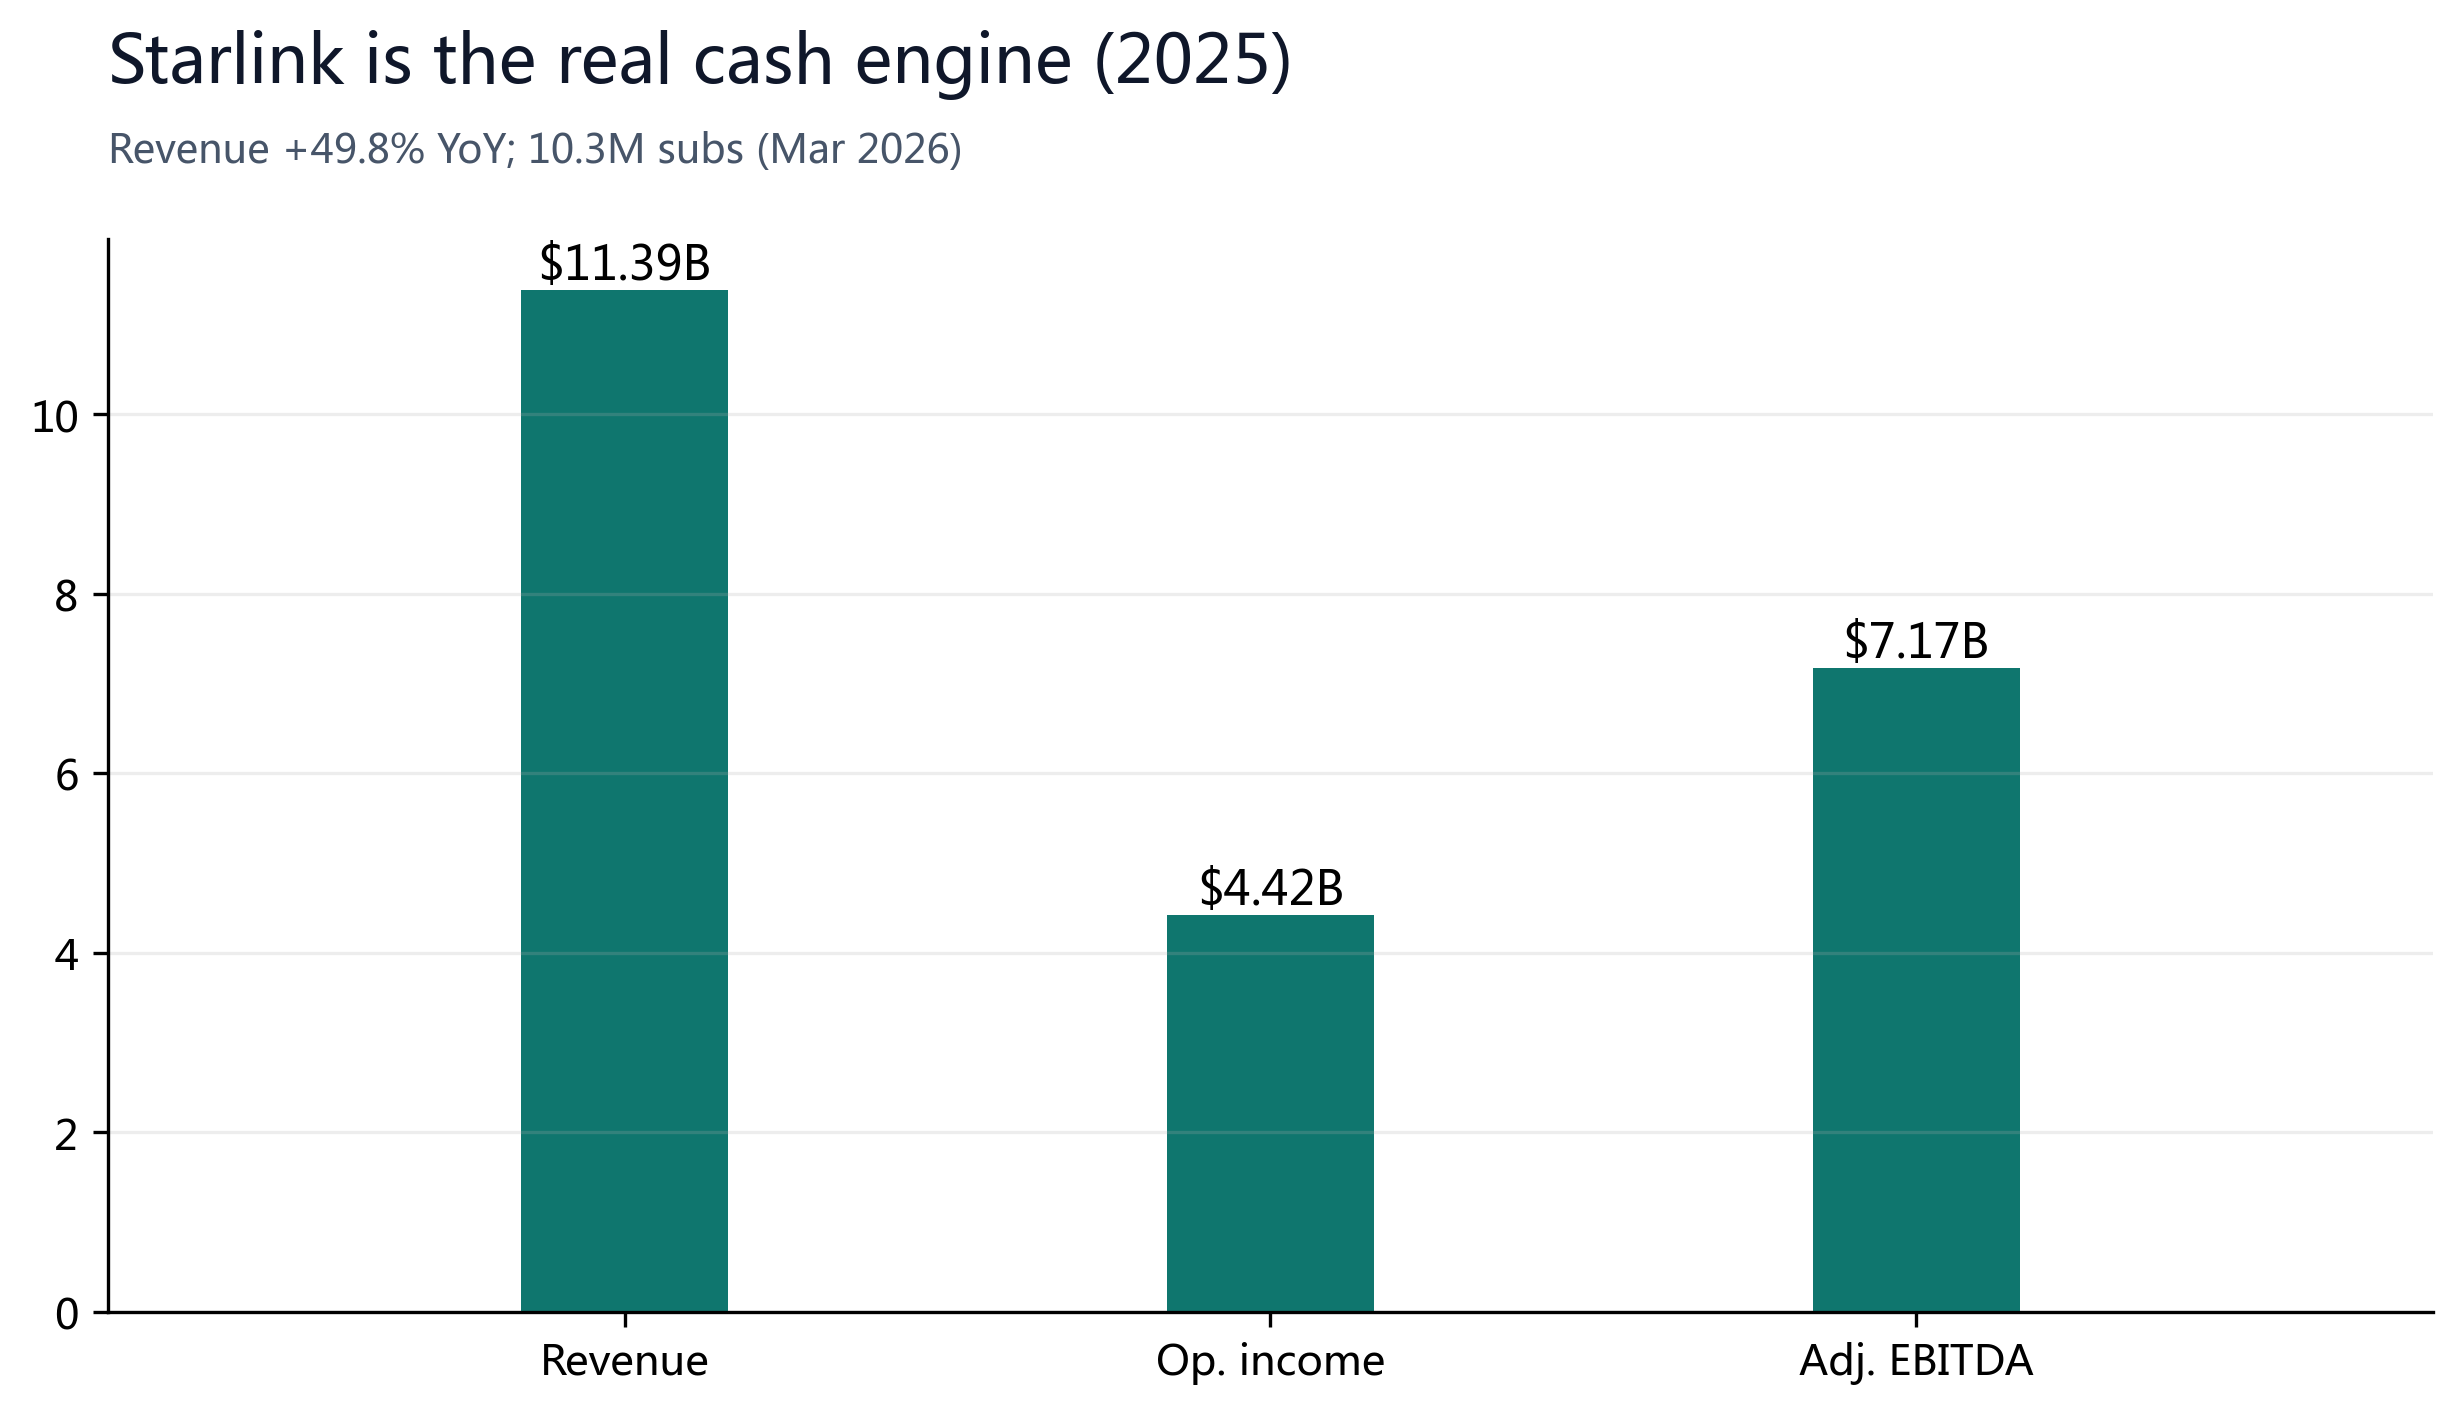
Starlink is already a genuine cash engine: 2025 revenue of $11.4B (+49.8% YoY), adjusted EBITDA of $7.17B and 10.3M subscribers, while the launch business holds a near-monopoly in commercial launch.
Layered with Starship's heavy-lift and interplanetary optionality and xAI's artificial-intelligence narrative, SpaceX offers investors a basket exposure to the space economy and frontier AI that is not available through any other vehicle. That scarcity alone warrants a valuation premium.
Risk side: not yet profitable, AI cash burn, lock-up ahead — what we are watching
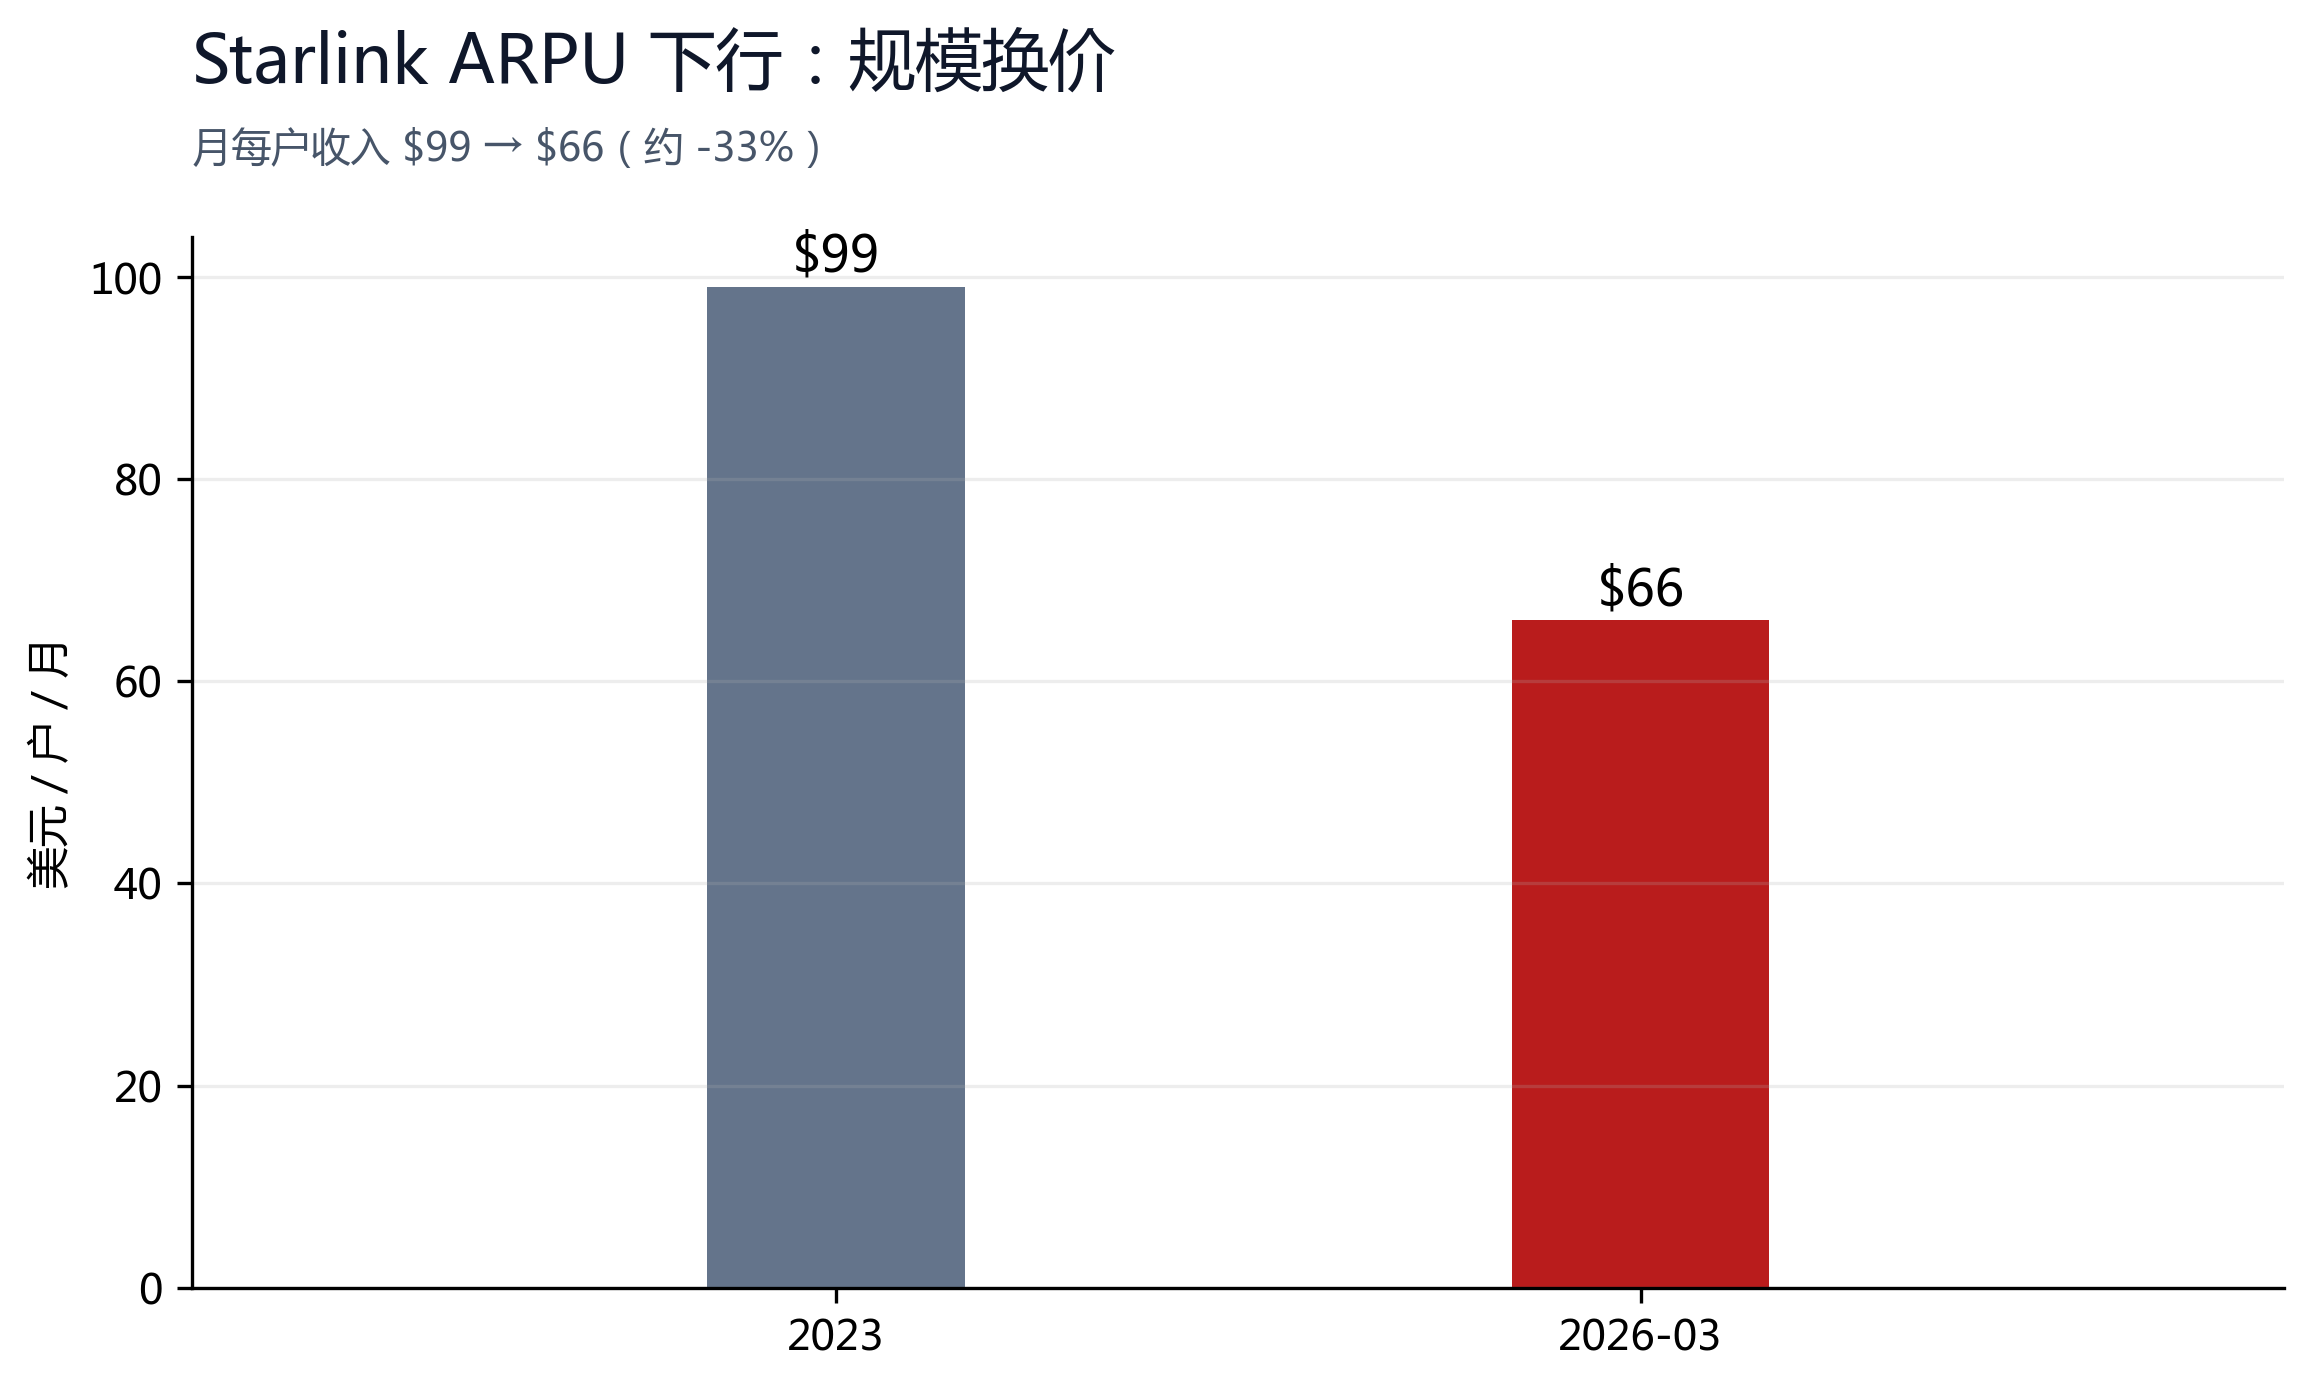
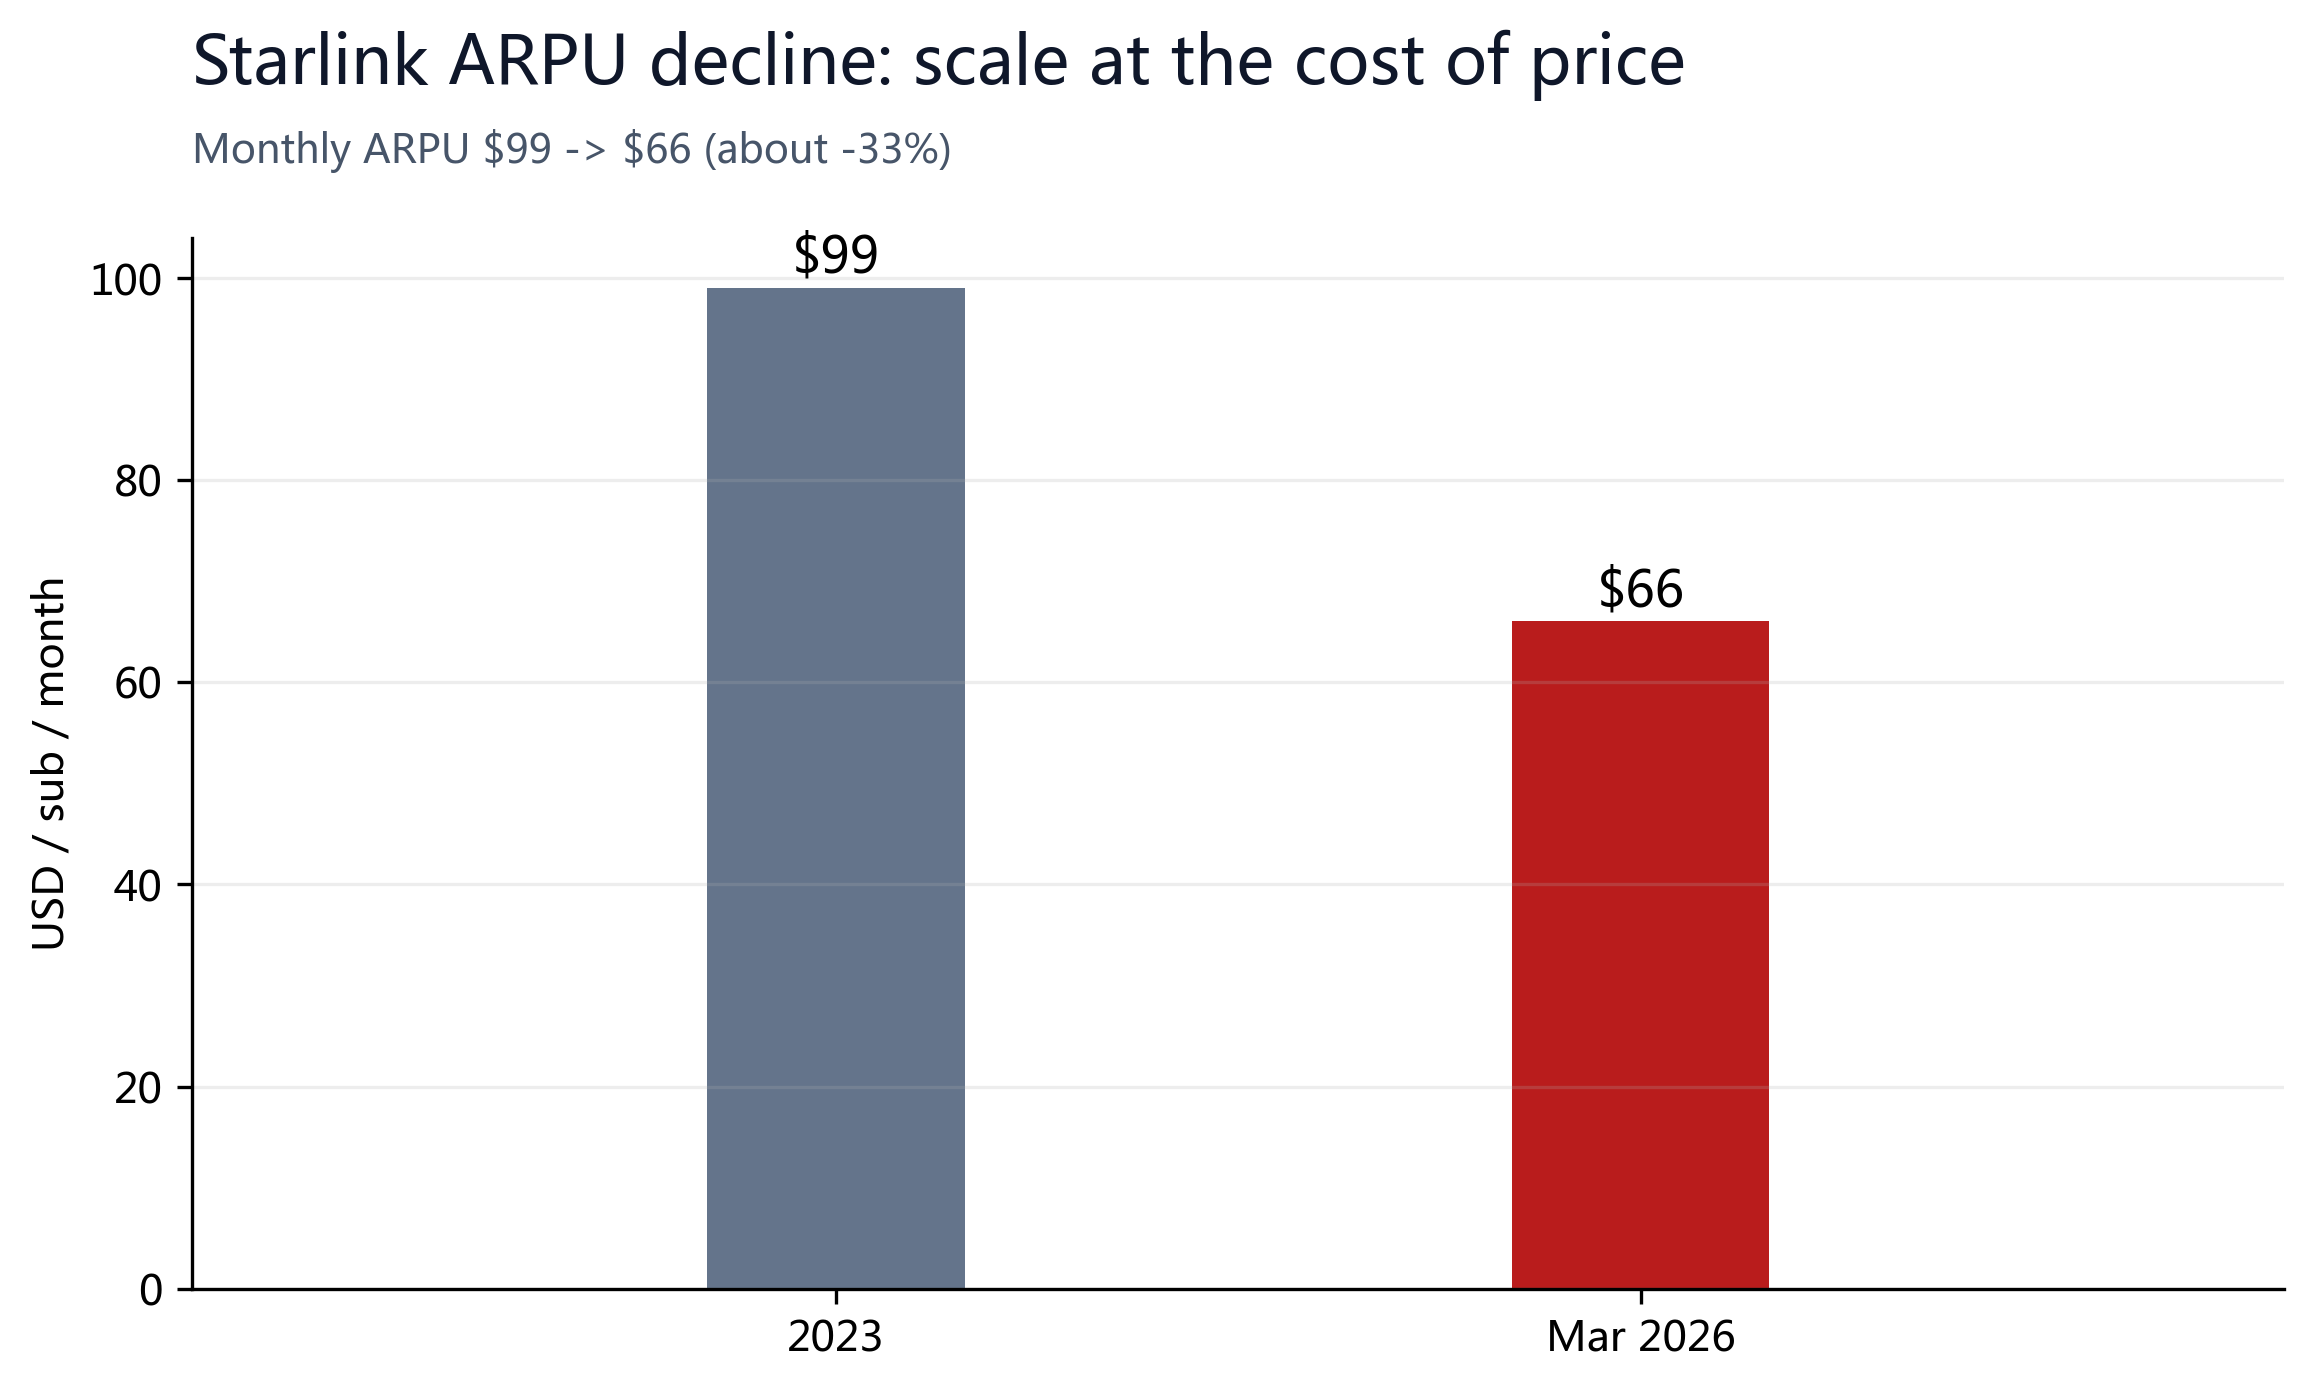
The $4.9B net loss in 2025 renders P/E analysis inapplicable. Starlink ARPU fell from $99 to $66, trading price for scale; xAI's $240B mark rests on primary-market rounds against only about $0.5B of standalone ARR; and the orbital AI data-center concept was called 'uneconomic' by the AWS CEO.
To be candid: on today's segment multiples alone, the bull-case SOTP is only about $133 per share. Sustaining the $218 price — let alone our $300+ target — therefore requires the market to believe the forward growth will land. We think management's targets (growth rising further from 33%, gross margin 49%→70%, a $26.5T AI TAM) provide that basis, which is why we sit on the bull side; but it also means that any disappointment in AI monetization or Starship timing would bring a fast drawdown.
With growth still above 33% and management guiding gross margin toward 70%, we think paying a premium for that curve is reasonable today, and we see $400+ per share over three years. This is a bullish call grounded in growth and scarcity, not a dismissal of the risks — downside is in §09, and we view a lock-up pullback as a chance to add, not a reason to exit.
§04Financial Truth (from the S-1)
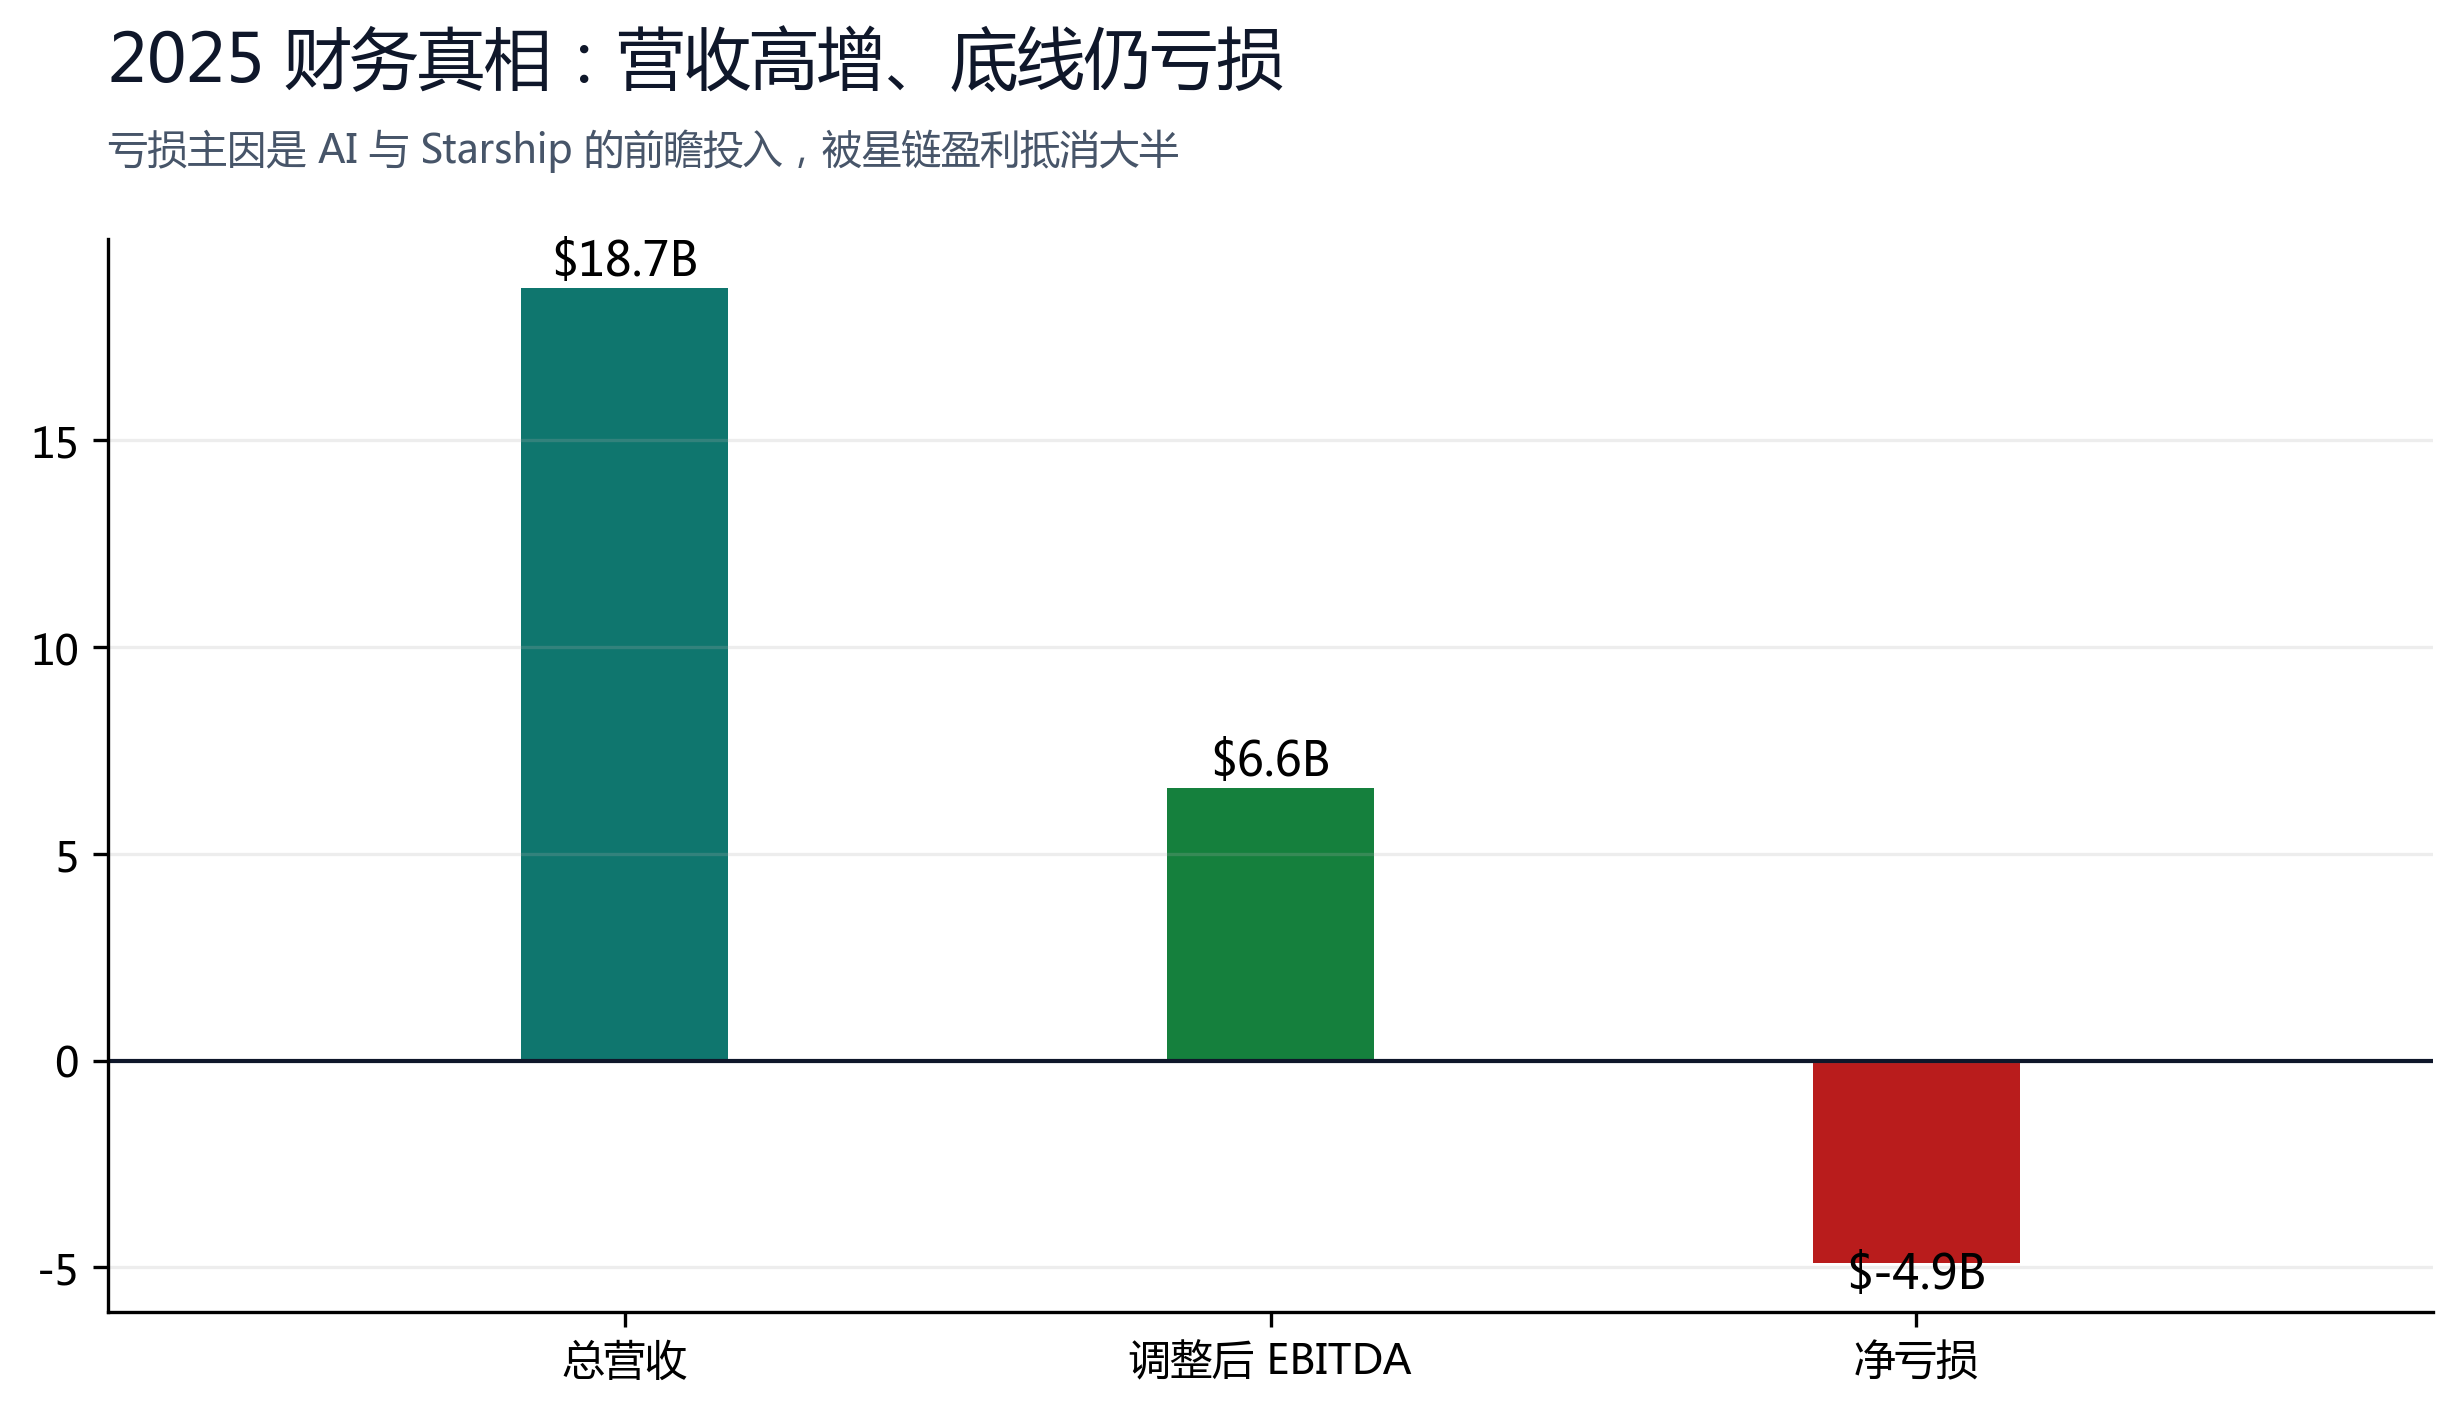
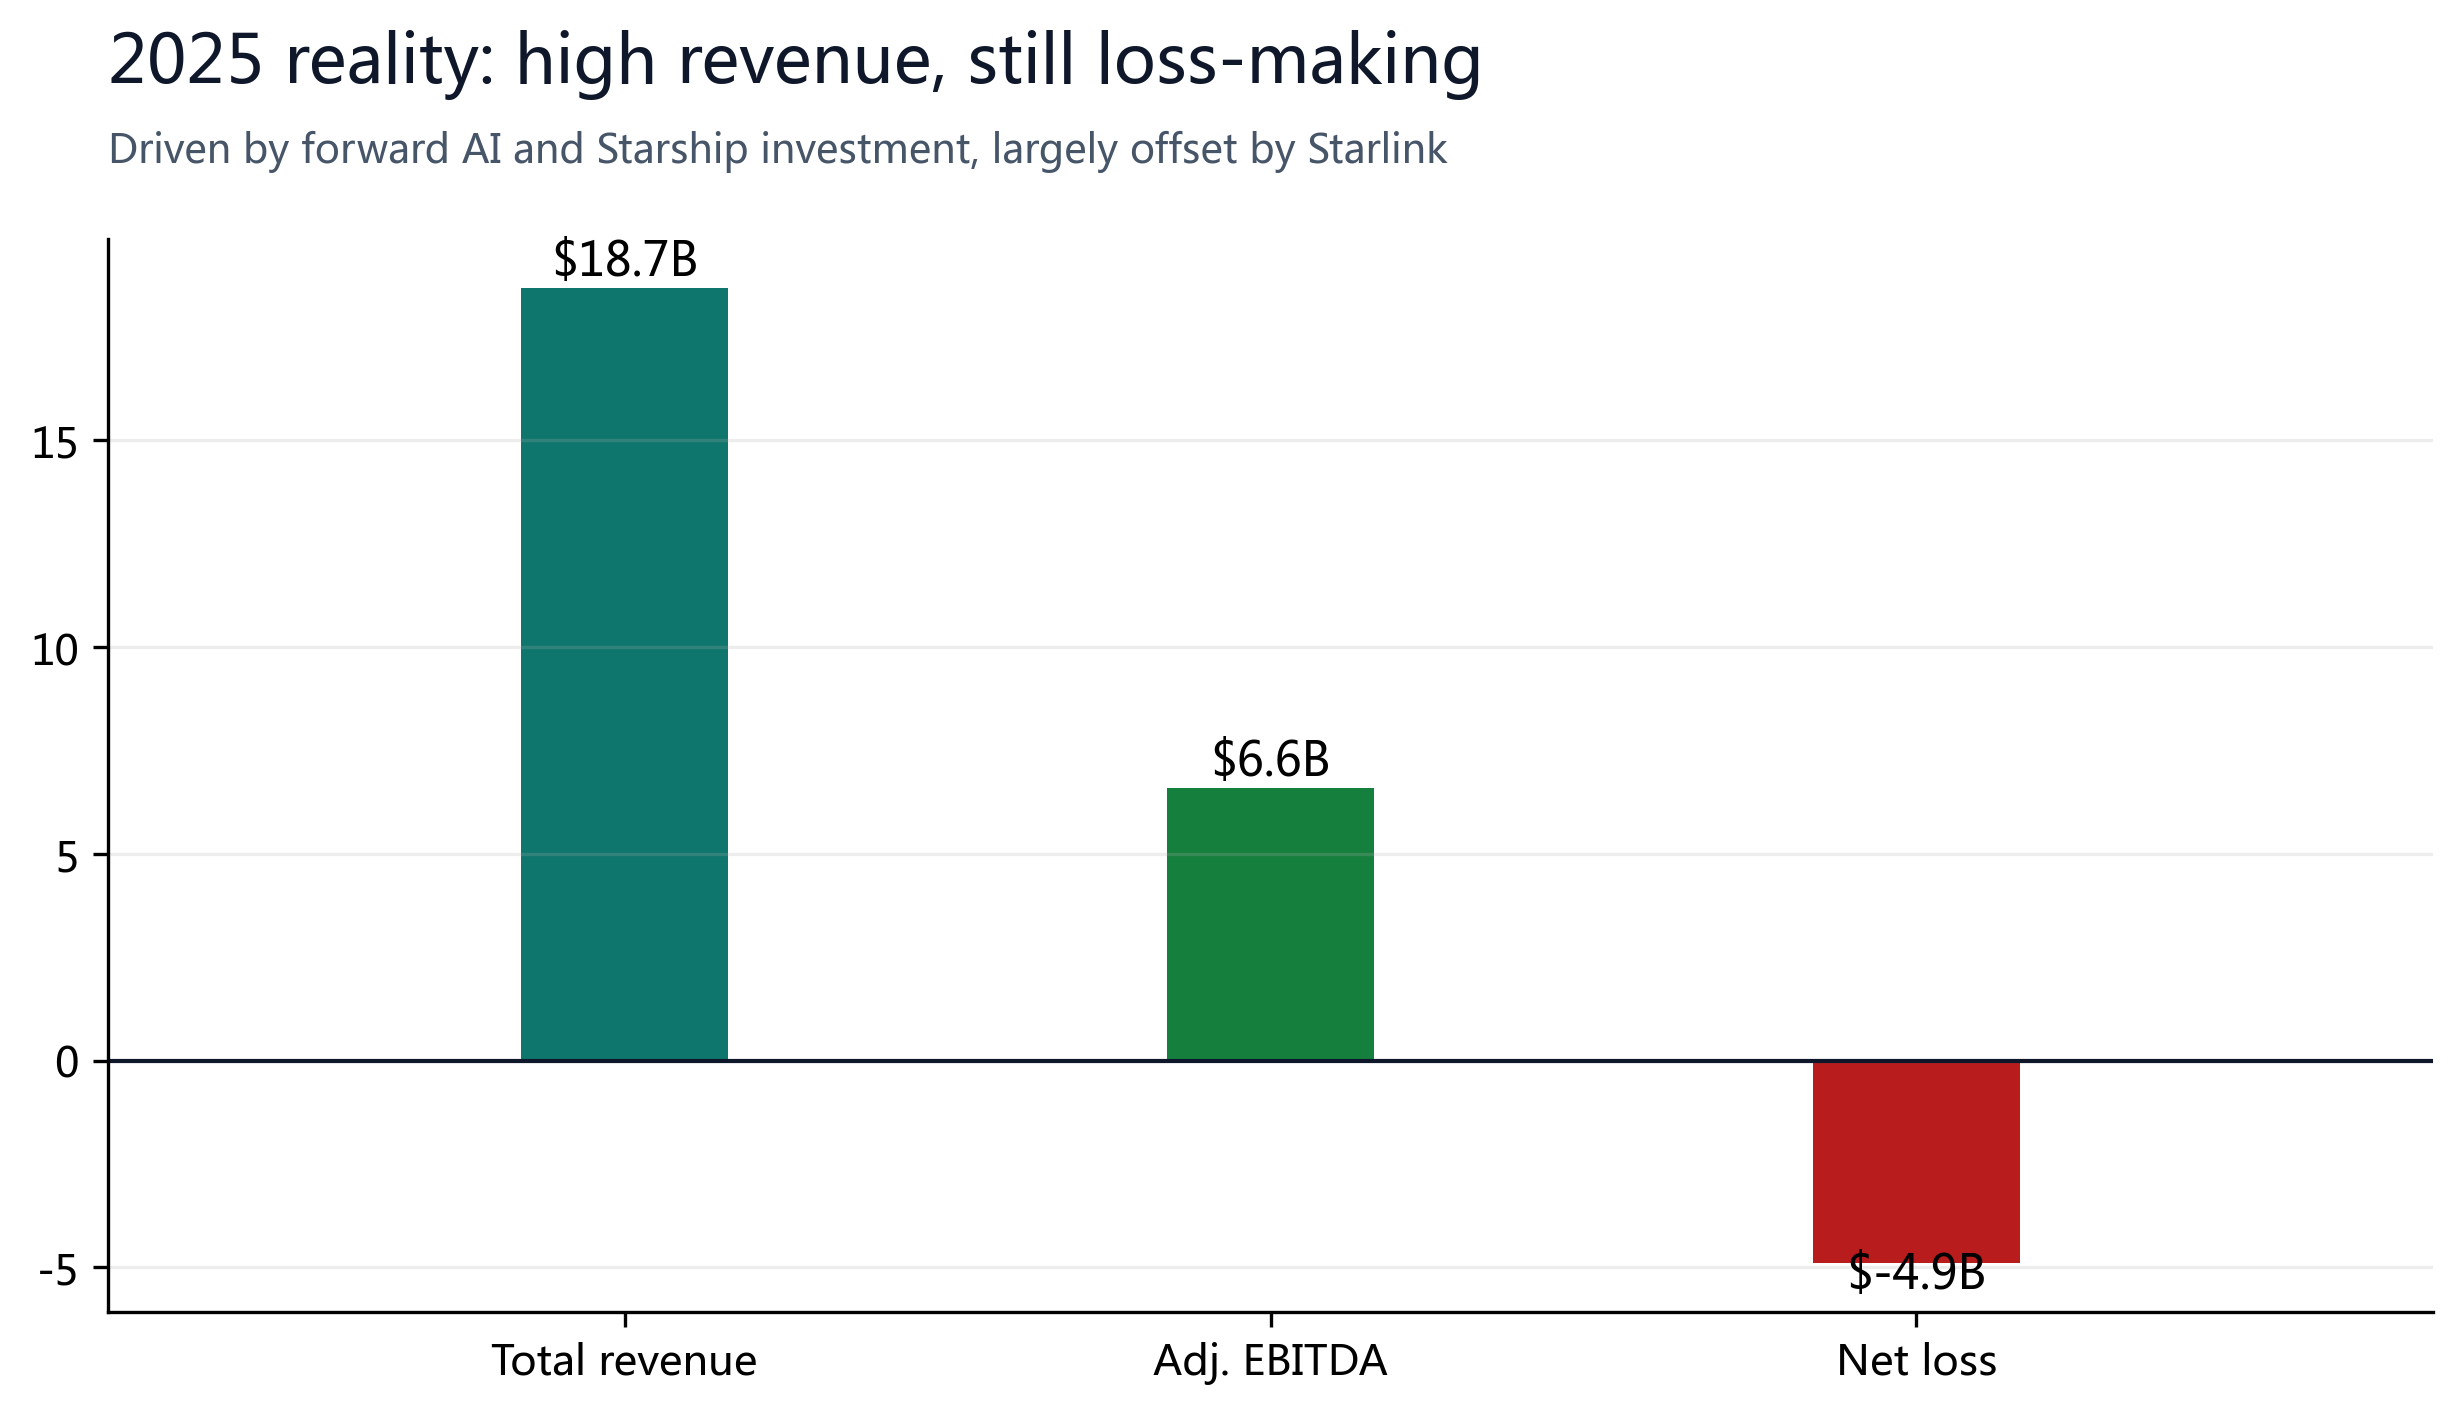
The S-1 (May 20, 2026) disclosed audited financials for the first time, correcting the optimistic figures circulating before the IPO. 2025 total revenue was $18.7B, with a $2.6B operating loss, a $4.9B net loss and $6.6B of adjusted EBITDA. The loss reflects heavy forward investment, not weak core economics: the biggest cash drain is the AI business (about a $6.36B operating loss in 2025), alongside roughly $3B of Starship R&D and $20.7B of capex, largely offset by Starlink's strong profitability.
By segment, Starlink is the clear profit center — its $7.17B of adjusted EBITDA alone exceeds the company-wide figure; the Launch segment runs about +$0.7B of adjusted EBITDA (still positive, though dragged down by Starship R&D versus the prior year); and the AI segment, at about −$1.2B, is the only negative contributor. In short, the group loss comes mainly from forward investment in AI and Starship, not from weakness in the core.
| Metric | 2025 | Note |
|---|---|---|
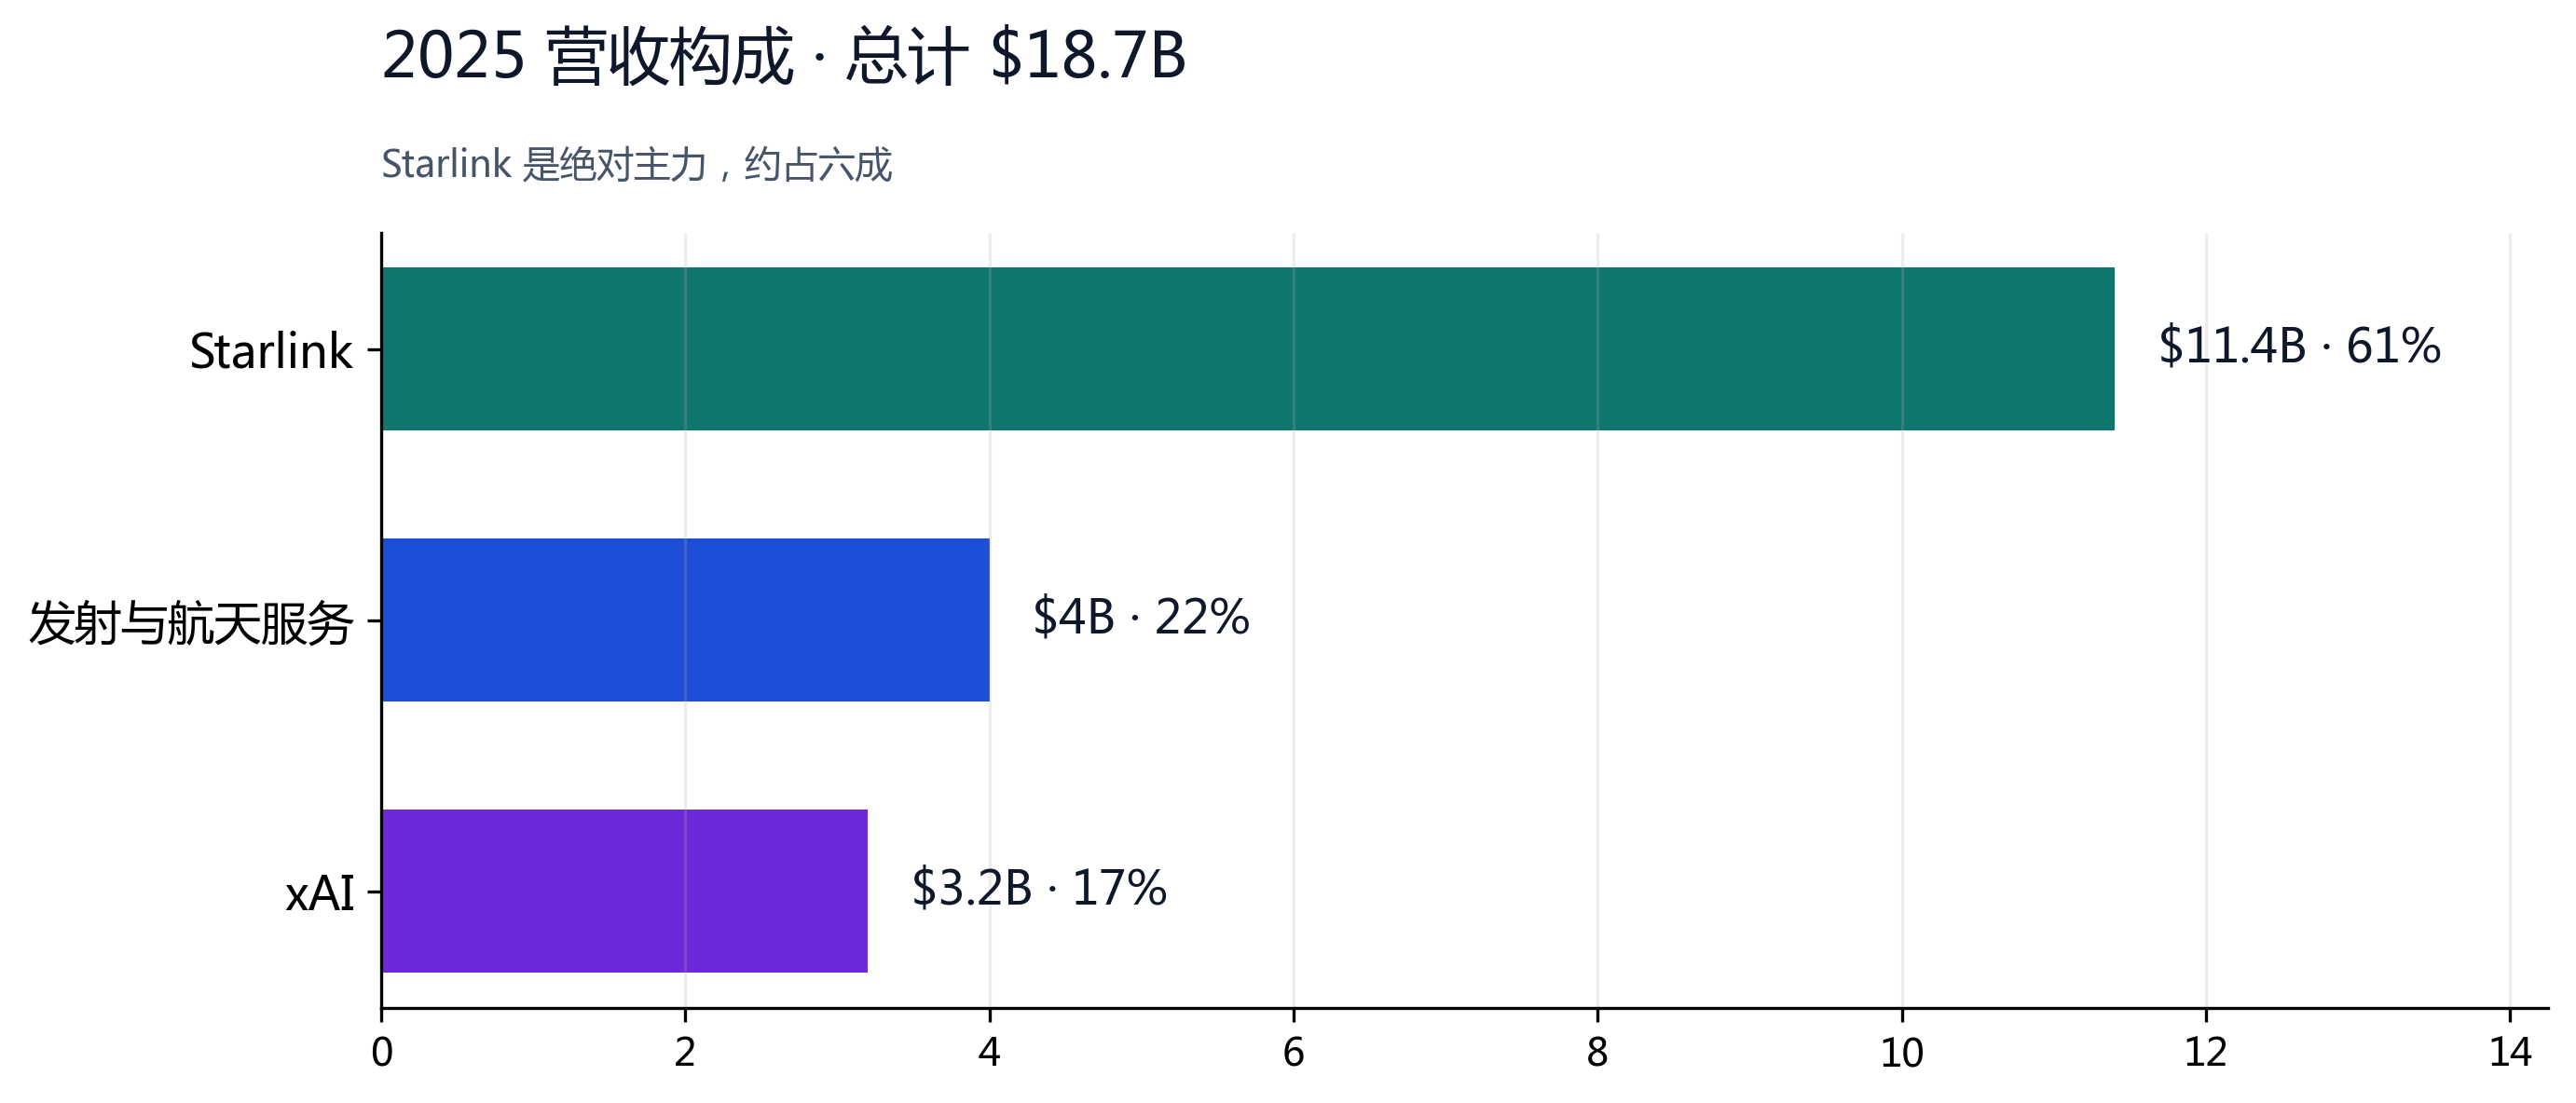
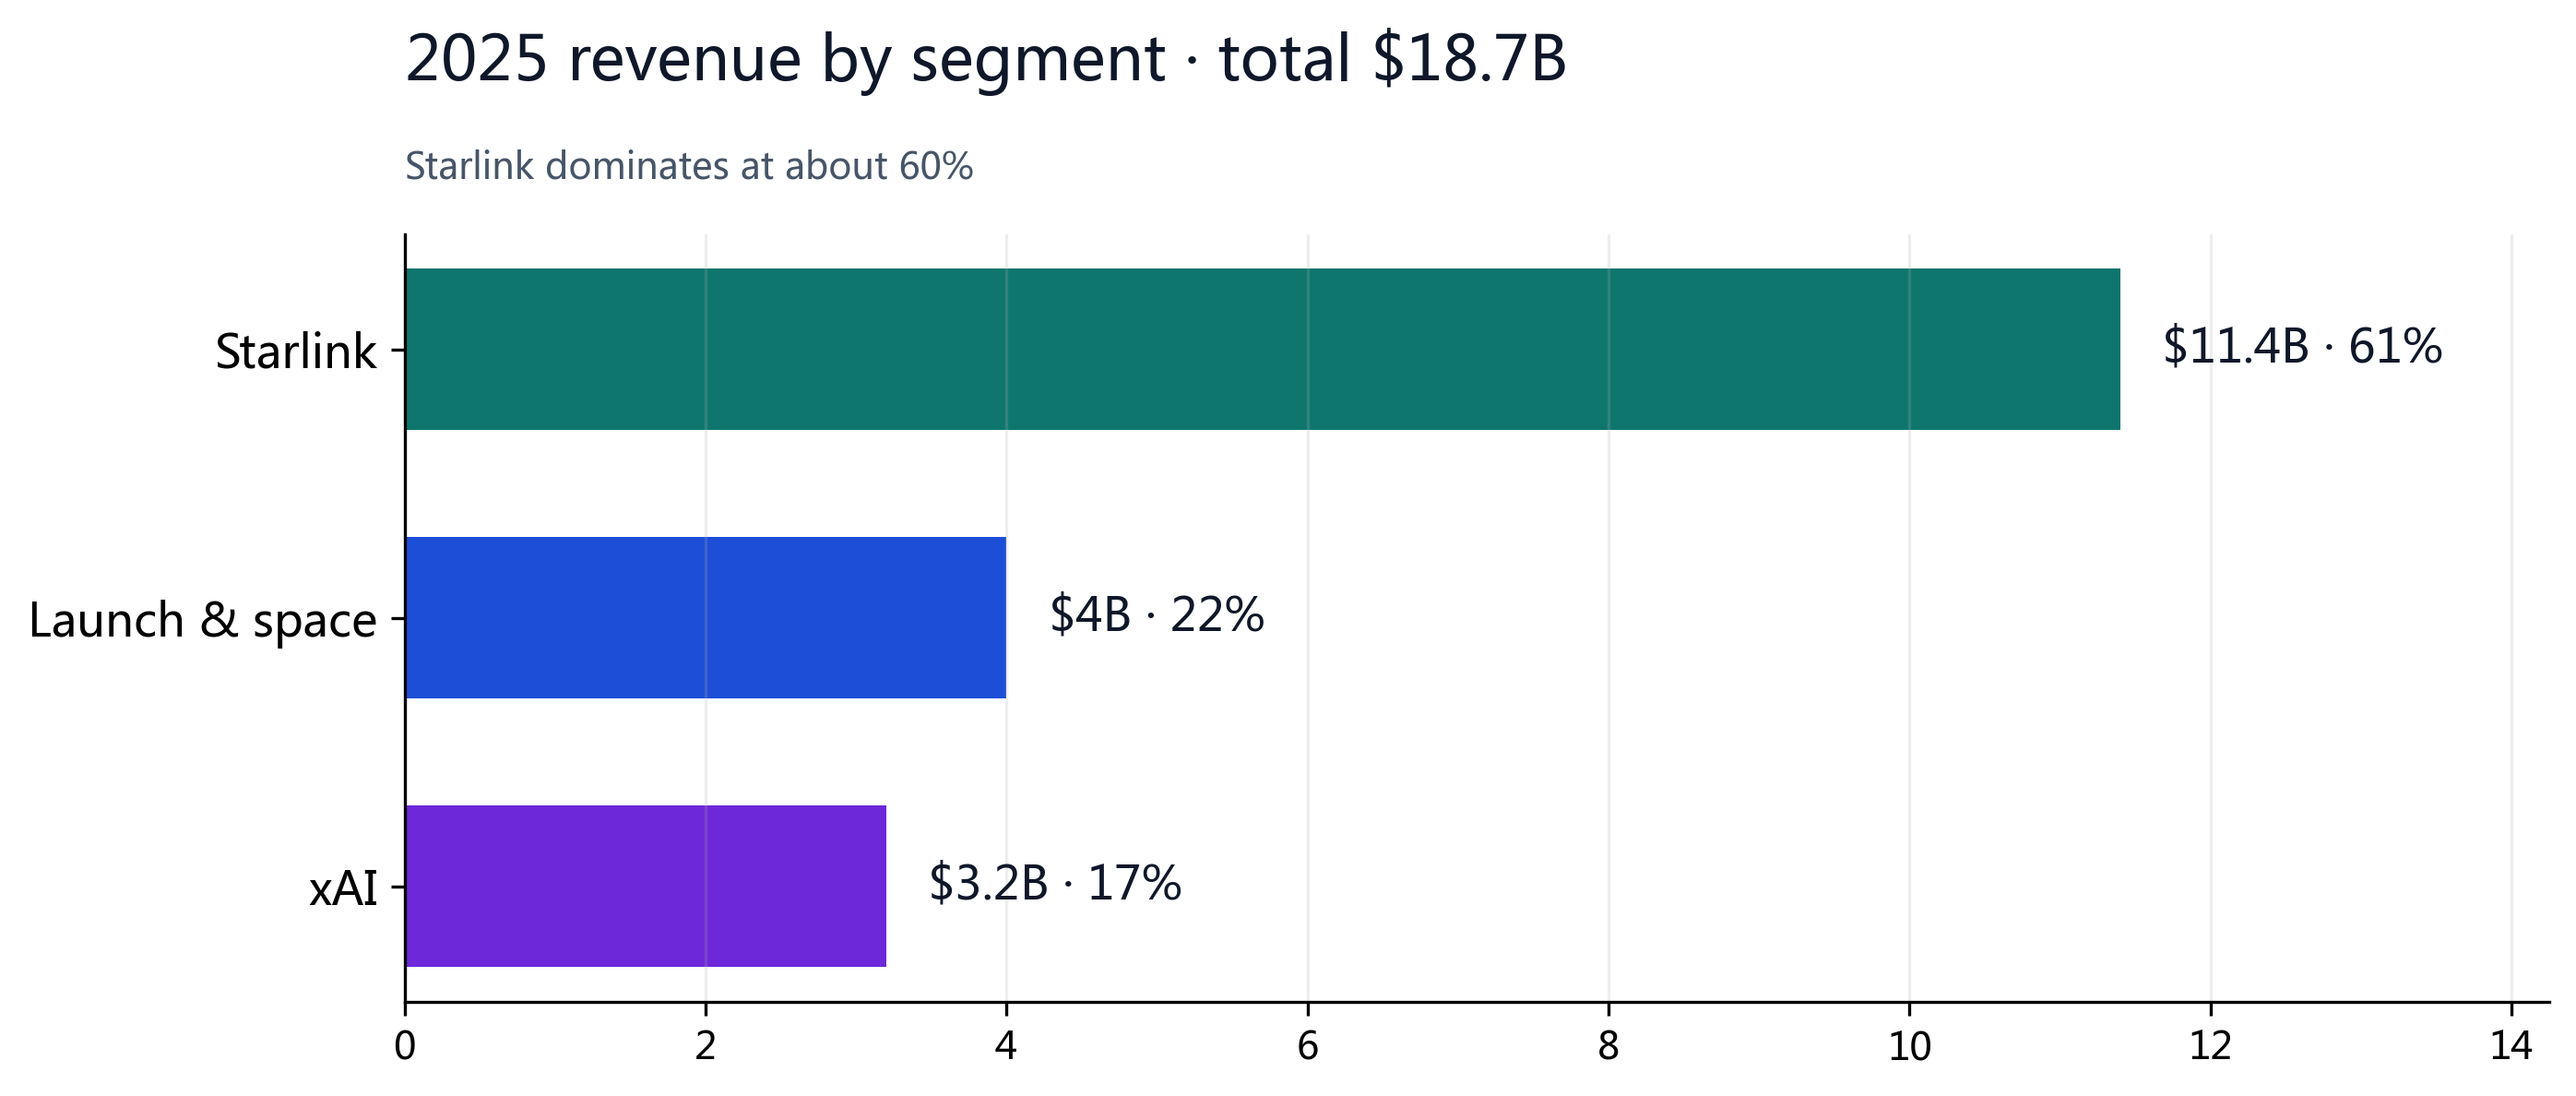
| Total revenue | $18.7B | Starlink $11.4B / Launch & space $4.0B / xAI $3.2B |
| Adjusted EBITDA | $6.6B | Starlink segment alone is $7.17B |
| Operating loss | -$2.6B | Mainly AI segment (~$6.36B op loss), largely offset by Starlink |
| Net loss | -$4.9B | P/E breaks down; hence SOTP |
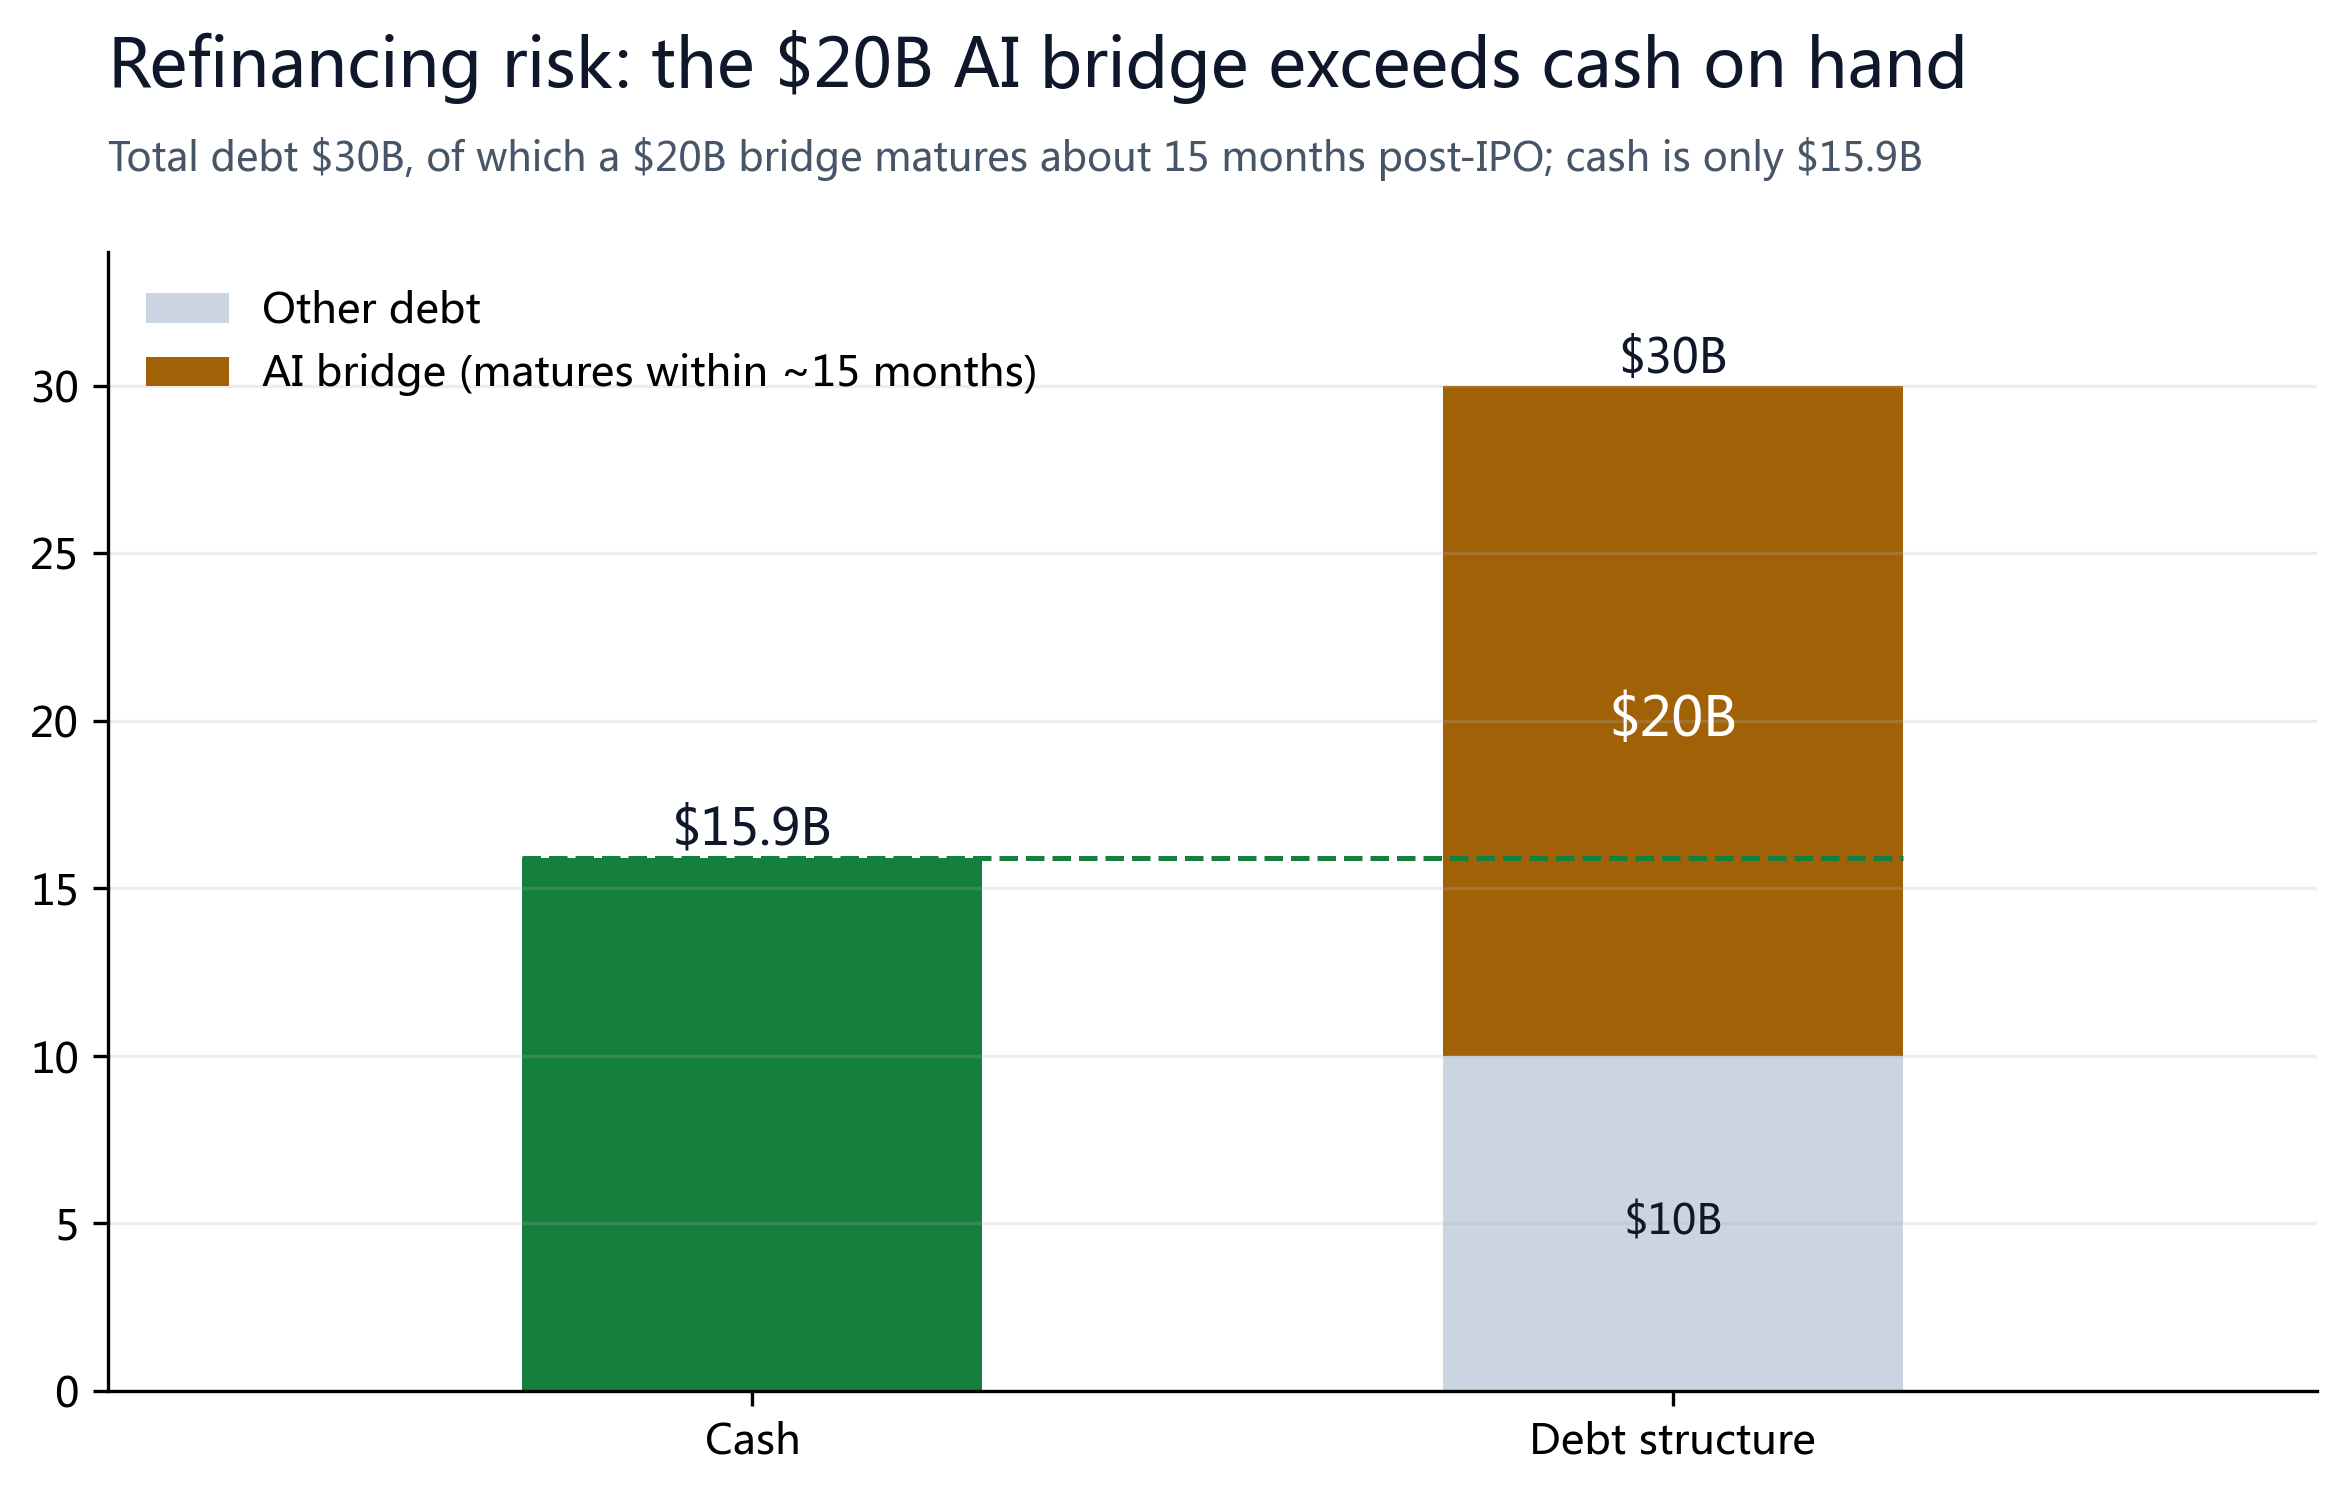
| Cash / debt | $15.9B / $30B | Net debt about $14B; includes $20B AI bridge |

§05SOTP Valuation
Because the company is loss-making overall, we value each segment separately and sum the parts.
Each business is given a bear/base/bull range, with multiples drawn from its respective comparable logic: Starlink against high-growth connectivity, Launch as a strategic monopoly, xAI at primary-market marks, and Starship on an option-scenario basis. The table below lists all three scenarios (bear/base/bull).
| Segment | Method | Bear | Base | Bull |
|---|---|---|---|---|
| Starlink | Forward EBITDA x growth multiple | $200B | $350B | $500B |
| Launch & government (ex-Starship) | 8-16x revenue (strategic monopoly) | $30B | $50B | $90B |
| Starship | Option / scenario | $25B | $150B | $500B |
| xAI | Primary marks ($230-250B) | $150B | $240B | $450B |
| Orbital AI data centers | Concept option (zero in base) | $0B | $0B | $150B |
| (-) Net debt / (+) net cash | Q1 net debt $14B; improves post-IPO | -$14B | +$30B | +$50B |
| Equity value | Sum of parts | $391B | $820B | $1740B |
| Per share (÷13.1B sh) | Fair value | $30 | $63 | $133 |
Our base case assigns $150B, reflecting successful commercialization of heavy-lift launch without yet realizing an interplanetary or orbital economy. This is the most debatable single assumption in the model.
§06Market Size, TAM and Where the Price Comes From
The trailing-revenue SOTP yields an intrinsic value of the operating businesses of about $63/share, but because it counts only what monetizes today, it structurally understates a company with a multi-trillion TAM.
The gap between the price and that intrinsic value is not all froth: much of it is the market pricing in SpaceX's future market opportunity across several fast-growing markets.
| Market | 2025 | 2035E | CAGR | SpaceX position |
|---|---|---|---|---|
| Global launch | $22B | $70-92B | ~13% | ~80-90% mass-to-orbit; Starship sharply lowers cost per kg |
| Orbital compute | $1.5B | $26-105B | 50-67% | the indispensable low-cost gateway to orbit |
| SpaceX-stated TAM | — | $28.5T | — | Connectivity $1.6T + Launch $370B + AI $26.5T |
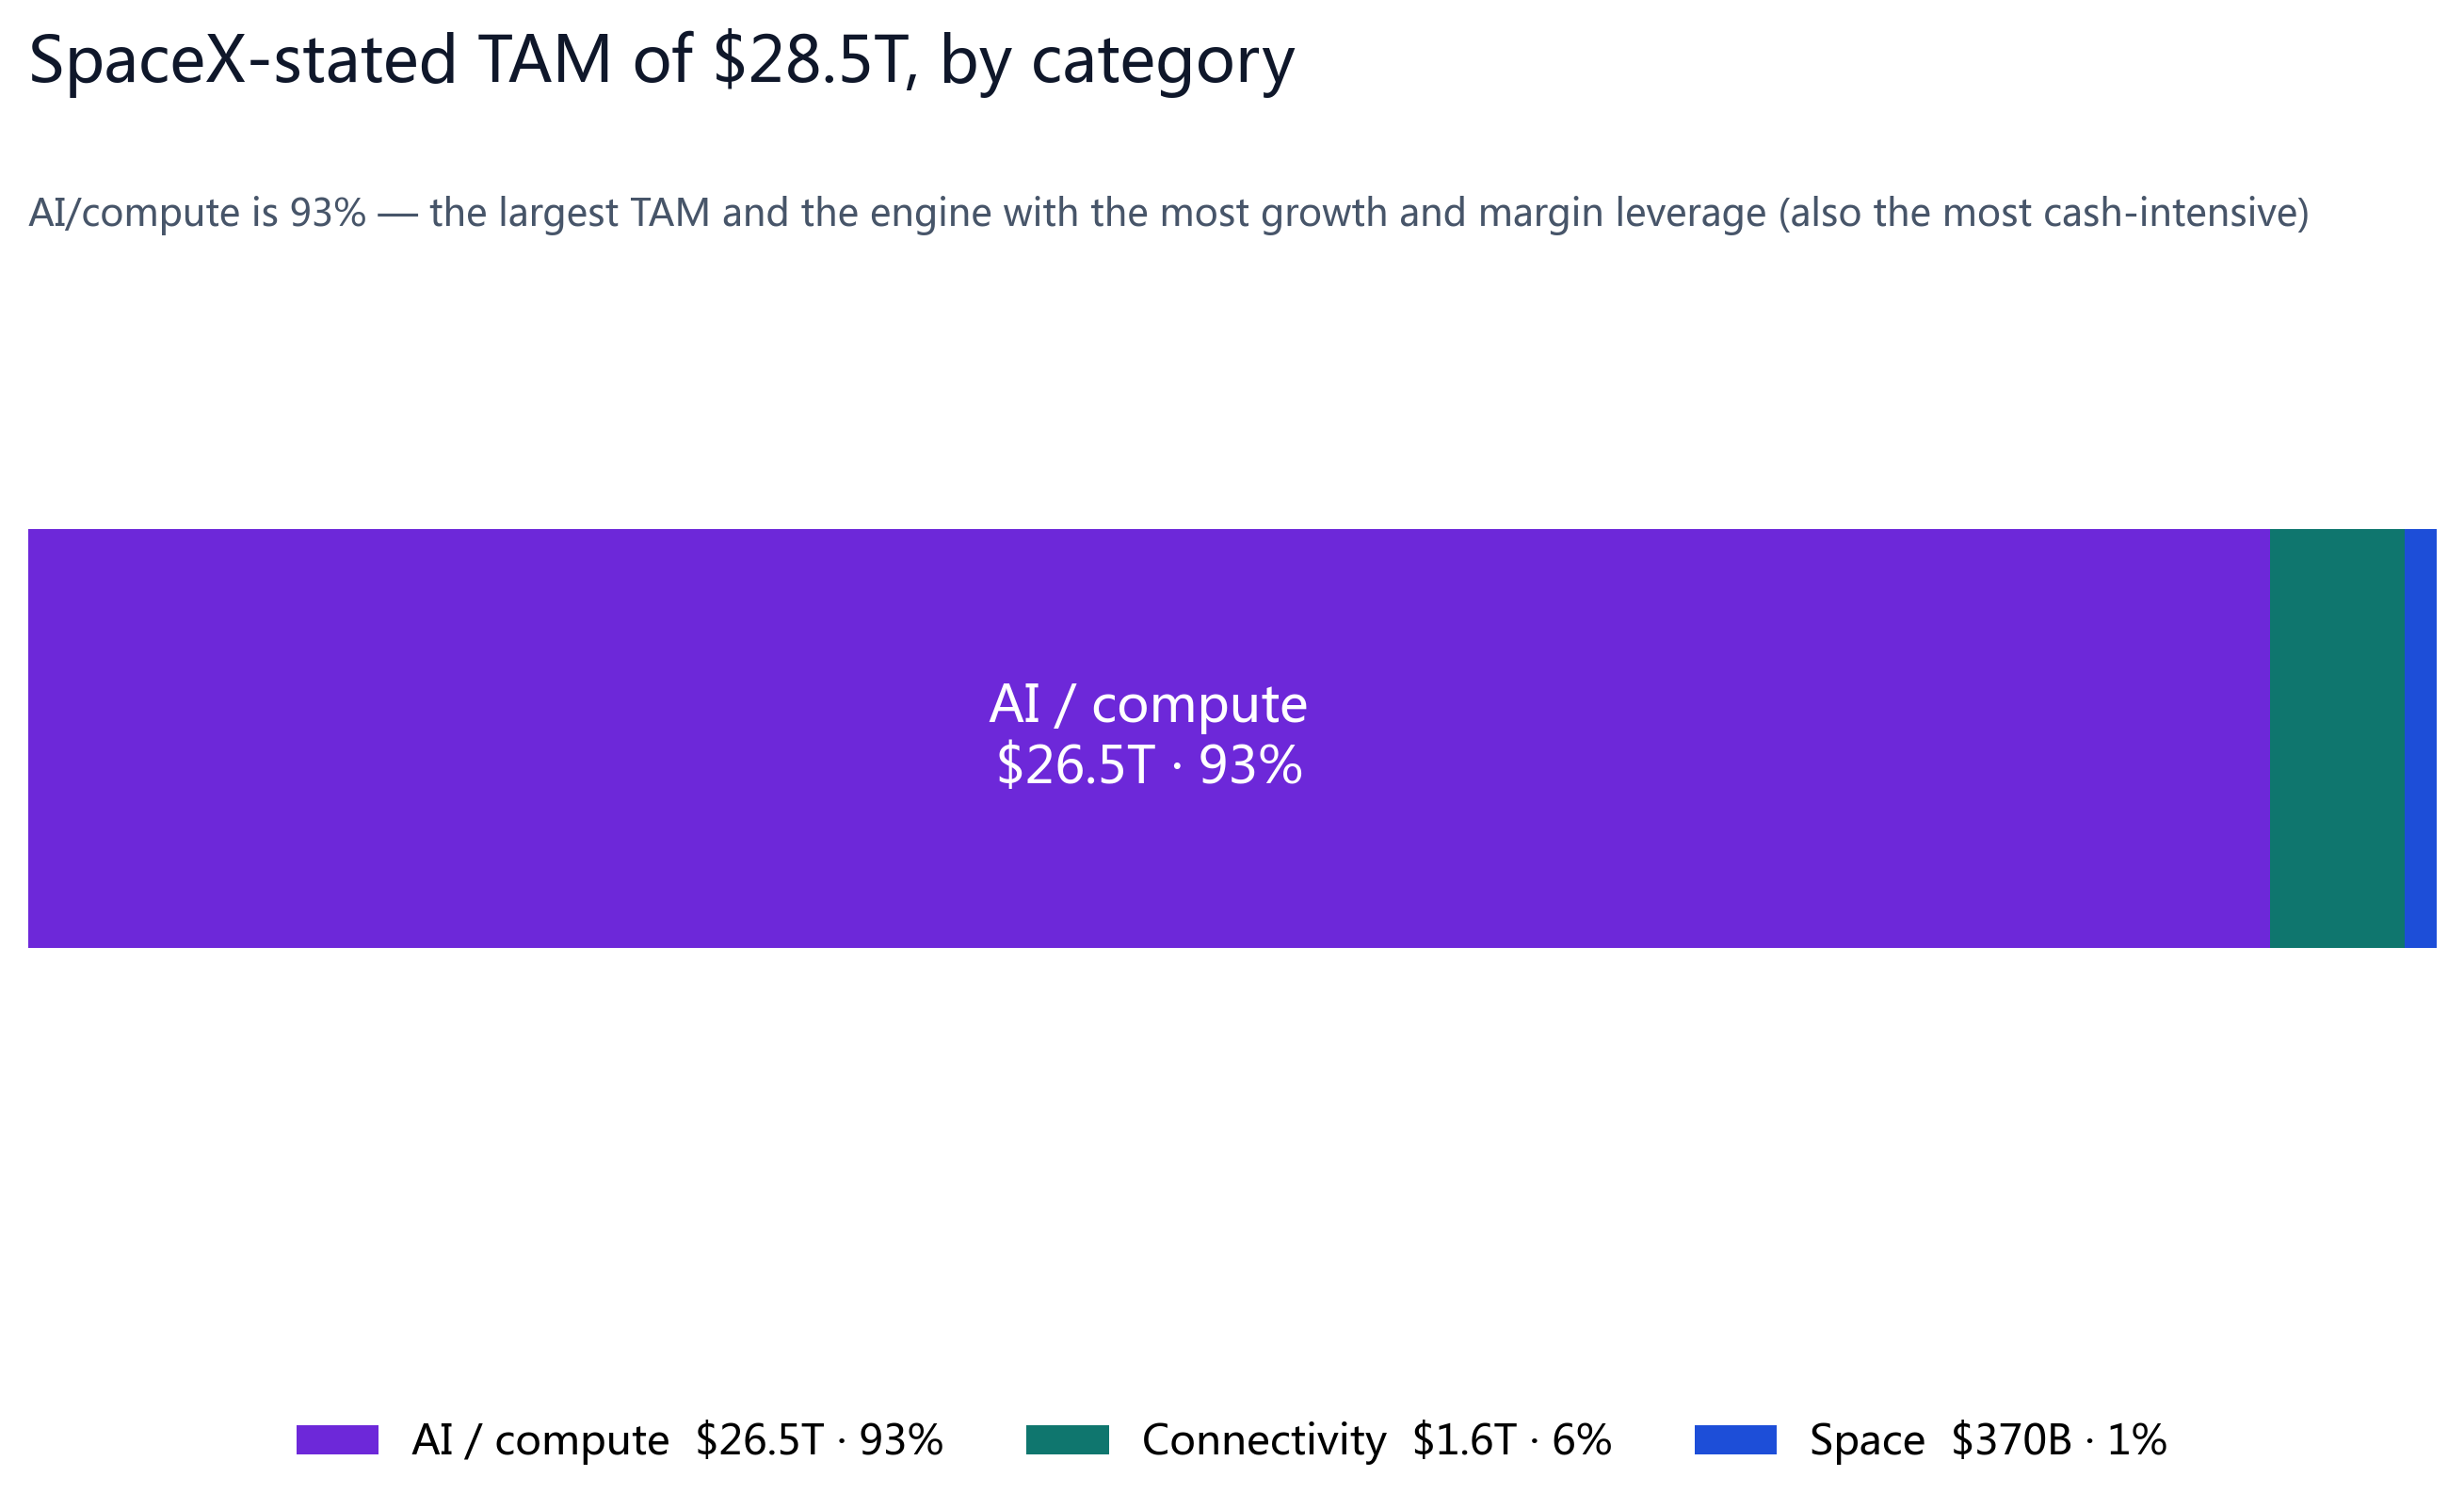
A compute-demand explosion is therefore a launch-demand explosion, with SpaceX as the indispensable gateway to space. Launch, compute and global connectivity converge on one company — the real reason the market pays a premium, not pure narrative.
Two lines: today's floor vs the three-year growth target
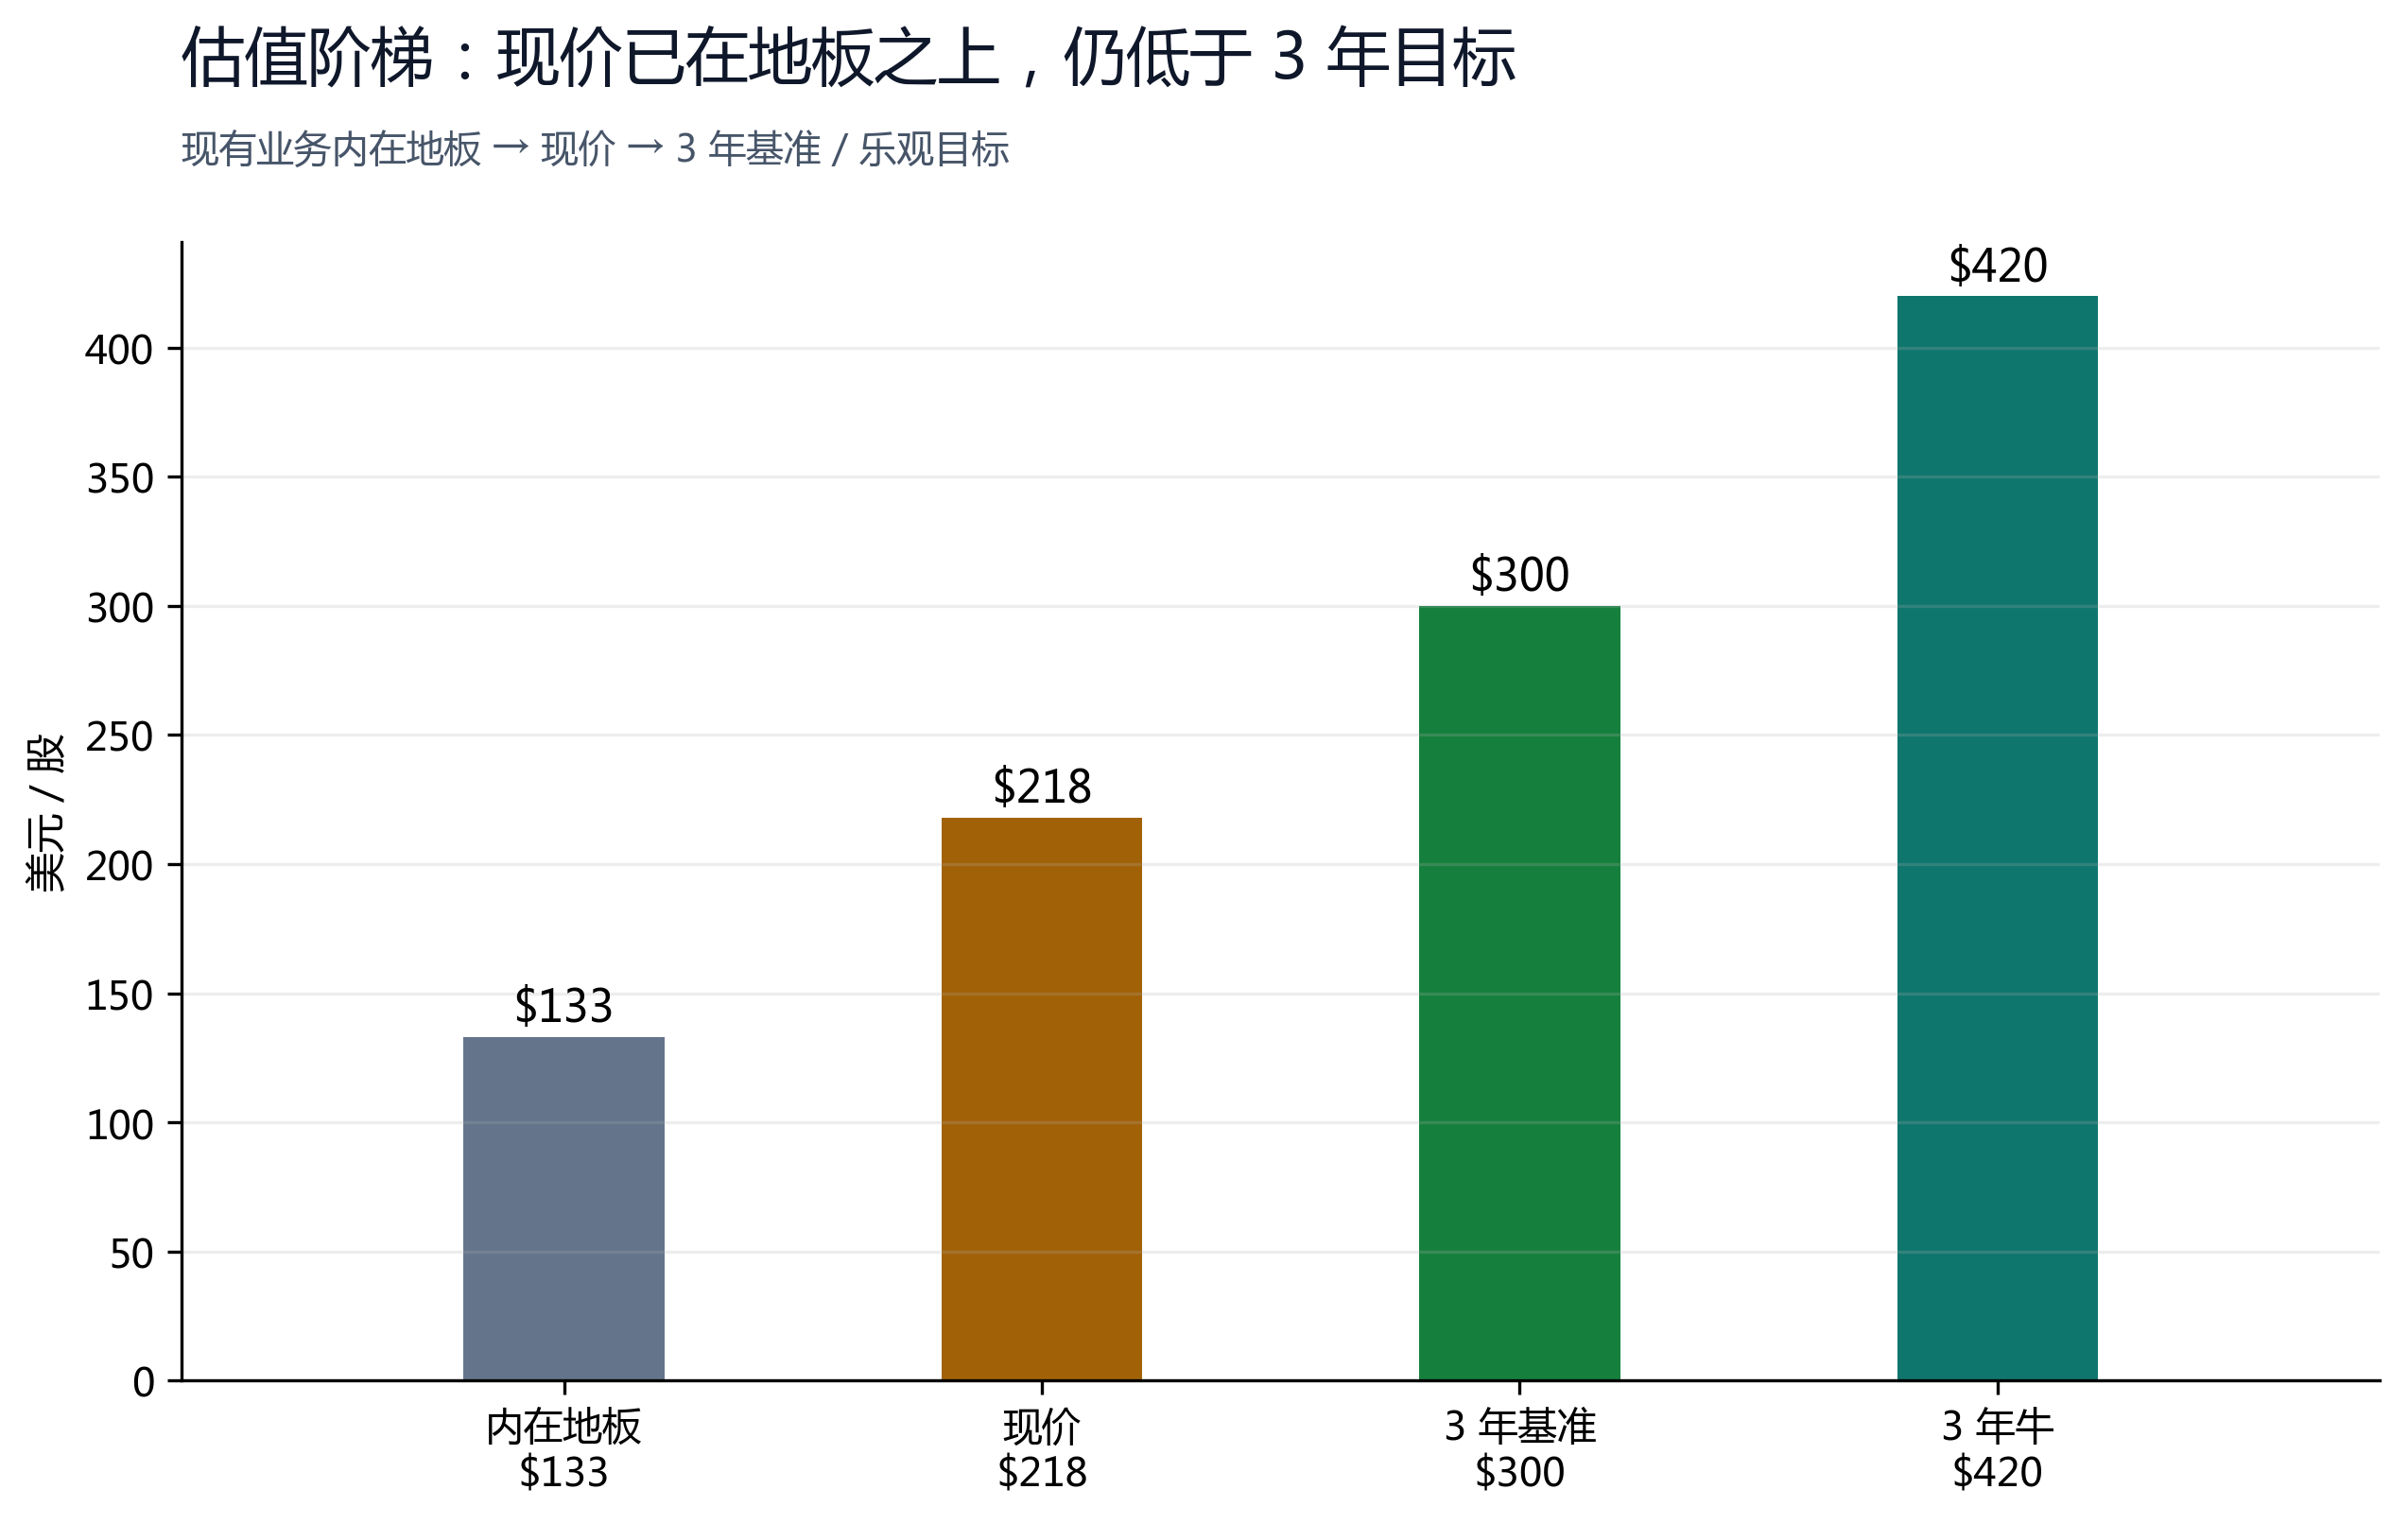
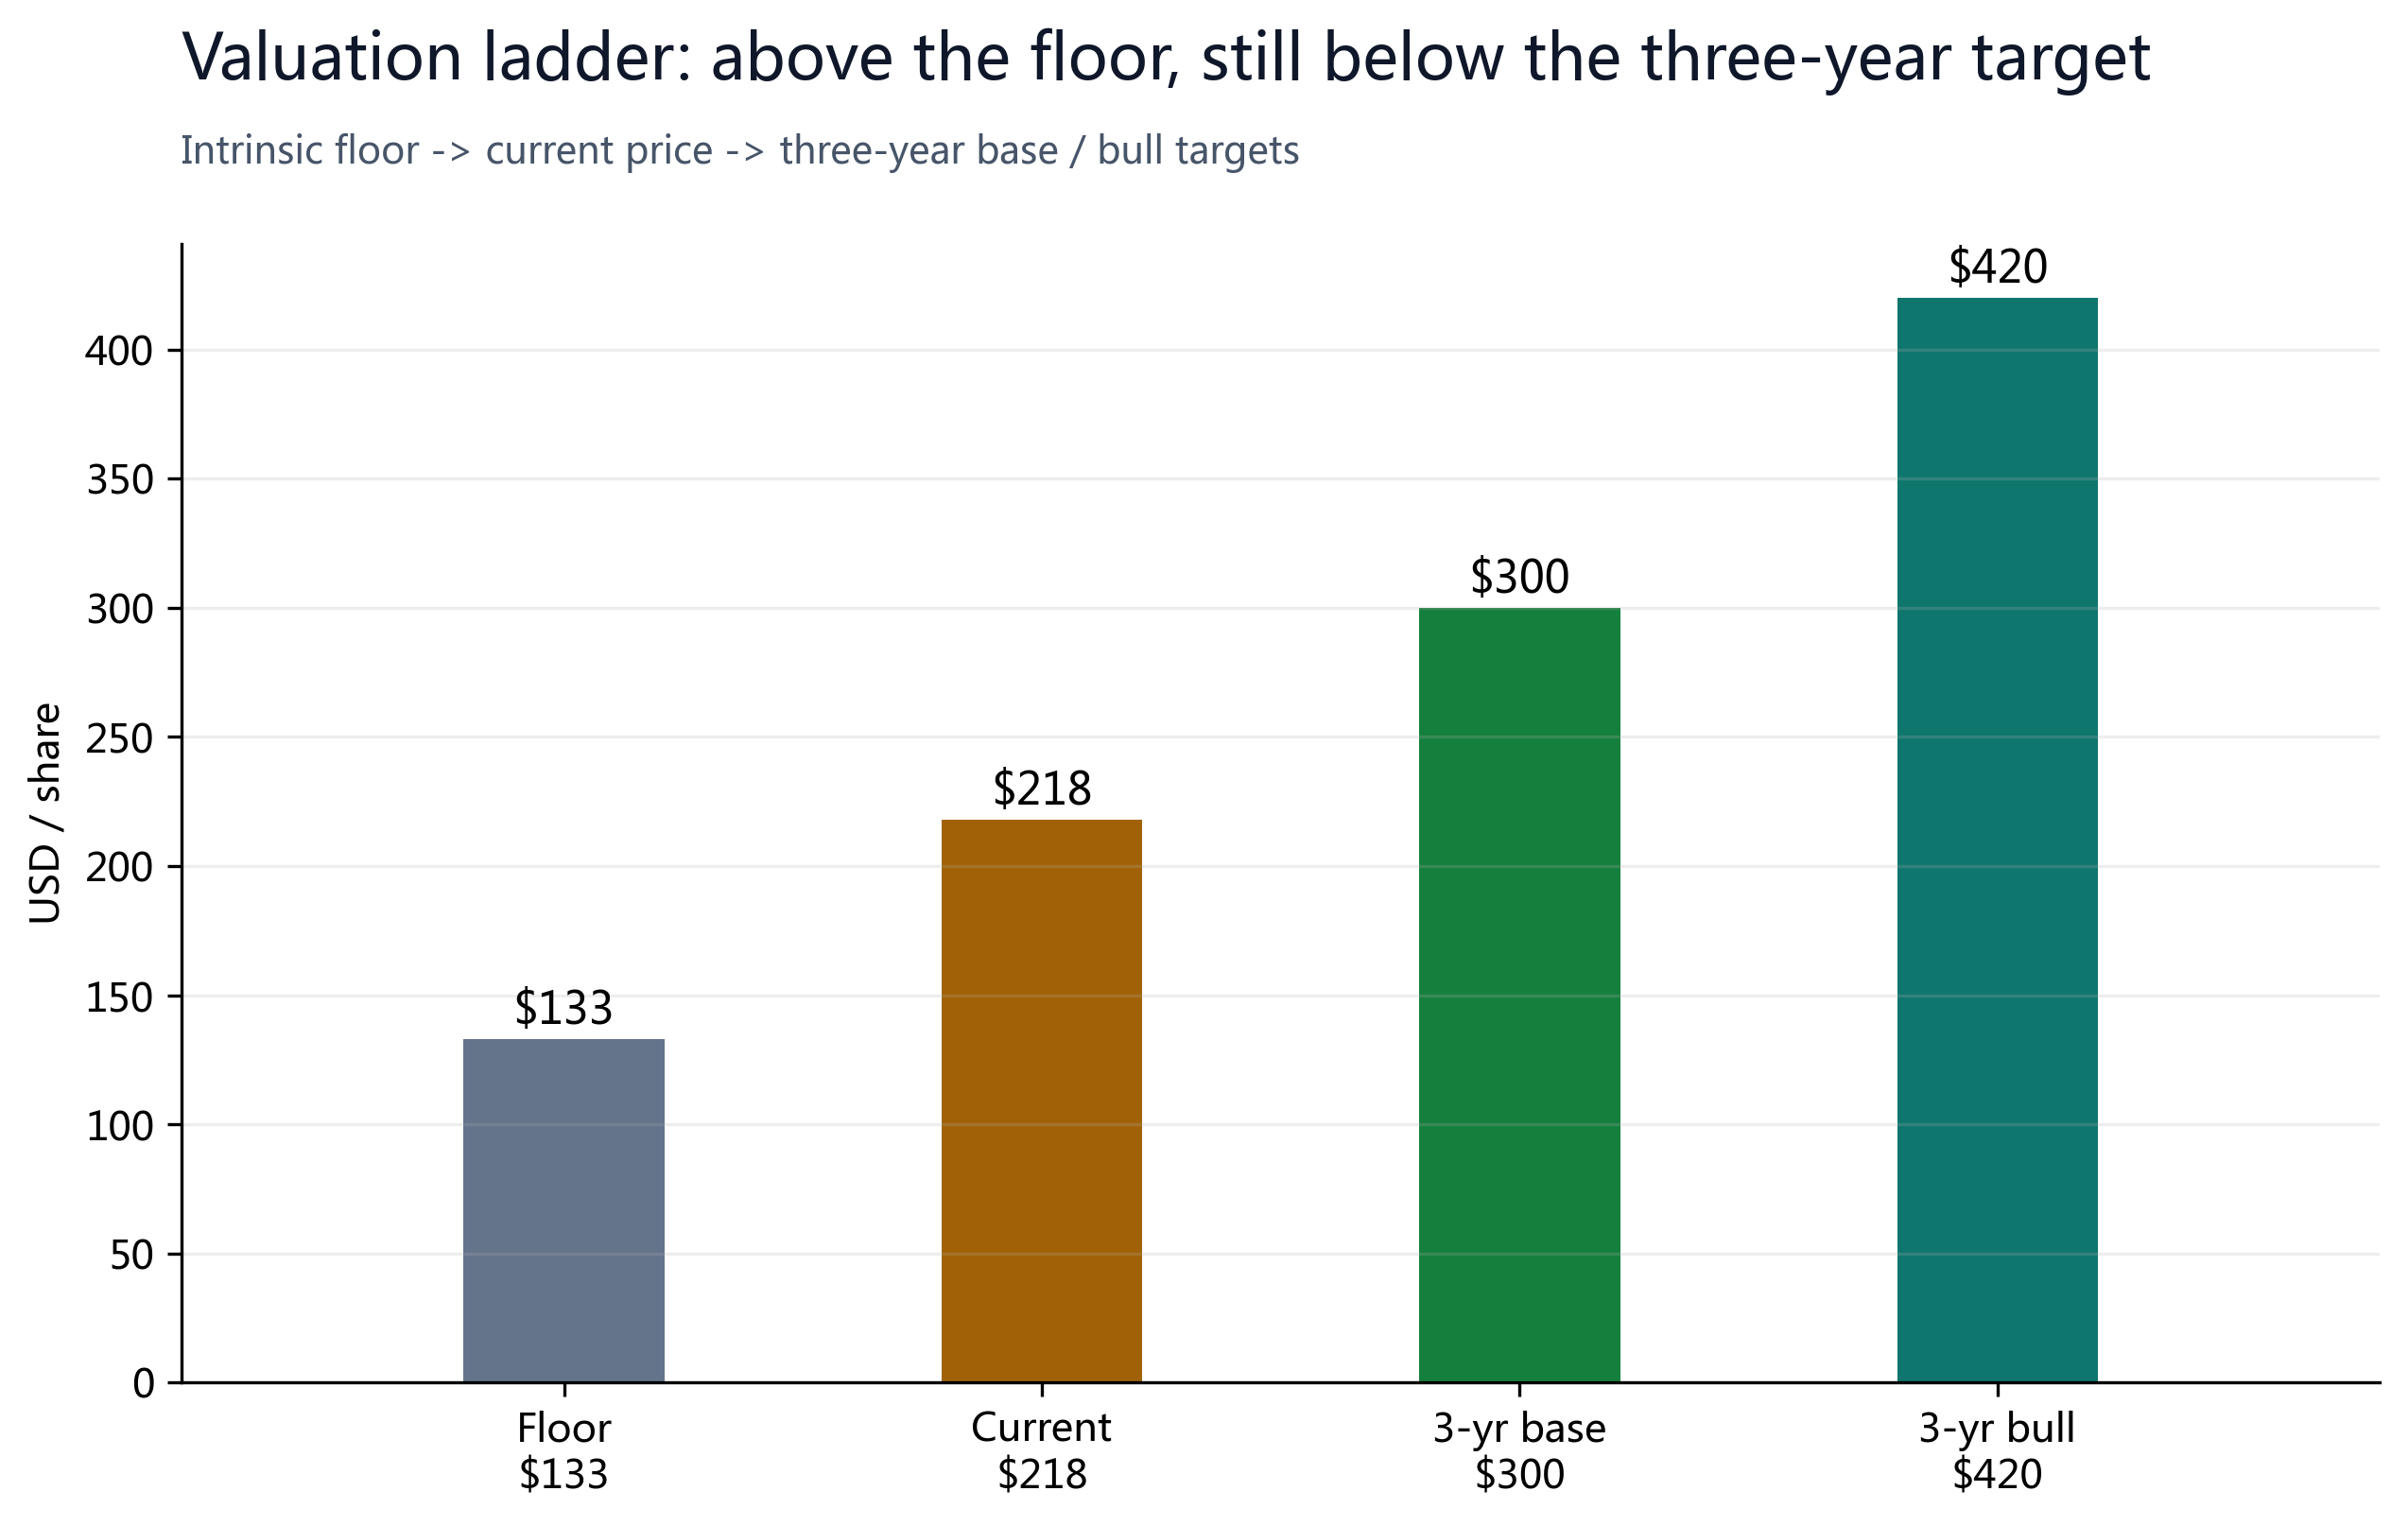
The right read places two lines side by side: (1) the intrinsic value of the businesses that monetize today (a conservative floor) is about $63–133/share; (2) crediting management's forward targets (growth rising further from 33%, gross margin 49%→70%, an addressable AI market of $3.8T near-term / $26.5T long-term), our three-year scenarios are about $300 (base) and $420+ (bull), depending on how far Starship and space compute deliver.
At about $218 the price is already above the floor yet still below our three-year base target of $300 — which is why we rate it Overweight and are long-term bullish.
For the bull case to play out, Starship must commercialize (guided for H2 2026) and orbital compute must actually work. If either fails, the valuation reverts toward the intrinsic value of the operating businesses.
§07Peer Comparison
SpaceX has no clean comparable — it is a roughly $2.86T space + satellite-connectivity + AI hybrid, whereas the 'peers' in the cohort are mostly small-cap, pure-play launch or satellite concept stocks.
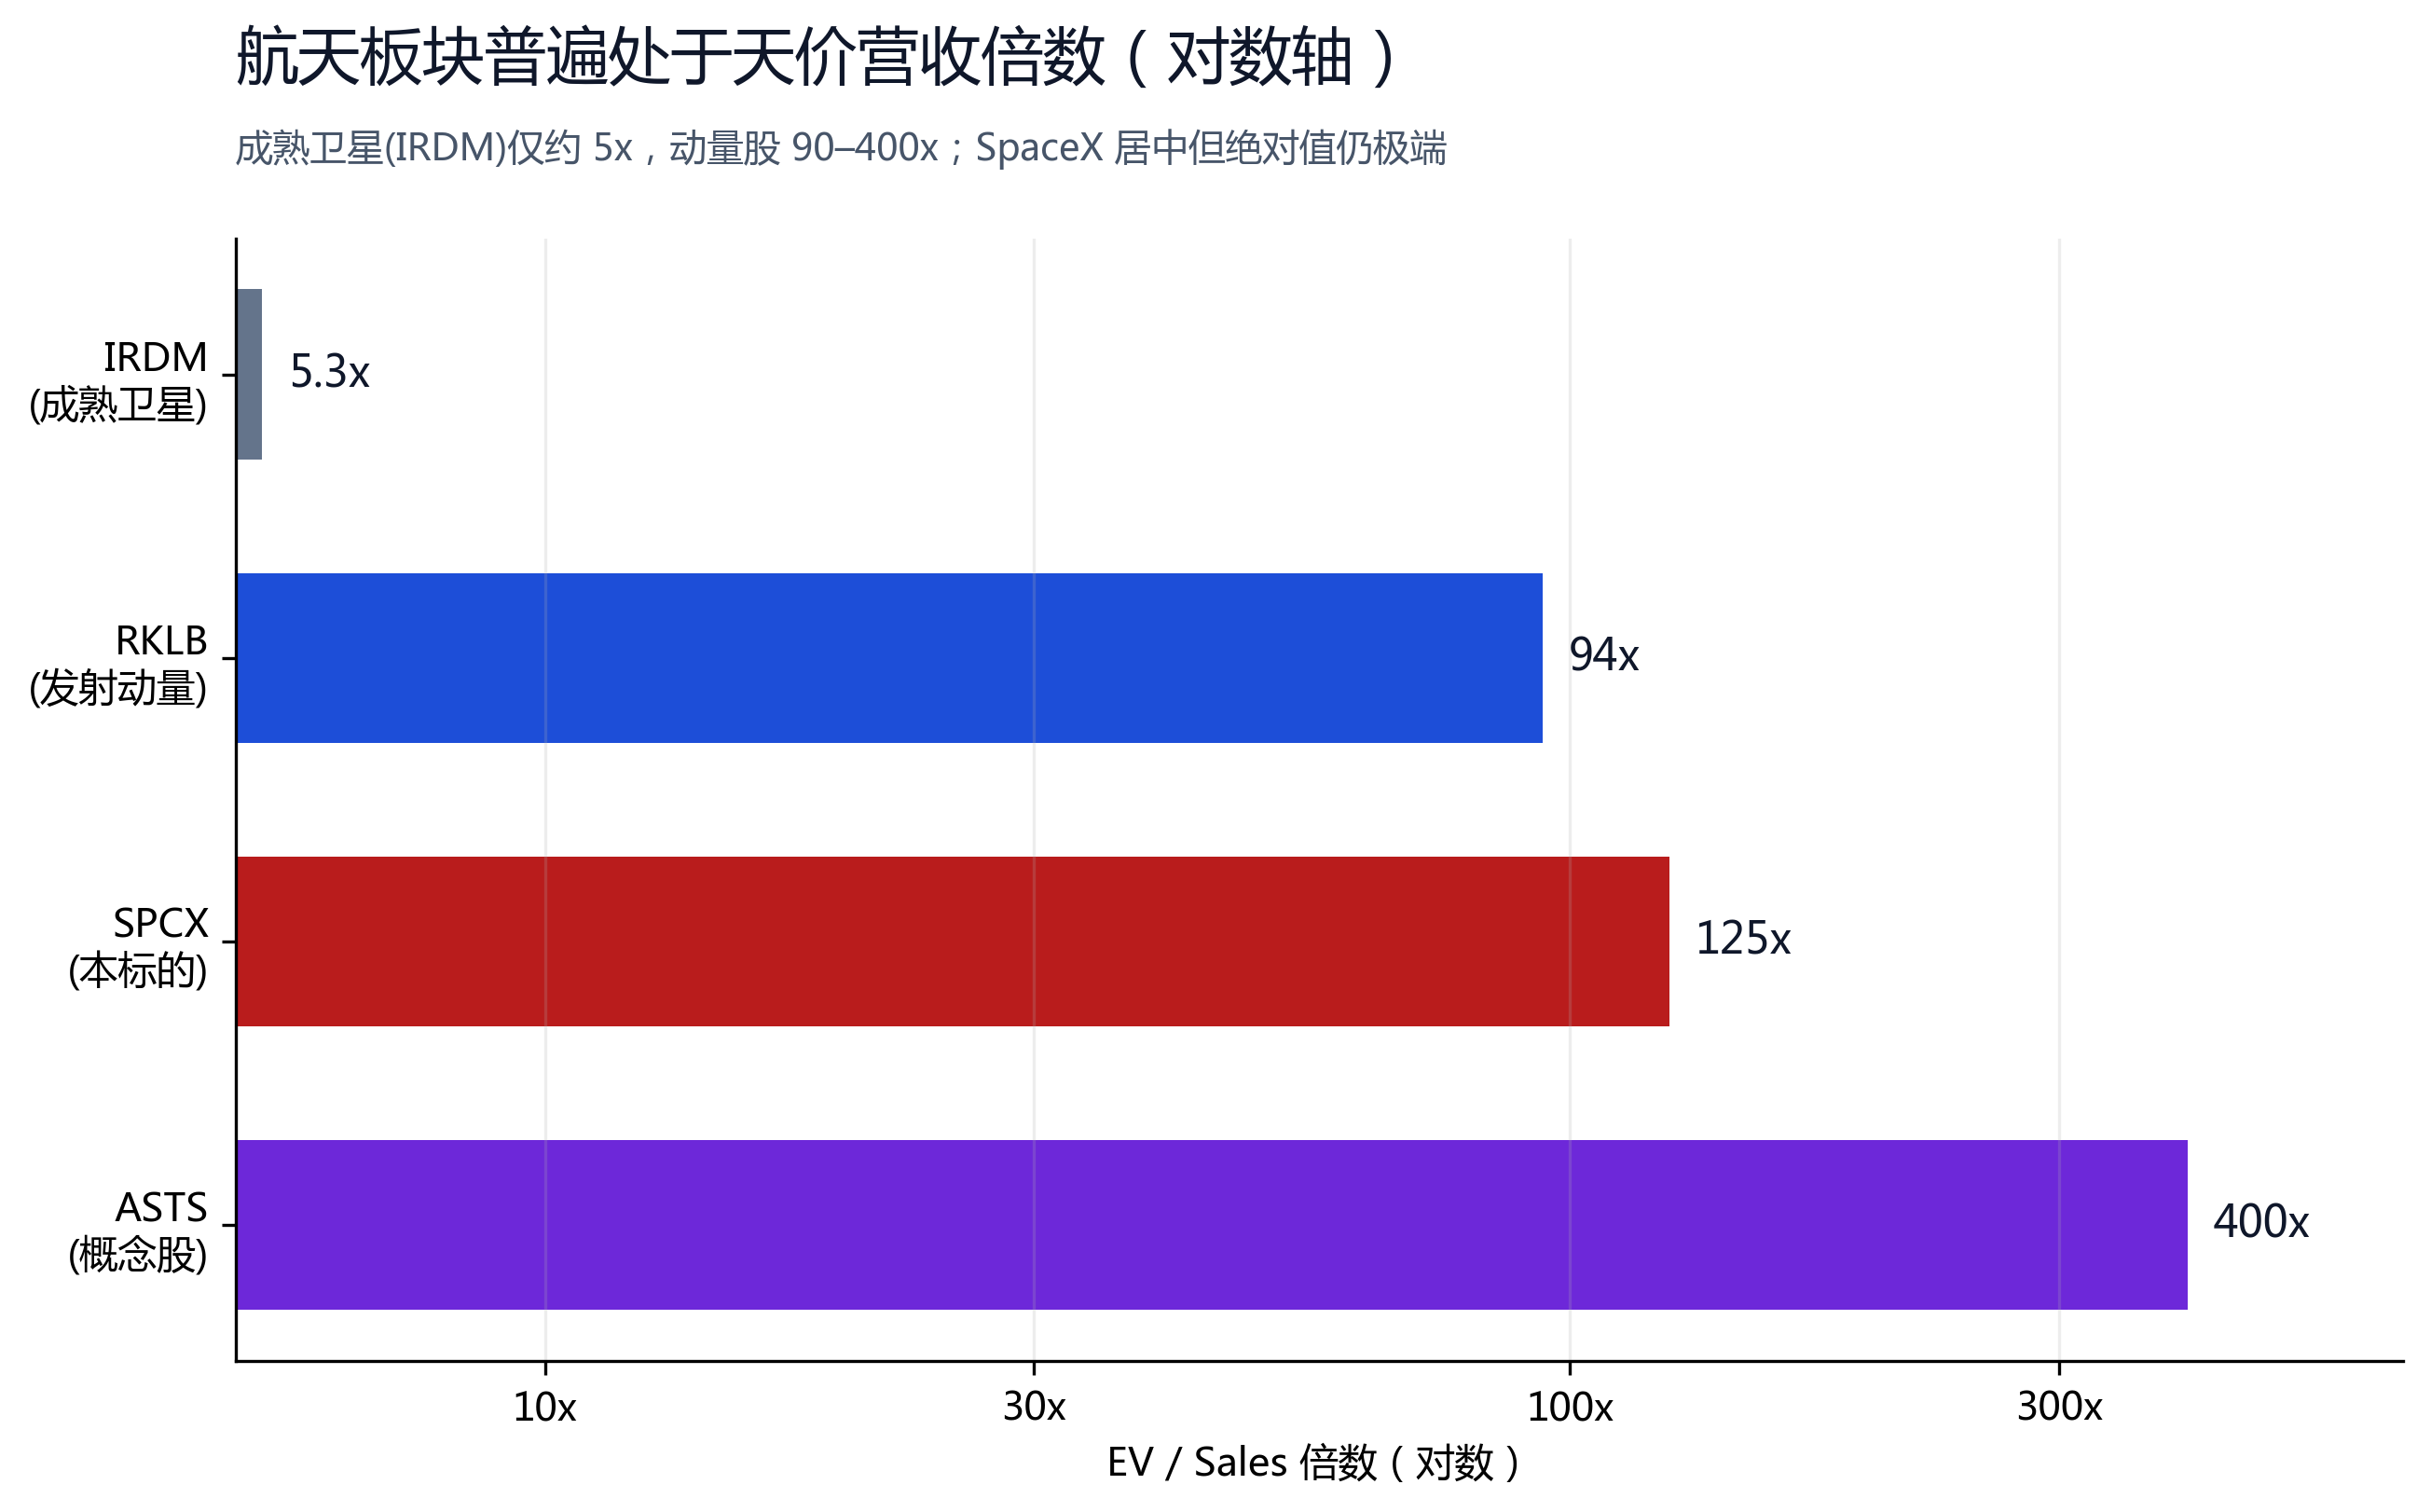
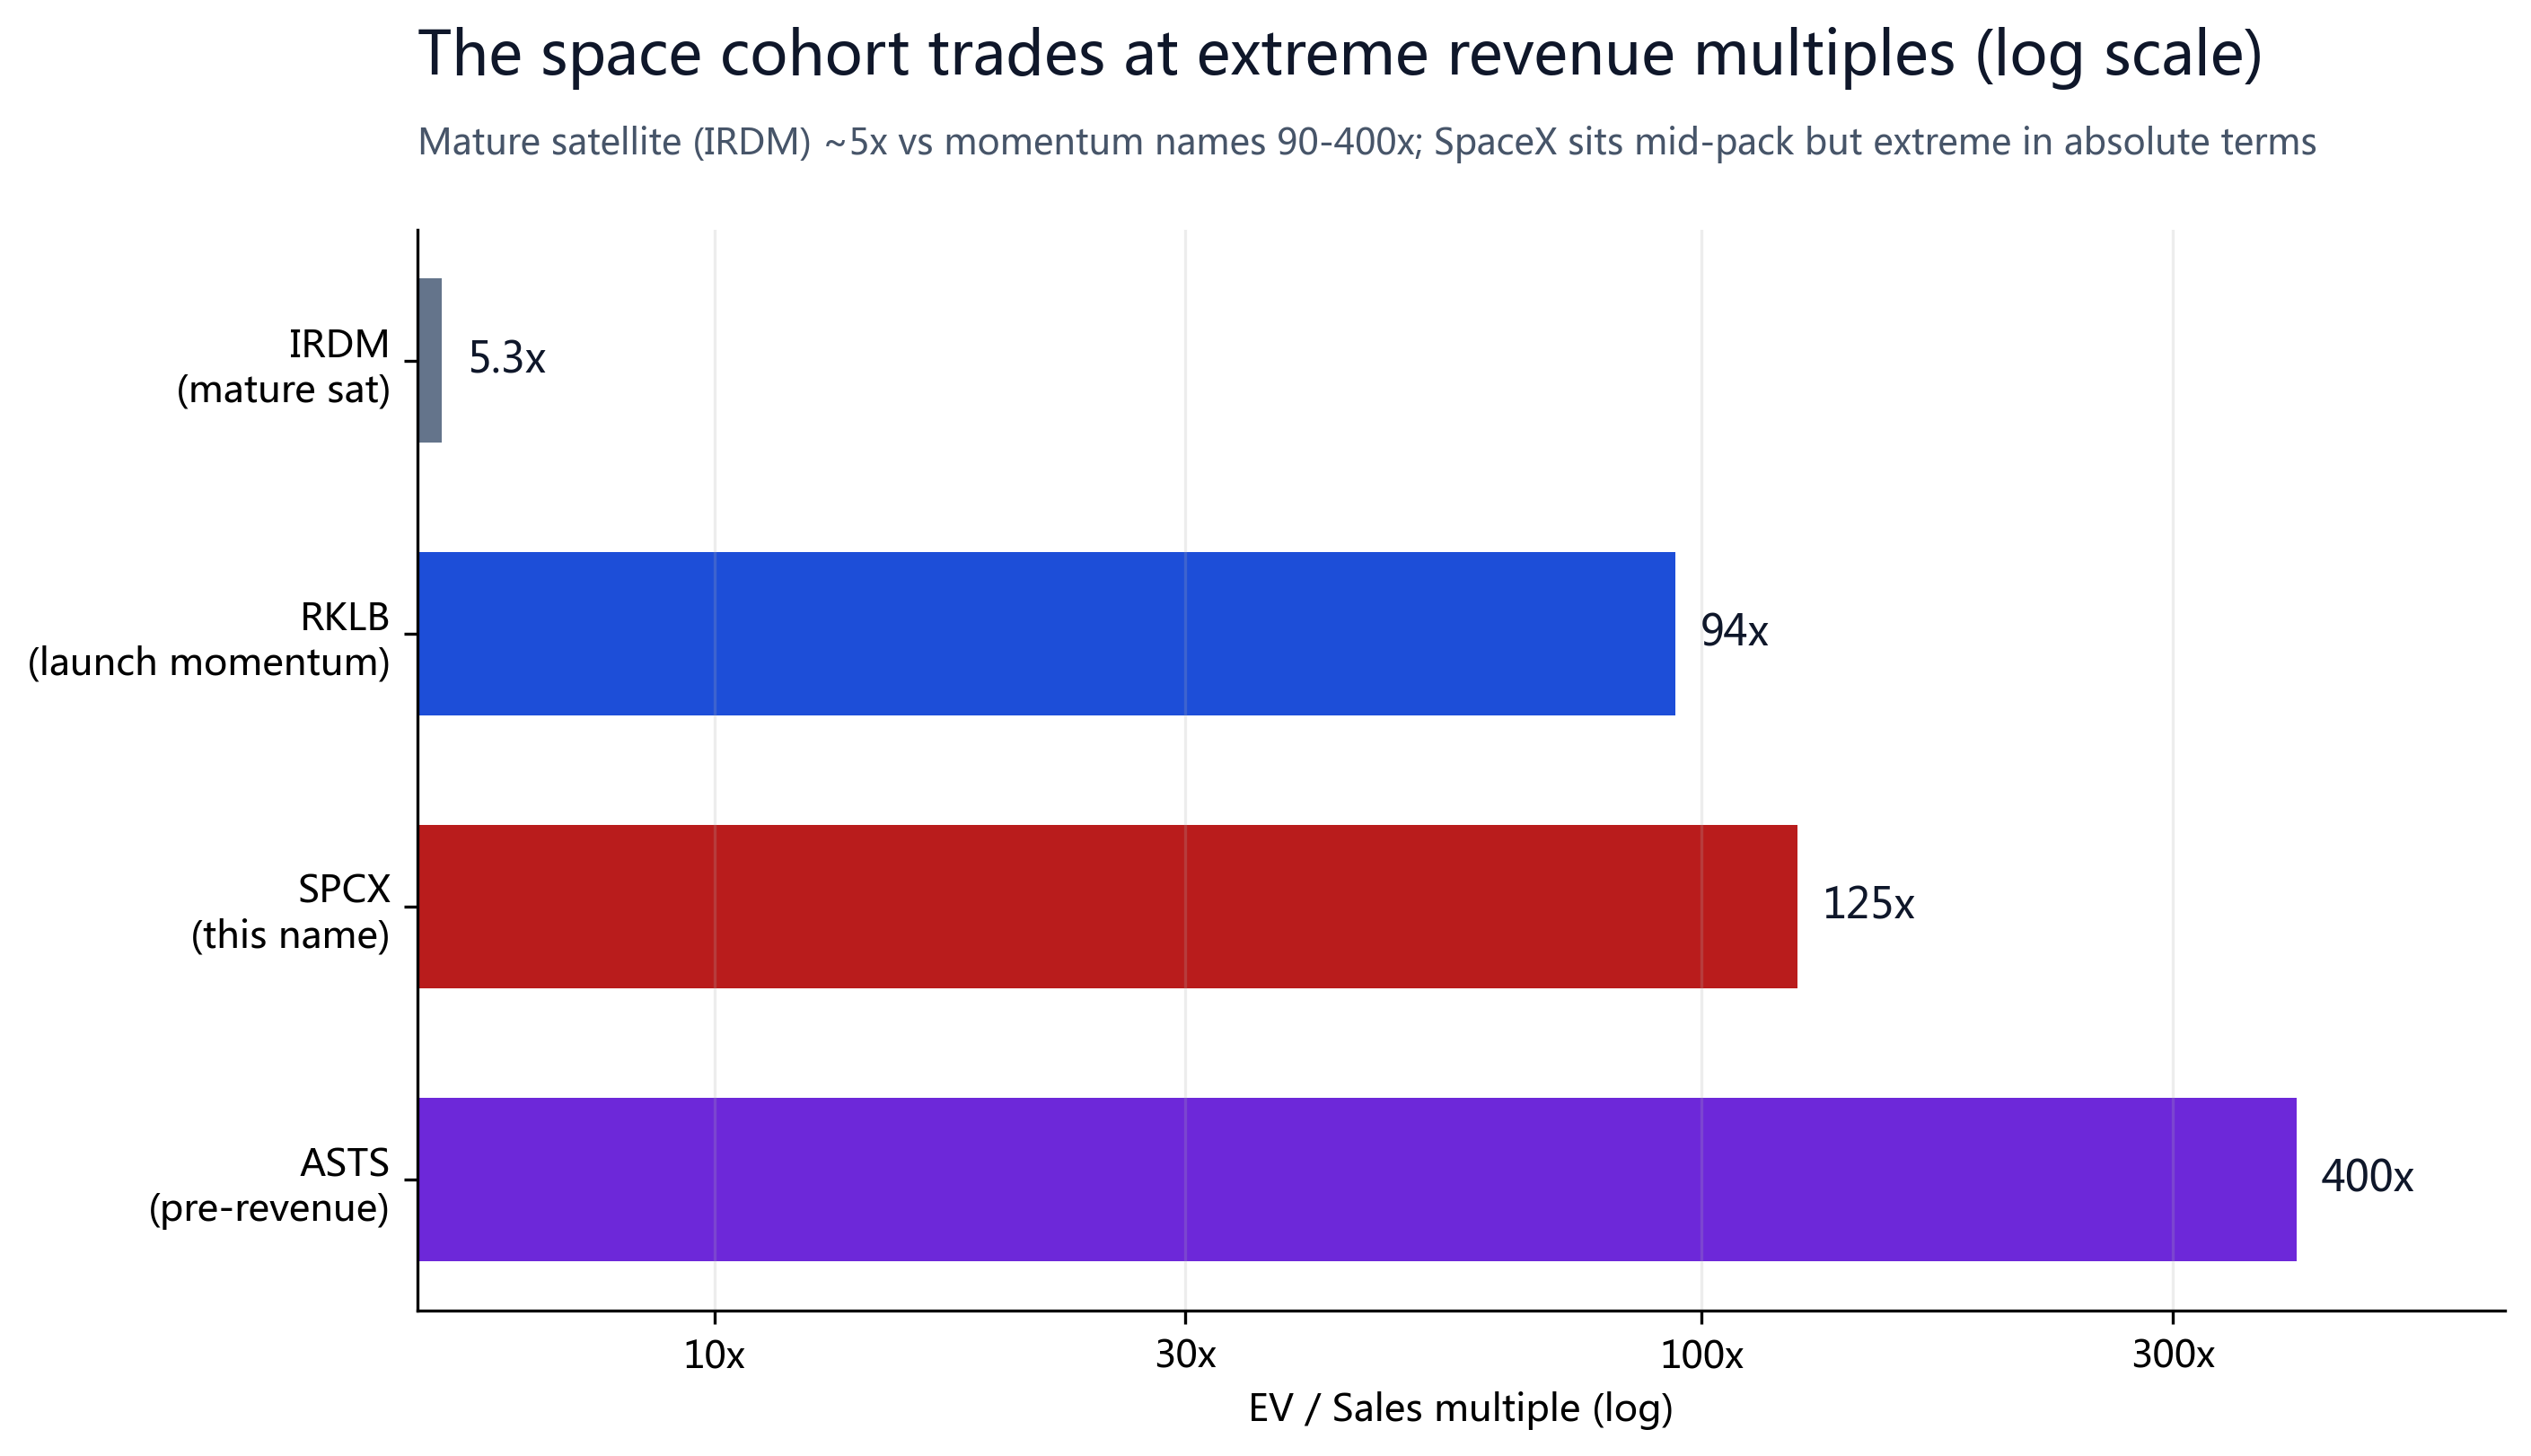
The real point is that the entire space-momentum cohort sits on extreme revenue multiples (a sector-wide speculation), not SpaceX alone: mature satellite leader Iridium (IRDM) trades at only about 5x EV/Sales, launch-momentum name Rocket Lab (RKLB) at about 94x P/S, and near-zero-revenue direct-to-cell concept AST SpaceMobile (ASTS) has been pushed to about 400x.
Within this group, SpaceX is the only one with about $18.7B of real revenue spanning three diversified businesses across connectivity, launch and AI; unlike pure-concept names such as ASTS with almost no revenue, its high multiple at least rests on real results, strong growth (+33%) and management margin targets (gross margin toward 70%), and stands on firmer ground. An absolute multiple of about 150x is high, but for an engine still growing 33%+ and holding the only on-ramp to space compute, we read it as paying for growth rather than a bubble — hence Overweight, add on pullbacks.
| Ticker | Market cap | TTM revenue | EV / Sales | Note |
|---|---|---|---|---|
| SPCX | $2.86T | $18.7B | ~150x (absolute, 2025) | Only one with scaled revenue + diversification |
| ASTS | $34.0B | $84.9M | ~400x | Direct-to-cell satellite, near-zero revenue |
| RKLB | — | — | ~94x (P/S) | Launch momentum name |
| IRDM | $5.5B | $875.8M | ~5.3x | Mature satellite comms (low-end anchor) |
Note: multiples are EV/Sales (SPCX includes about $14B net debt; IRDM is net-cash, so its EV/Sales is below market-cap/sales); RKLB is shown as P/S. All are live market figures, as of about June 2026.
§08Three Scenarios
| Scenario | Per share | Market cap | Trigger |
|---|---|---|---|
| Current (today) | ~$218 | ~$2.86T | 2026-06-16 intraday all-time high (+13% on the day) |
| Intrinsic floor (today) | $63–133 | $0.82–1.74T | SOTP of businesses that monetize today (see §05) |
| Bear (3-yr) | $150 | ~$2.0T | Lock-up supply + slow AI monetization + Starship slips; near 52-wk-low support, accumulation zone |
| Base (3-yr · target) | $300 | ~$3.9T | Official growth/margin targets deliver; AI ramps toward the near-term $3.8T TAM |
| Bull (3-yr) | $420+ | ~$5.5T | $26.5T AI TAM unlocks + Starship + orbital compute at scale |
How to read it: at $218 the price is already above the intrinsic floor ($63–133) yet still below our three-year base target of $300 (about +38% upside), with a bull case above $420. Upside comes from delivery of the official growth/margin targets and AI/space-compute; the downside cushion sits near $150 (a lock-up pullback, around the 52-week low). Hence Overweight and long-term bullish, with a lock-up dip as a window to add.
Differing views on Wall Street
Placing the public sell-side views side by side: 12-month targets run from $22 (Strong Sell) to $186 (Strong Buy). Our “Overweight · $400+ over three years” sits on the bull end, on the basis of management's growth/margin targets and SpaceX's exclusive position in space compute. Note: at $218 the price is already above most 12-month sell-side targets — our bullishness is a three-year view, and near-term volatility and a lock-up pullback are to be expected.
| Source | Rating | Target | Hinges on |
|---|---|---|---|
| Bears of Wall Street | Strong Sell | $22 | DCF: profit only by 2028, $40B/yr CapEx, bridge loan eats proceeds |
| Bashar Issa | Hold | ~fair (no target) | Launch market only $10.4B, lags in AI, no downside catalyst |
| VM Genius (this report) | Overweight · long-term bullish | Base $300 / 3-yr $420+ | Delivery of growth+margin targets; exclusive space-compute gateway |
| The Curious Analyst | Strong Buy | $186 | 2030 revenue $180B, $76.7B EBITDA, 55x |
§09Catalysts and Risks
| Window | Event | Direction |
|---|---|---|
| Triggered (price > $175.50) | Lock-up: +10% restricted stock eligible (IPO+30% crossed) | Supply overhang |
| After Q2 report | Another 20% unlocks + first public quarter | Sharp-pullback risk: soft Q2 into >100x sales |
| 2026 H2 | Starship V3 reliability (booster failed to land, FAA probe) | Drives direct-to-cell / orbital compute |
| Ongoing | Heavy AI cash consumption ($6.36B loss, 76% of capex) plus price competition from India's LVM3 | FCF negative for years + launch share erosion |
| About 6-15 months post-IPO | $20B AI bridge may consume 1/4 of proceeds | Refinancing / liquidity risk |
(1) in the near term, lock-up supply plus a soft Q2 in a >100x-sales, retail-driven new issue can easily trigger a sharp pullback;
(2) yet it should not be shorted naked — too-big-to-fail status, a government order backstop, and potential MSCI inclusion can all bring passive buying and let the narrative run higher and longer. This is a valuation judgment, not a timing call.
We adopt this as the directional thesis (Overweight, long-term bullish); candidly, it leans heavily on the most cash-intensive AI business delivering, so sizing with room to spare and adding into lock-up pullbacks is the more prudent way to execute.
§10Ownership and Lock-up
SpaceX only listed on June 12, 2026 and, as of this report, has been public for just a few days, so 13F institutional-ownership data does not yet exist — under the rules, 13Fs must be filed within about 45 days after each quarter-end, meaning the first institutional-ownership disclosures will appear no earlier than August 2026. There is therefore no institutional or insider ownership structure to disclose in this section yet.
What is currently known is only that the IPO reserved up to about 30% of the offering for retail investors and was roughly 4x oversubscribed; on lock-up terms, the company will release about 20% of restricted shares after the Q2 report, with a further roughly 10% releasing once the price trades 30% above the offering price (i.e. $175.50) — a threshold that has now been triggered, creating near-term potential supply pressure.
We will complete the ownership structure of this section once the first 13F and the first public quarterly report are filed.
§11Sources, Limits and Disclosure
- SpaceX S-1 (SEC, 2026-05-20): https://www.sec.gov/Archives/edgar/data/1181412/000162828026036936/spaceexplorationtechnologi.htm
- S-1 financials/segments: Via Satellite, Morningstar, Hargreaves Lansdown (2026-05)
- IPO pricing and debut: CNBC, Yahoo Finance, TechCrunch (2026-06-12)
- Price/market cap: Google Finance, TradingView SPCX (2026-06-16, intraday all-time high about $218)
- xAI valuation/Grok: Sacra, Business of Apps (2026)
Key limitations of this report:
(1) SPCX has only a few trading days of history, no long-term price record, and a current price that both conflicts across data sources and remains highly volatile;
(2) the 13.1B share count is derived from the IPO valuation and offering price, with the exact figure pending the formal prospectus (S-1);
(3) the valuation multiples for each SOTP segment, and the Starship option value, are the author's estimates, with ranges shown explicitly;
(4) the split of the IPO raise between newly issued shares and secondary sales is still to be confirmed, and affects the post-IPO improvement in net debt;
(5) our Overweight rating and three-year targets (base $300 / bull $420+) lean heavily on management's forward targets (goals, not formal guidance) and on AI monetization delivering — the AI segment posted a $6.36B operating loss in 2025 and consumed 76% of capex, and if it disappoints the valuation reverts toward the floor of the existing businesses (about $63–133/share).
This report is not investment advice.