Rocket Lab CorporationNASDAQ:RKLB
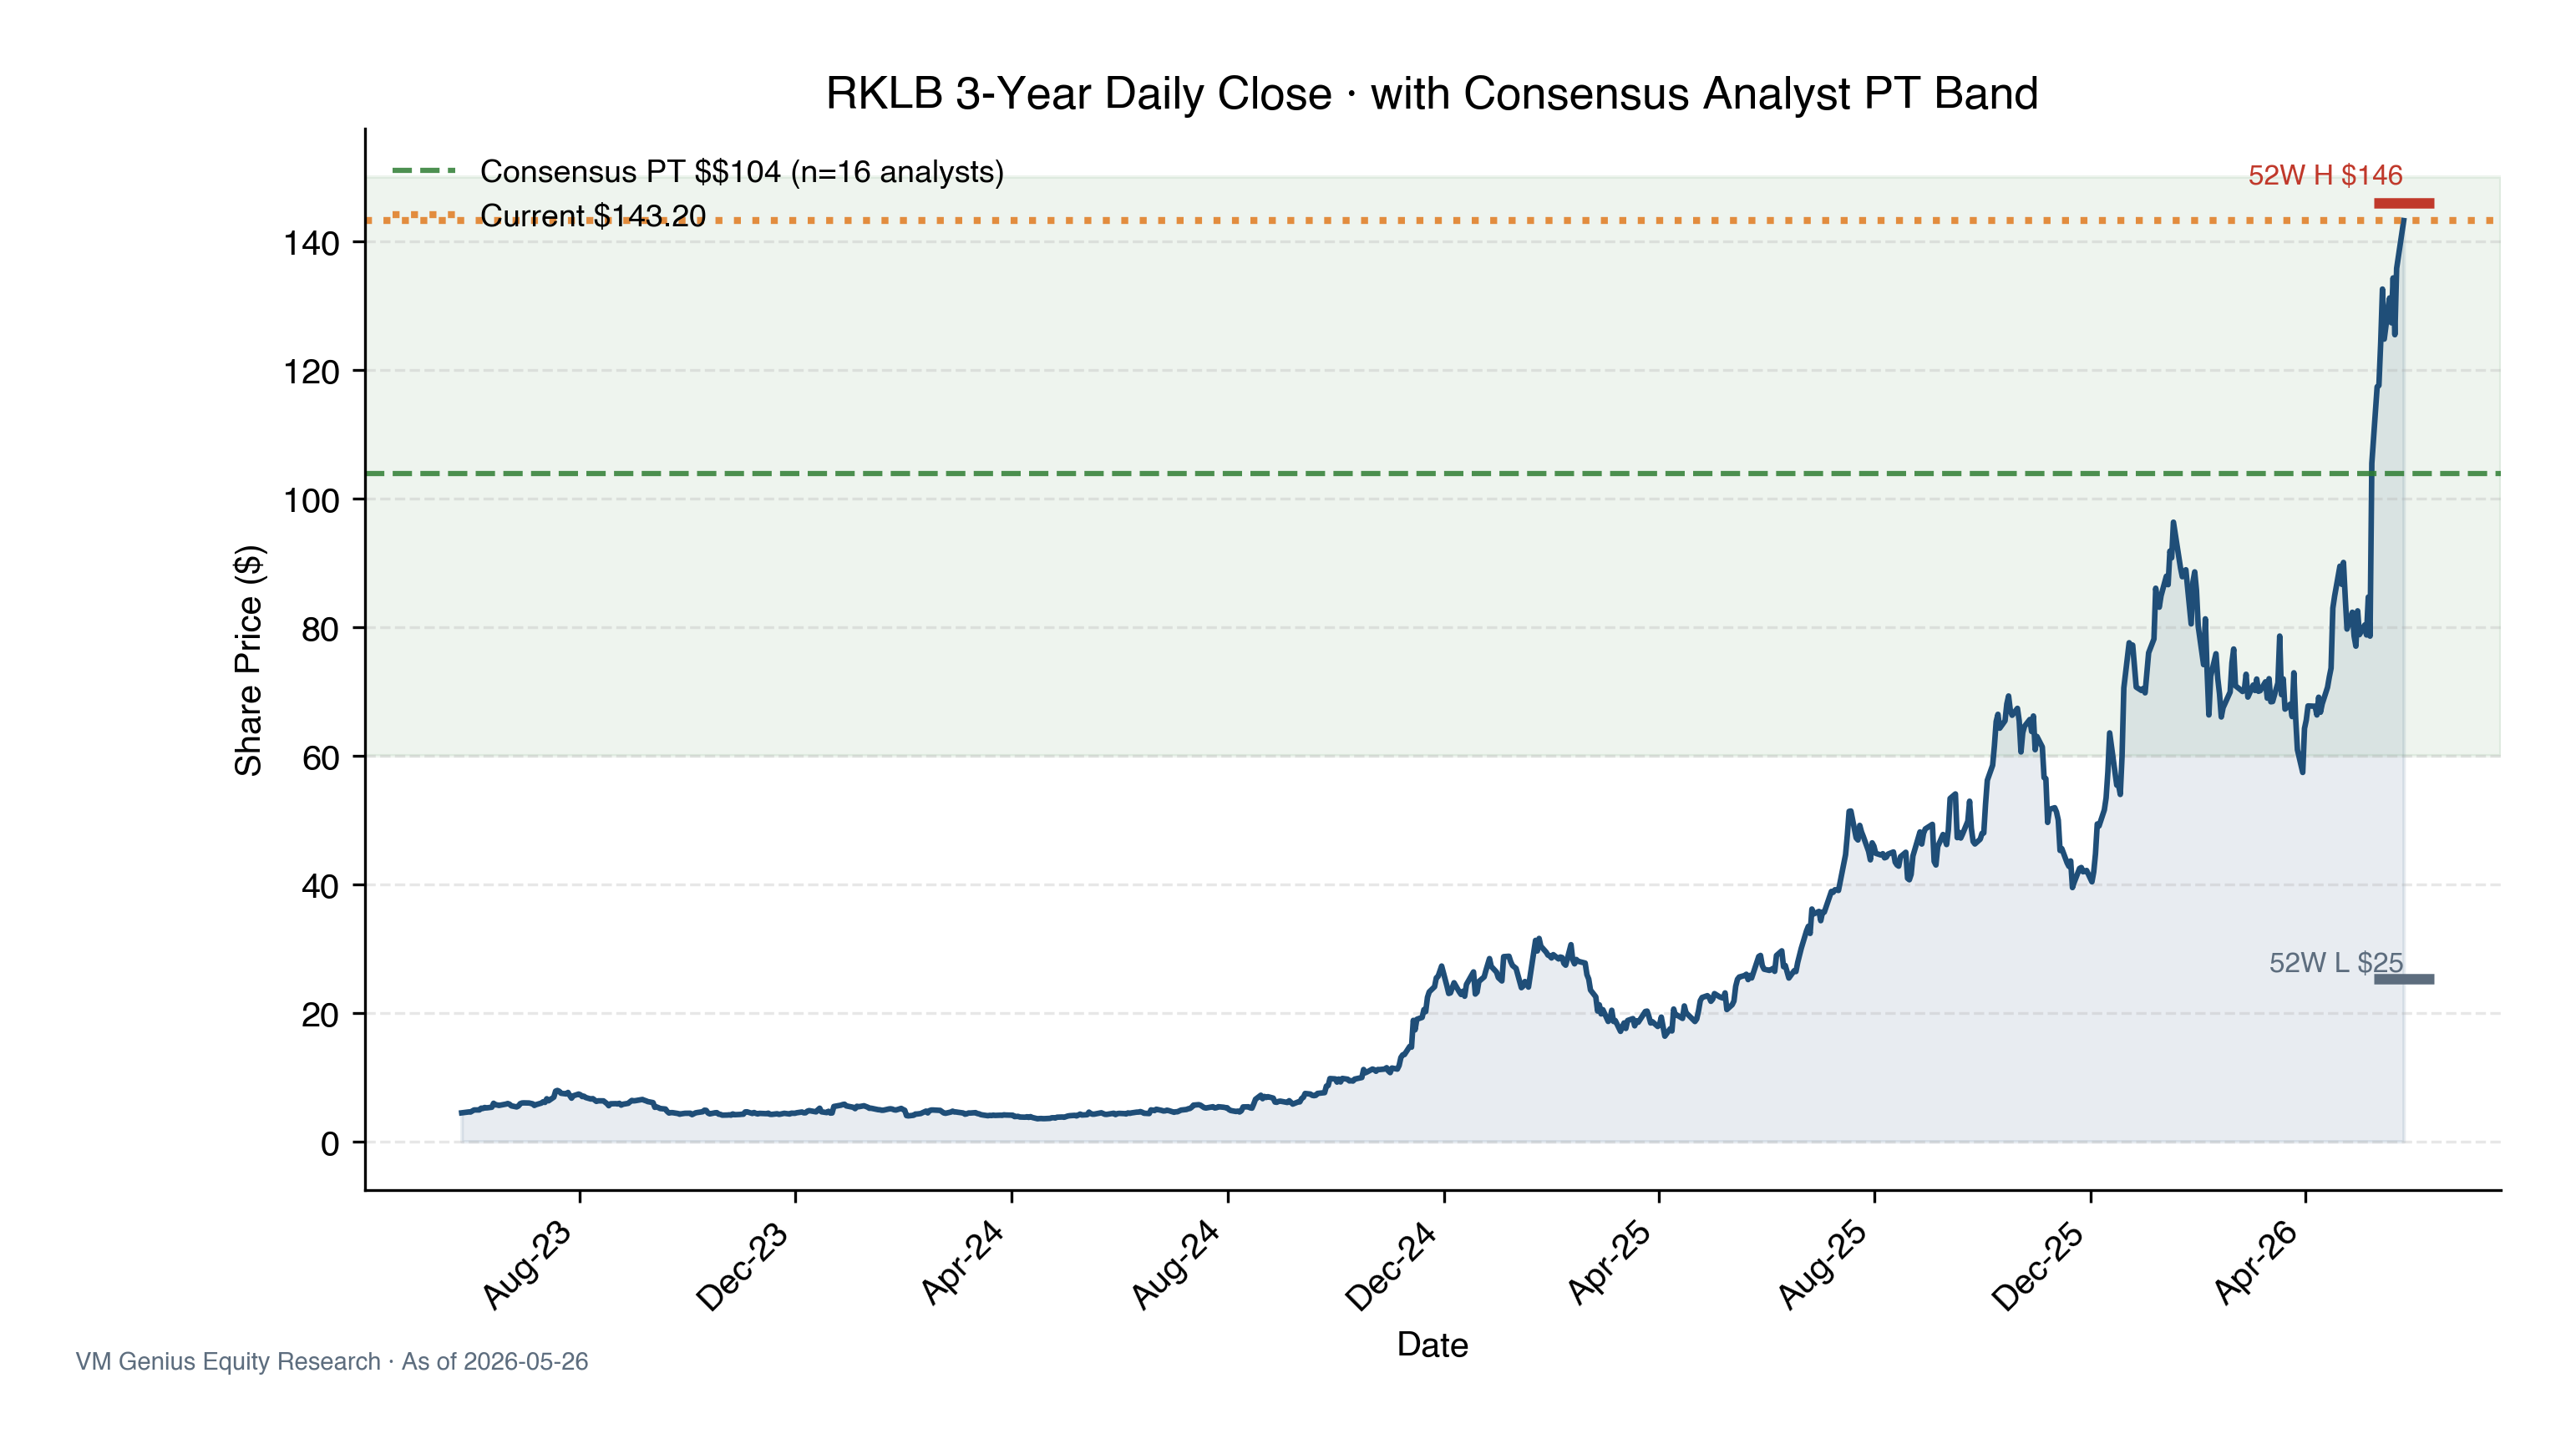
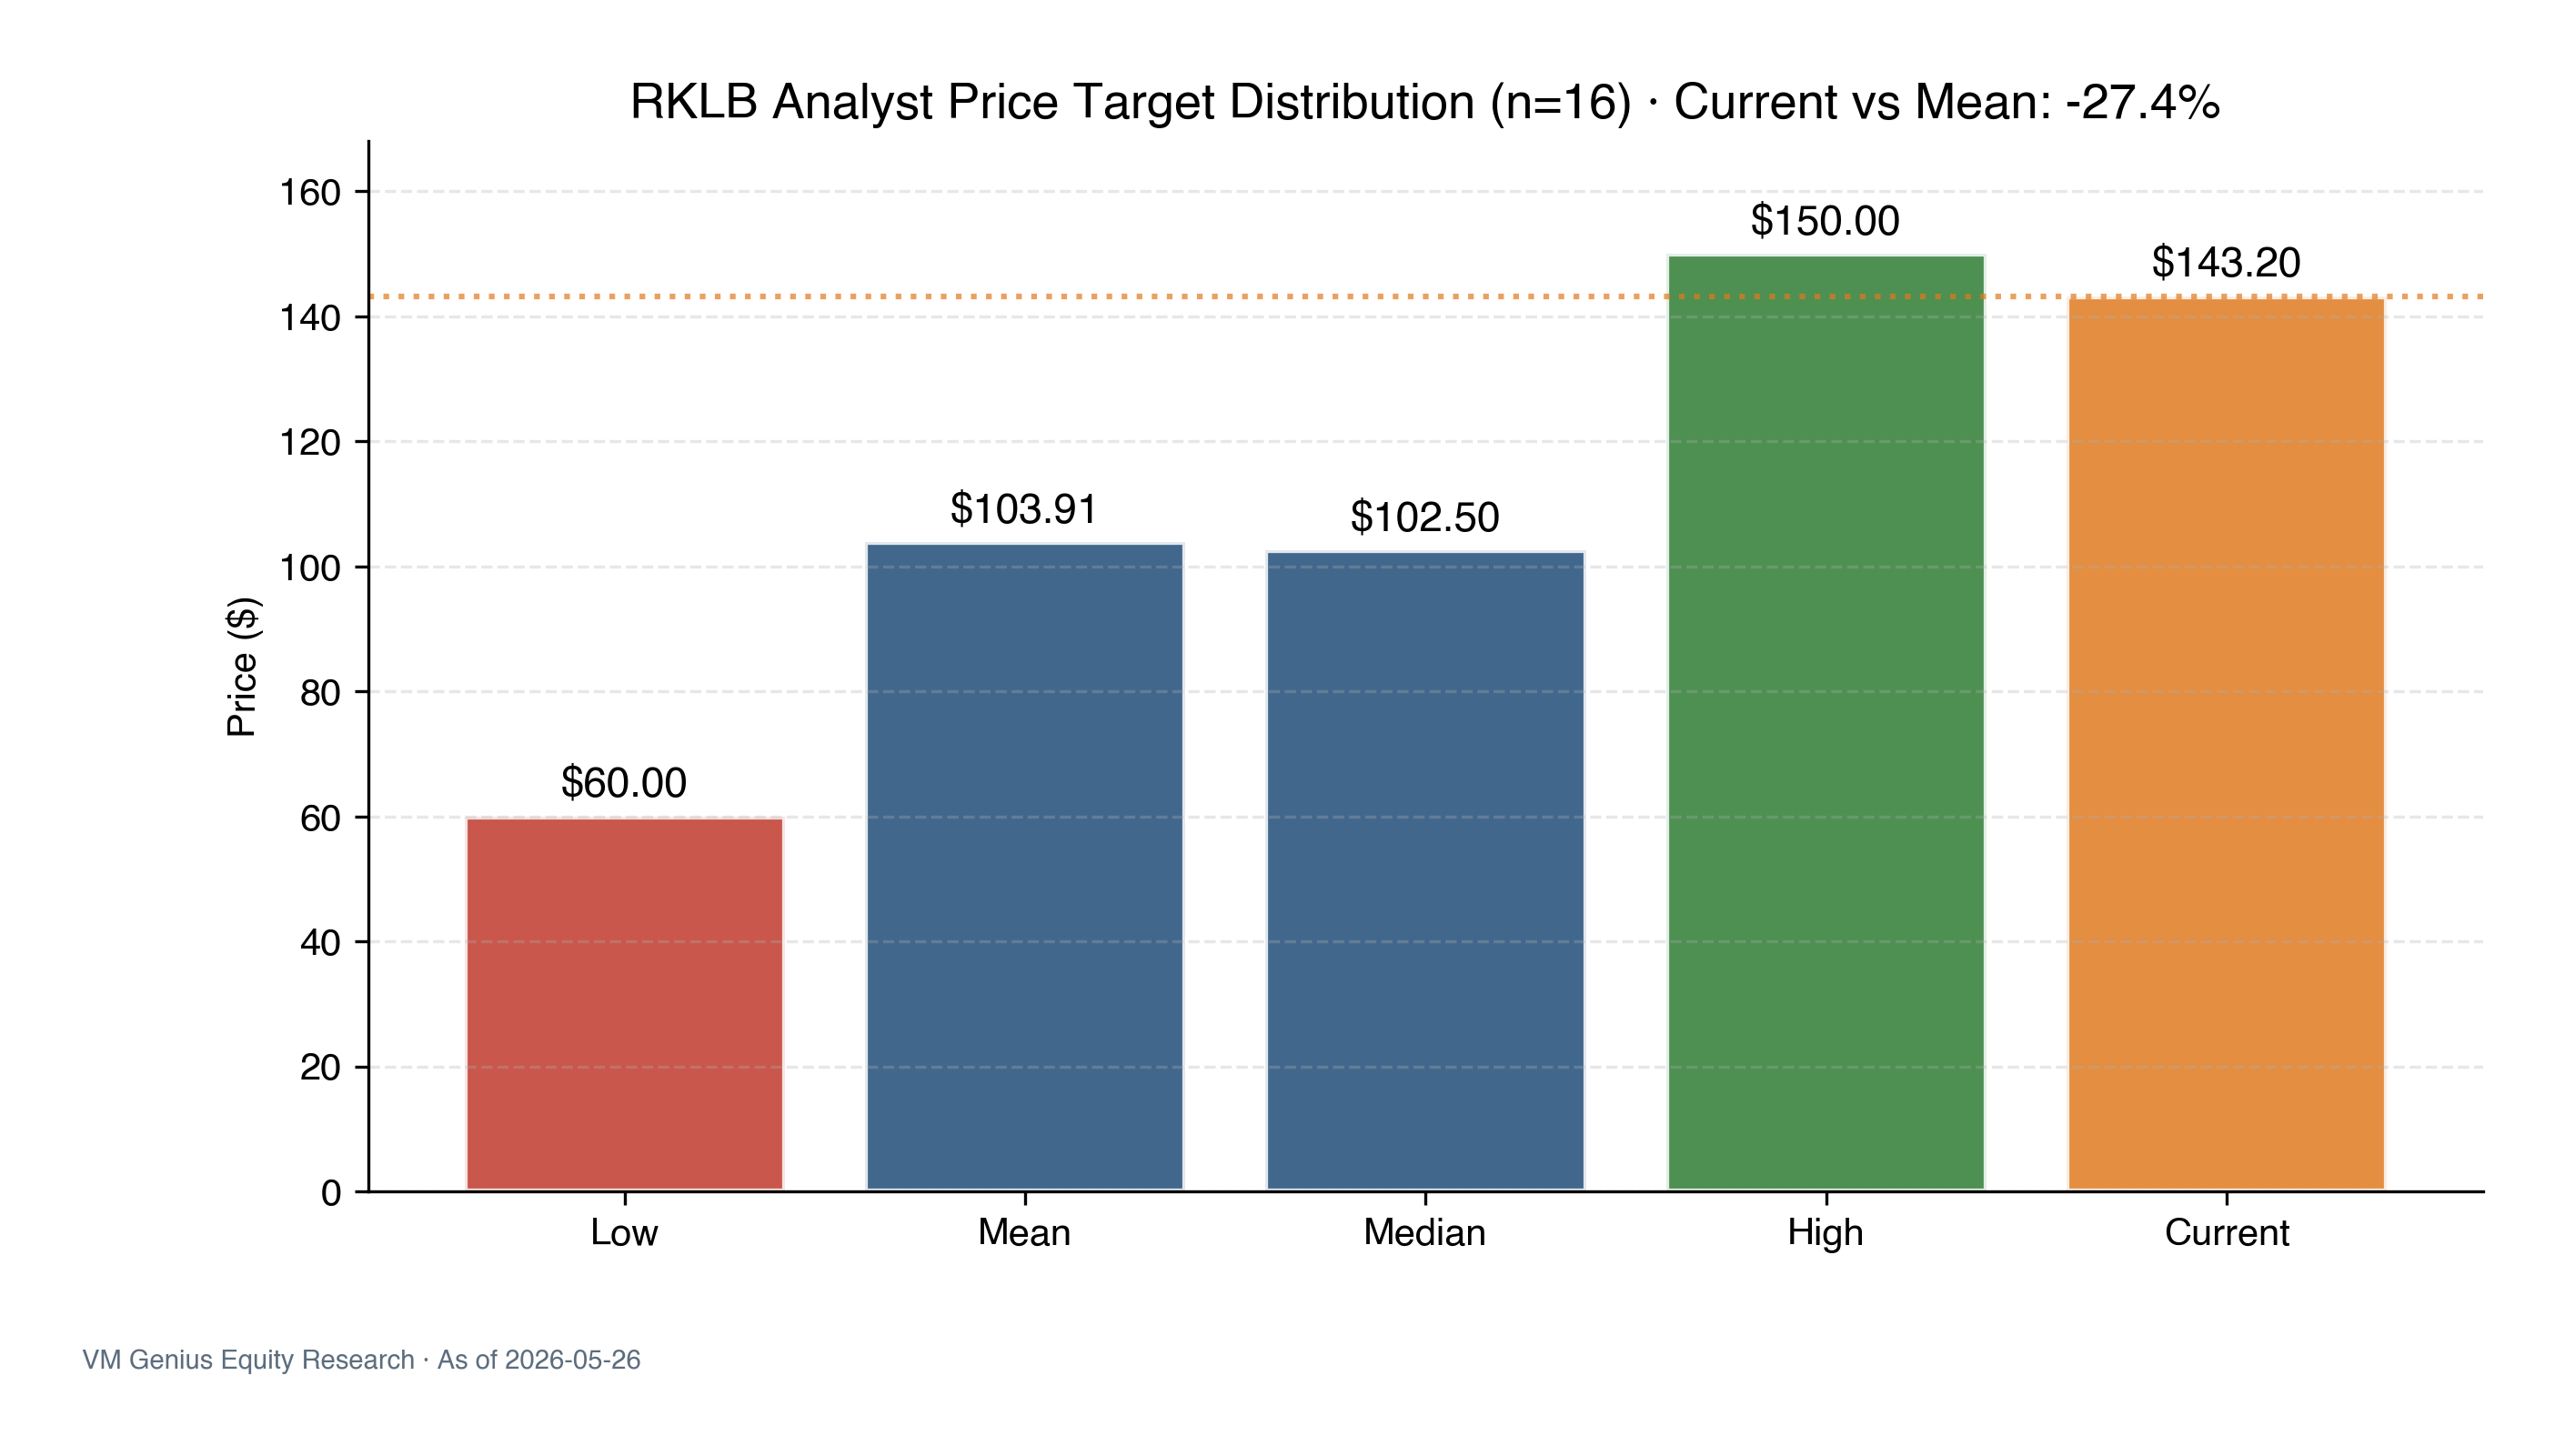
Strong fundamentals + dangerous valuation. Revenue TTM growth +63.5%, gross margin 36.6%, but the stock has rallied 5.7x in 12 months to $143.20, exceeding the 16-analyst consensus PT mean of $103.91 by +37.8%. We initiate HOLD with 12-month PT $115 (-19.7% implied), waiting for a pullback before upgrading.
§ 01Investment Summary
Rocket Lab Corporation has been through a remarkable re-rating over the past 12 months — from ~$25 in May 2025 to $143.20 in May 2026, a +472% move. The rally is grounded in real fundamental delivery (revenue growth +63.5% TTM, gross margin expansion to 36.6%, Neutron medium-lift program advancing) alongside catalysts like the Mynaric acquisition and SDA Space Force contract ramp.
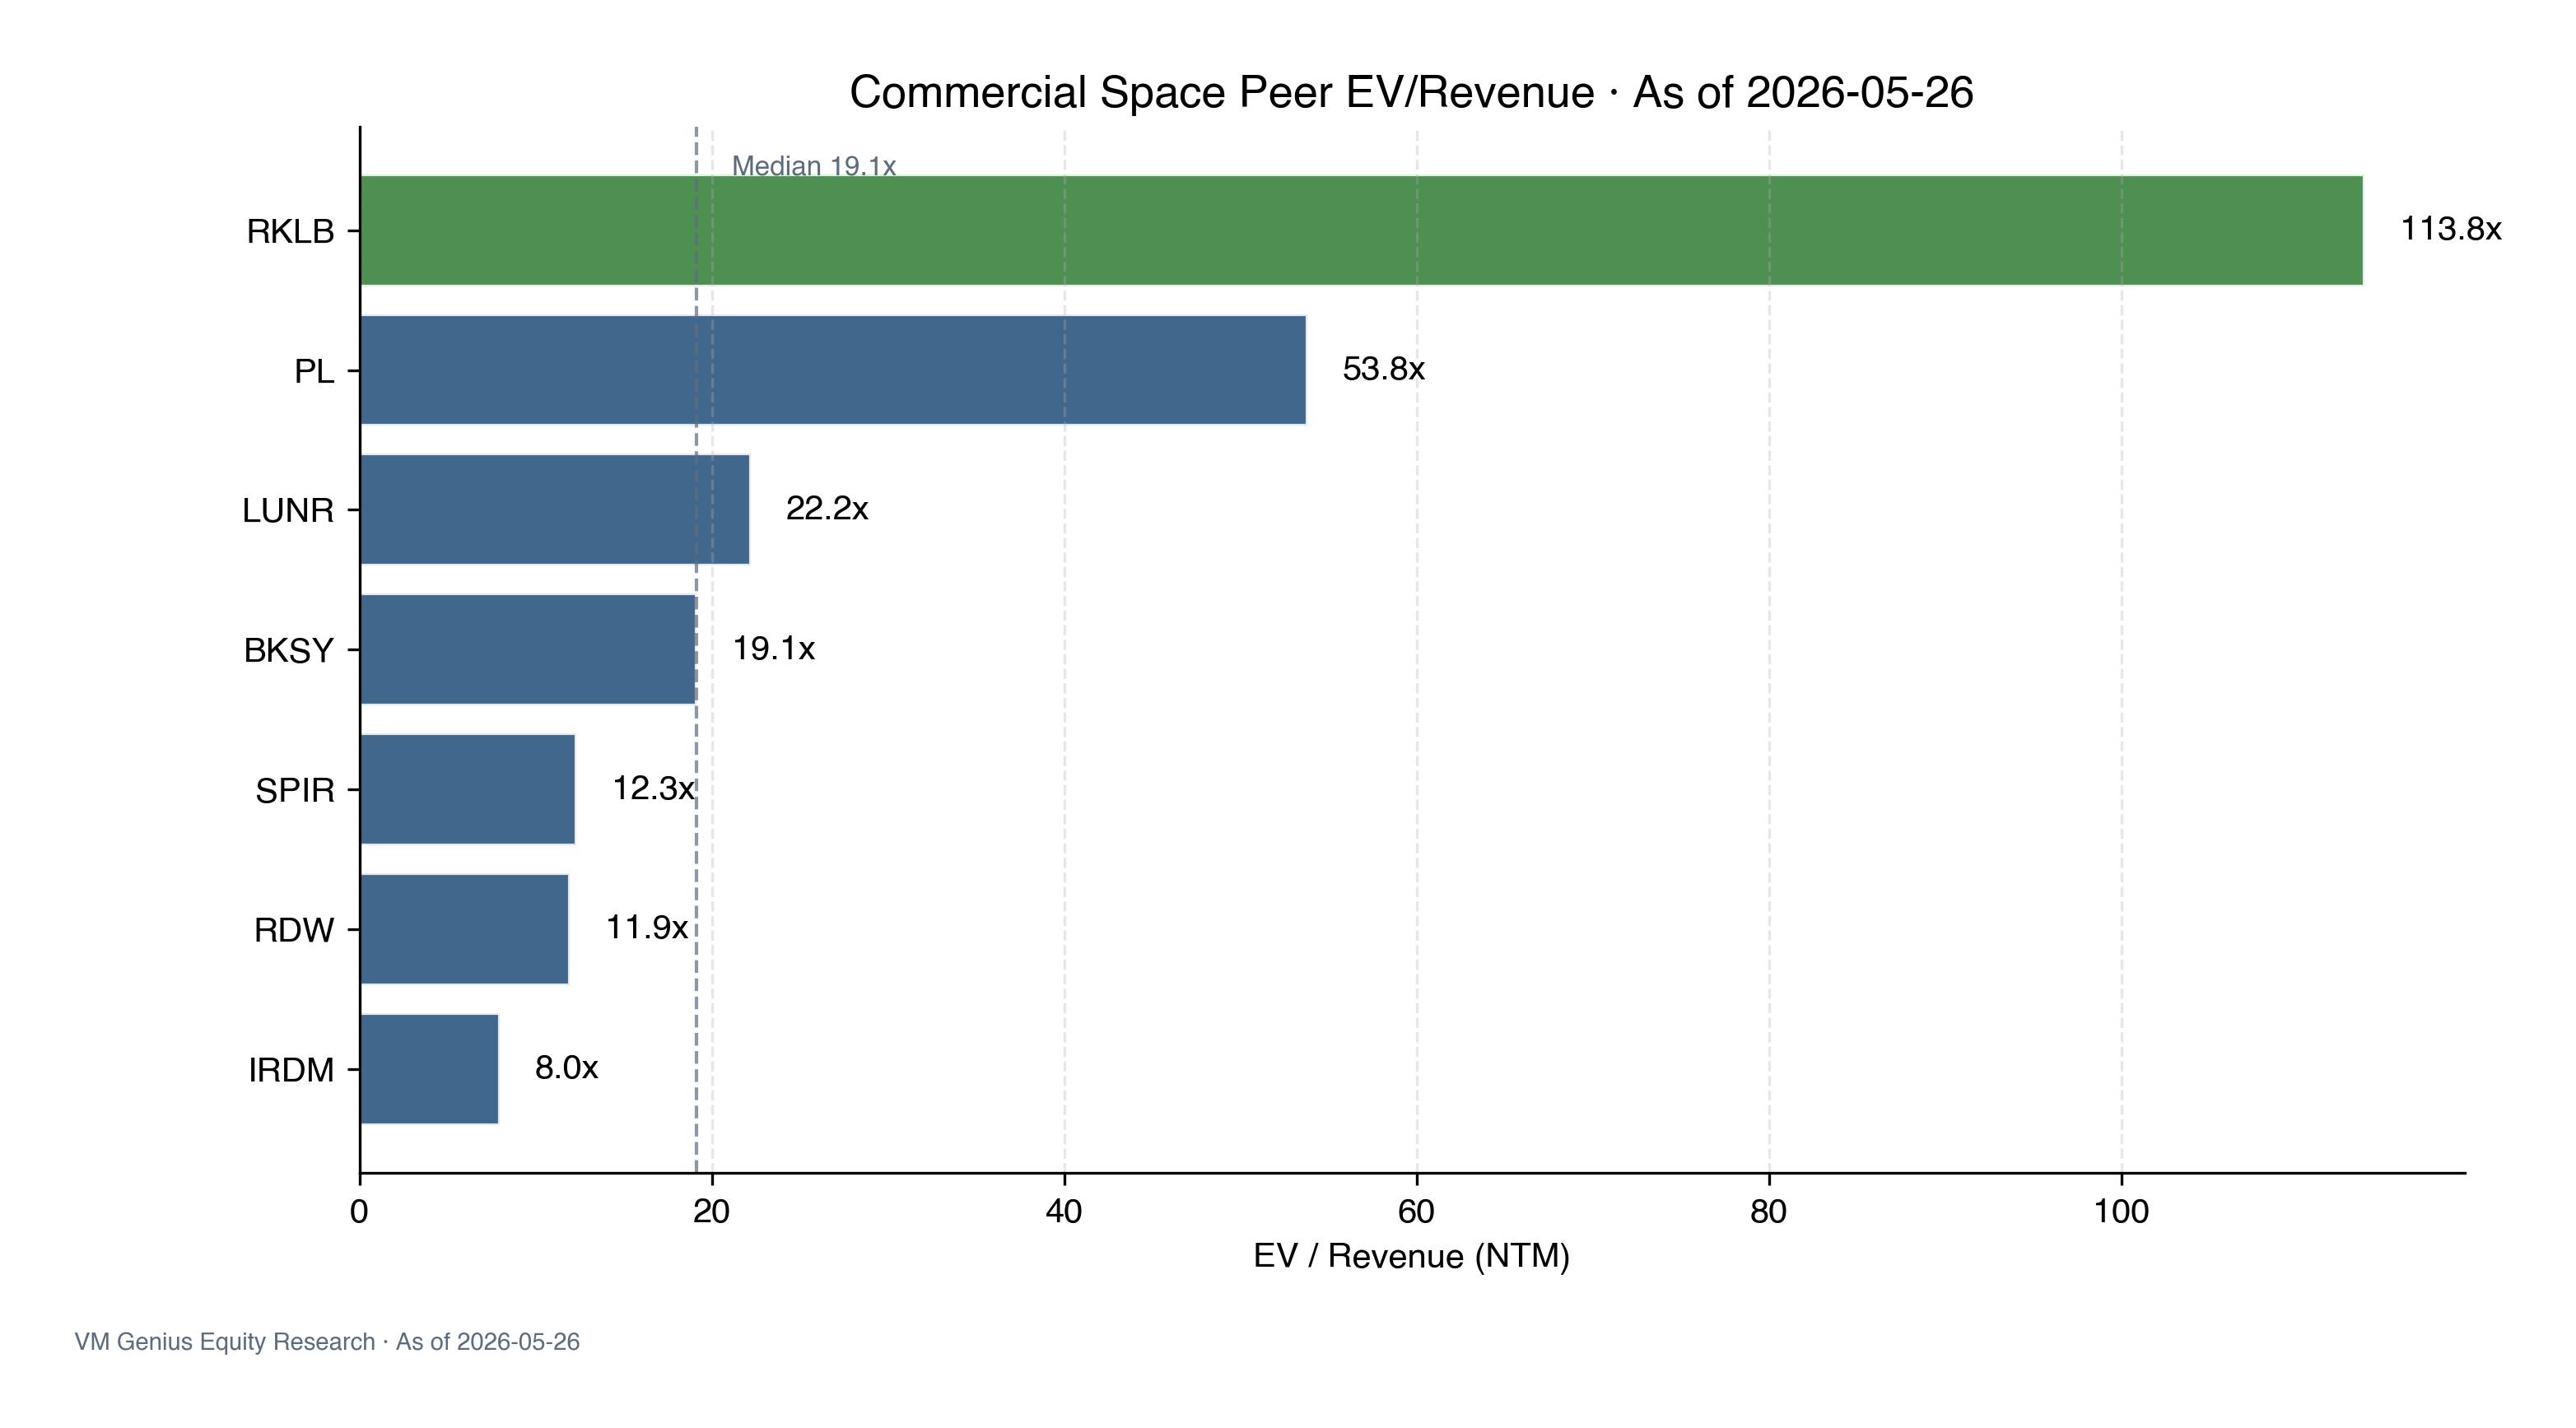
But valuation has decoupled from fundamentals: EV/Revenue (NTM) sits at 113.8x, a 500-1,300% premium over the commercial-space peer median range of 8-20x. 16 analysts cover the stock with a mean price target of $103.91 (range $60-$150) — even the most bullish $150 target implies only +4.7% upside from here.
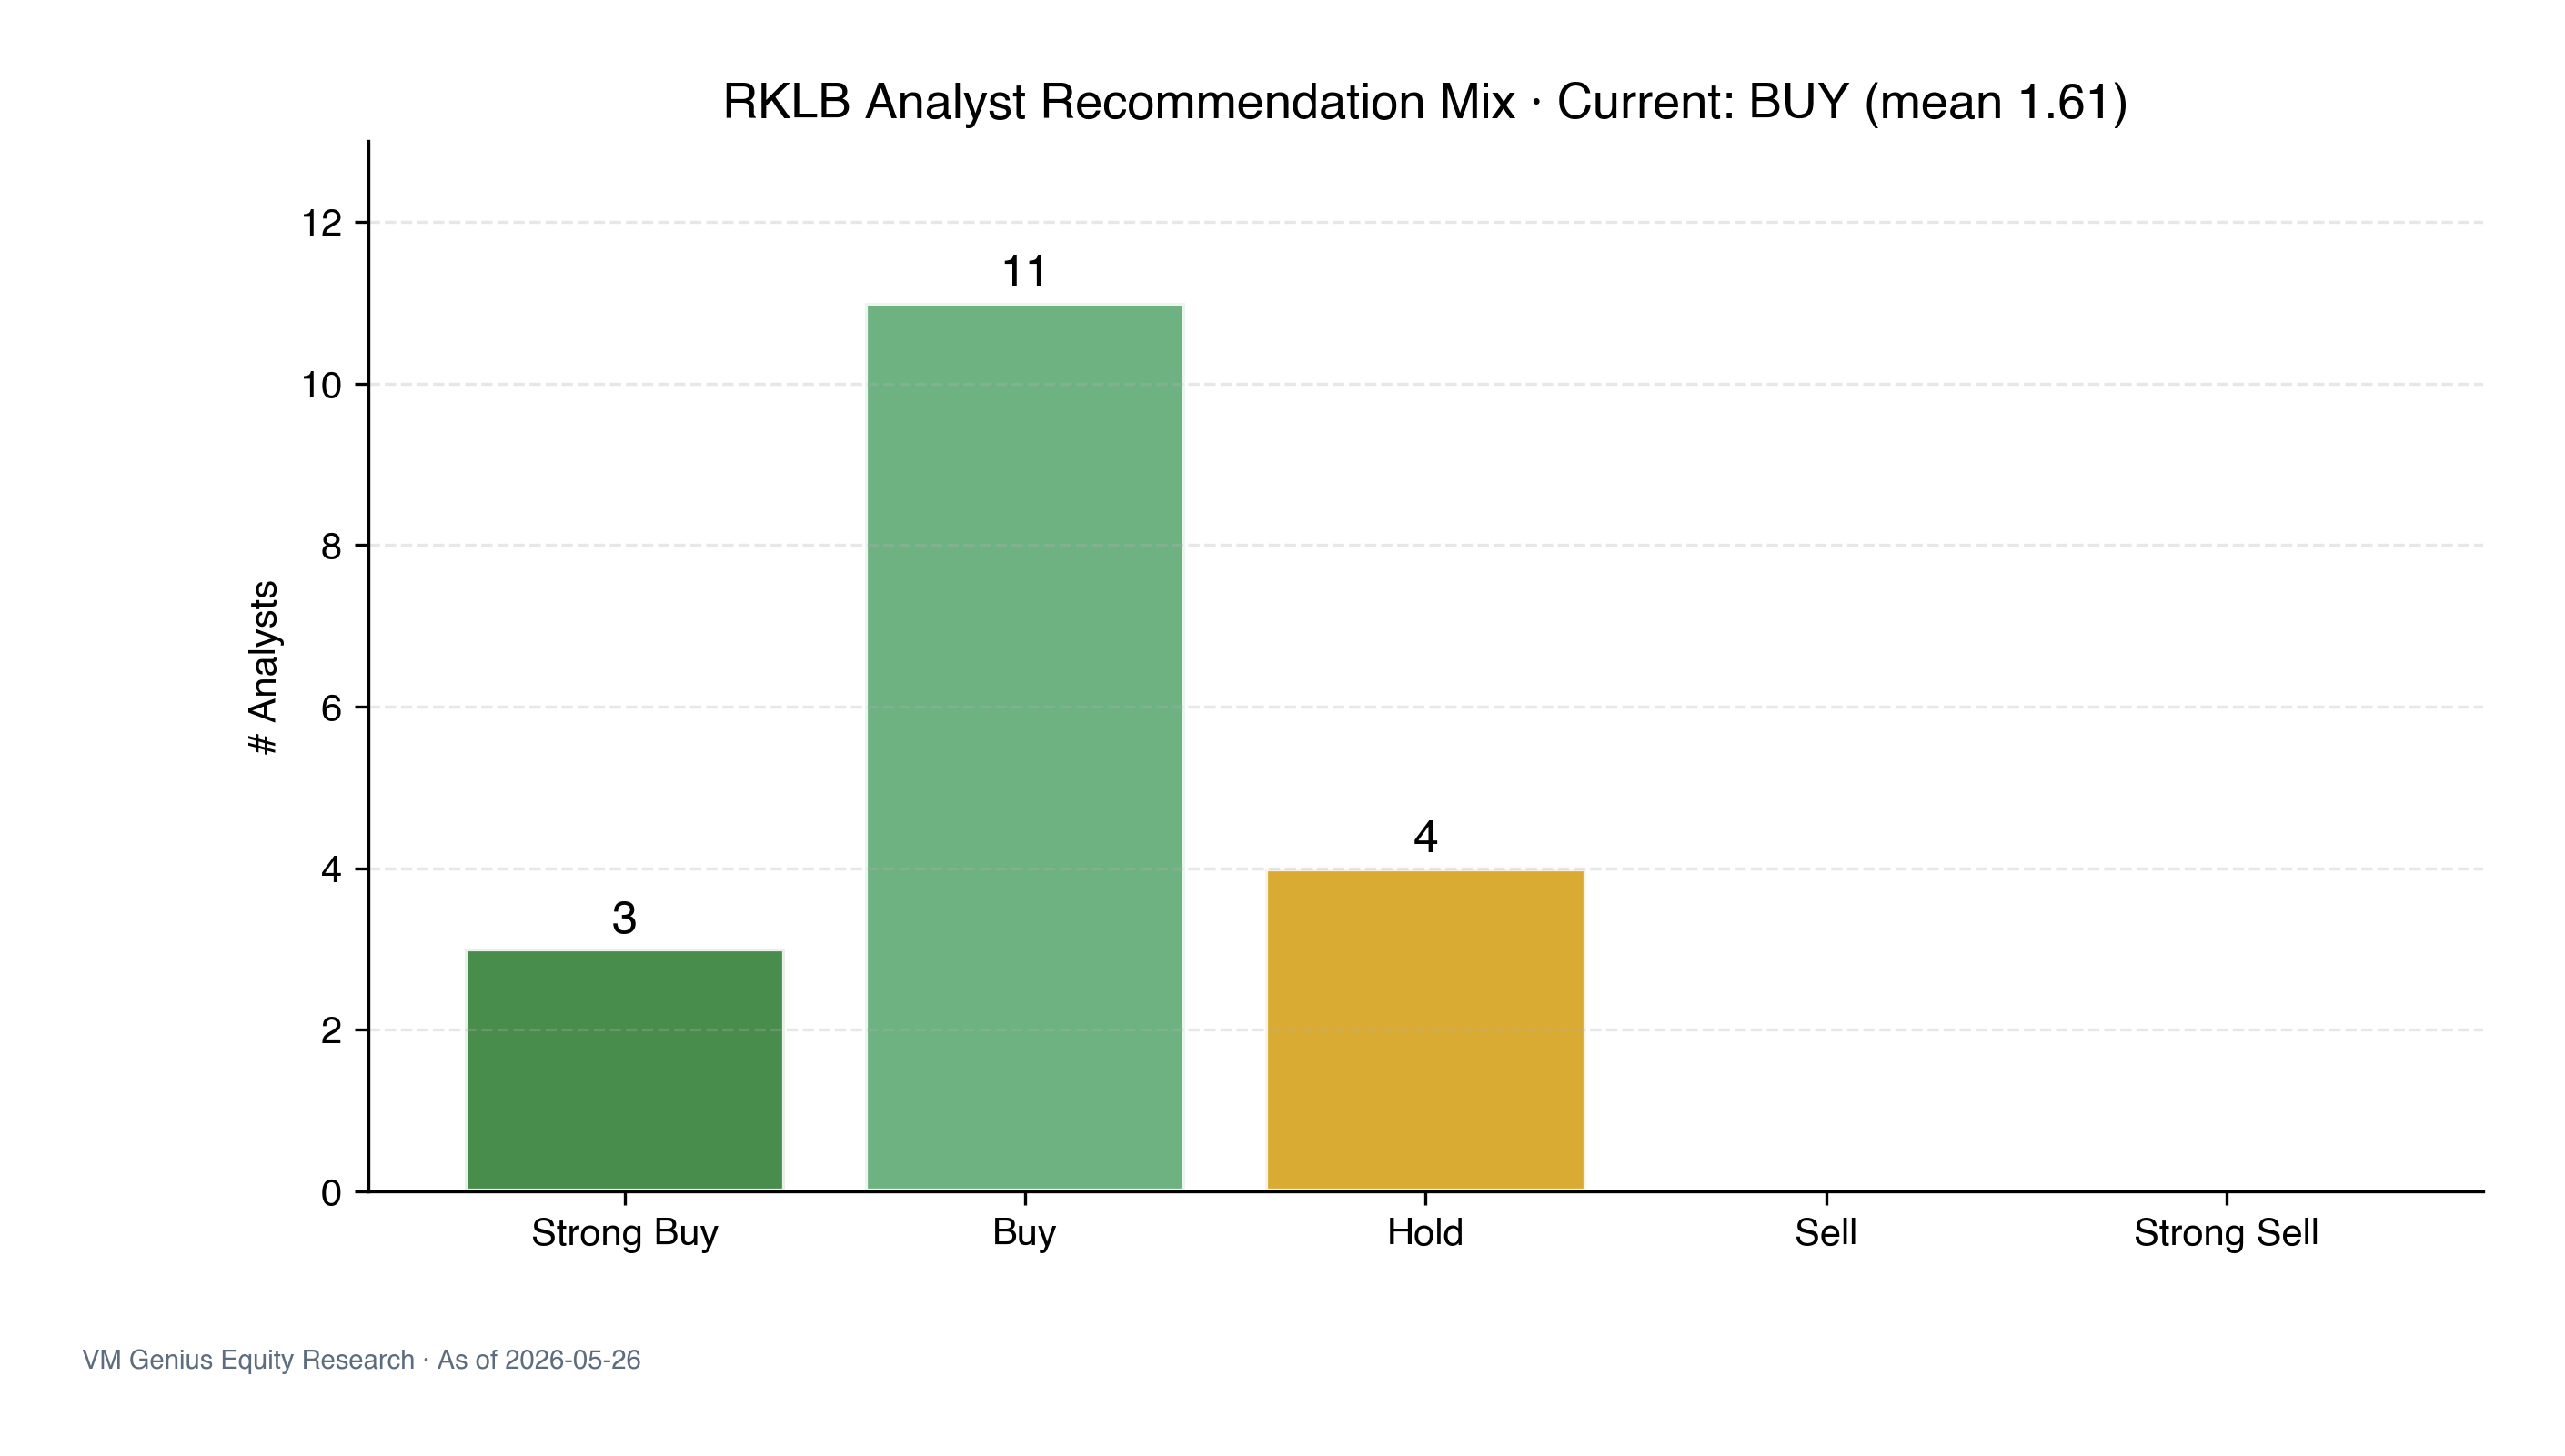
A contradictory signal: recommendation mean is 1.61 (BUY), yet every analyst's PT sits below the current price. The street believes in the long-term story but considers today's price ahead of itself. We initiate HOLD with a 12-month target of $115 (a 10% premium to consensus mean), and would upgrade on a pullback into the $100-$120 zone.
§ 02Price Action & Analyst View
"Rated BUY but PT below current price" is the classic "fundamentals constructive, near-term valuation stretched" pattern. Historical analogues (NVDA 2024-Q3, ANET 2024-Q1) typically lead to 3-9 months of choppy consolidation as price converges back to the consensus-band midpoint. Analysts won't downgrade for fear of missing a rebound, but they also won't raise PTs to validate the euphoria.
§ 03Investment Thesis: Bull vs Bear Tug of War
3.1 Bull Case · Fundamentals Catching Up
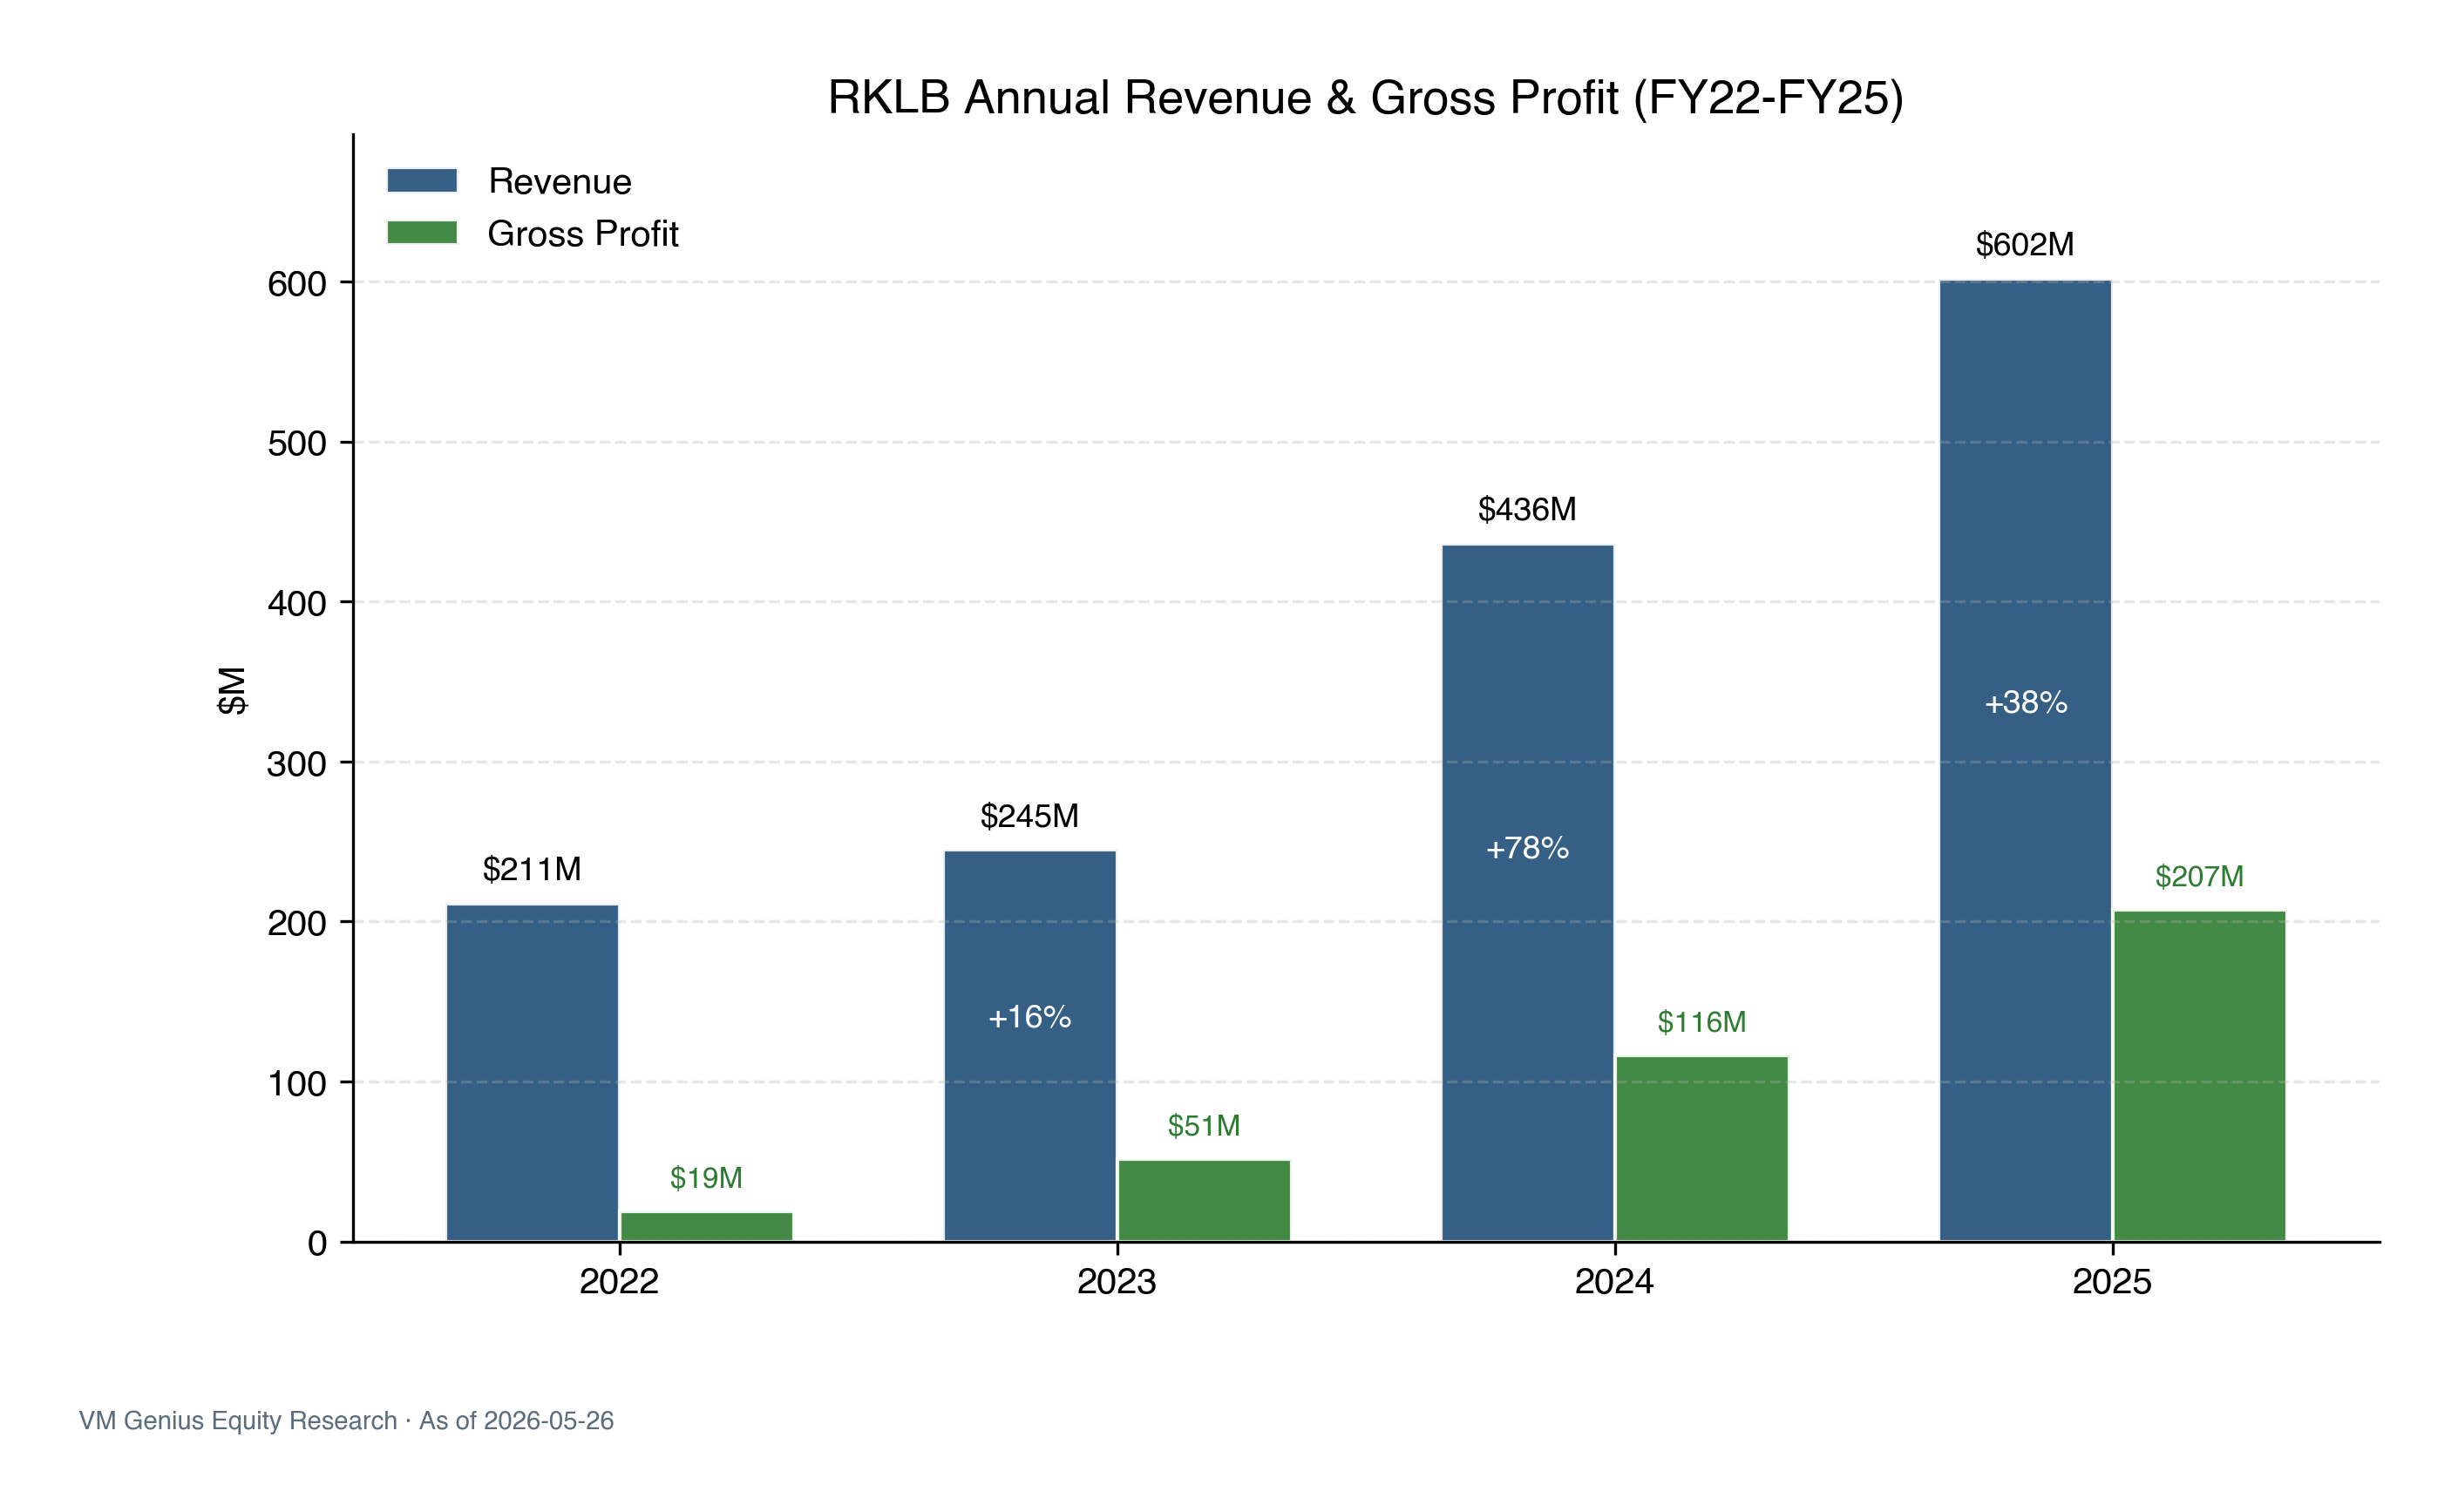
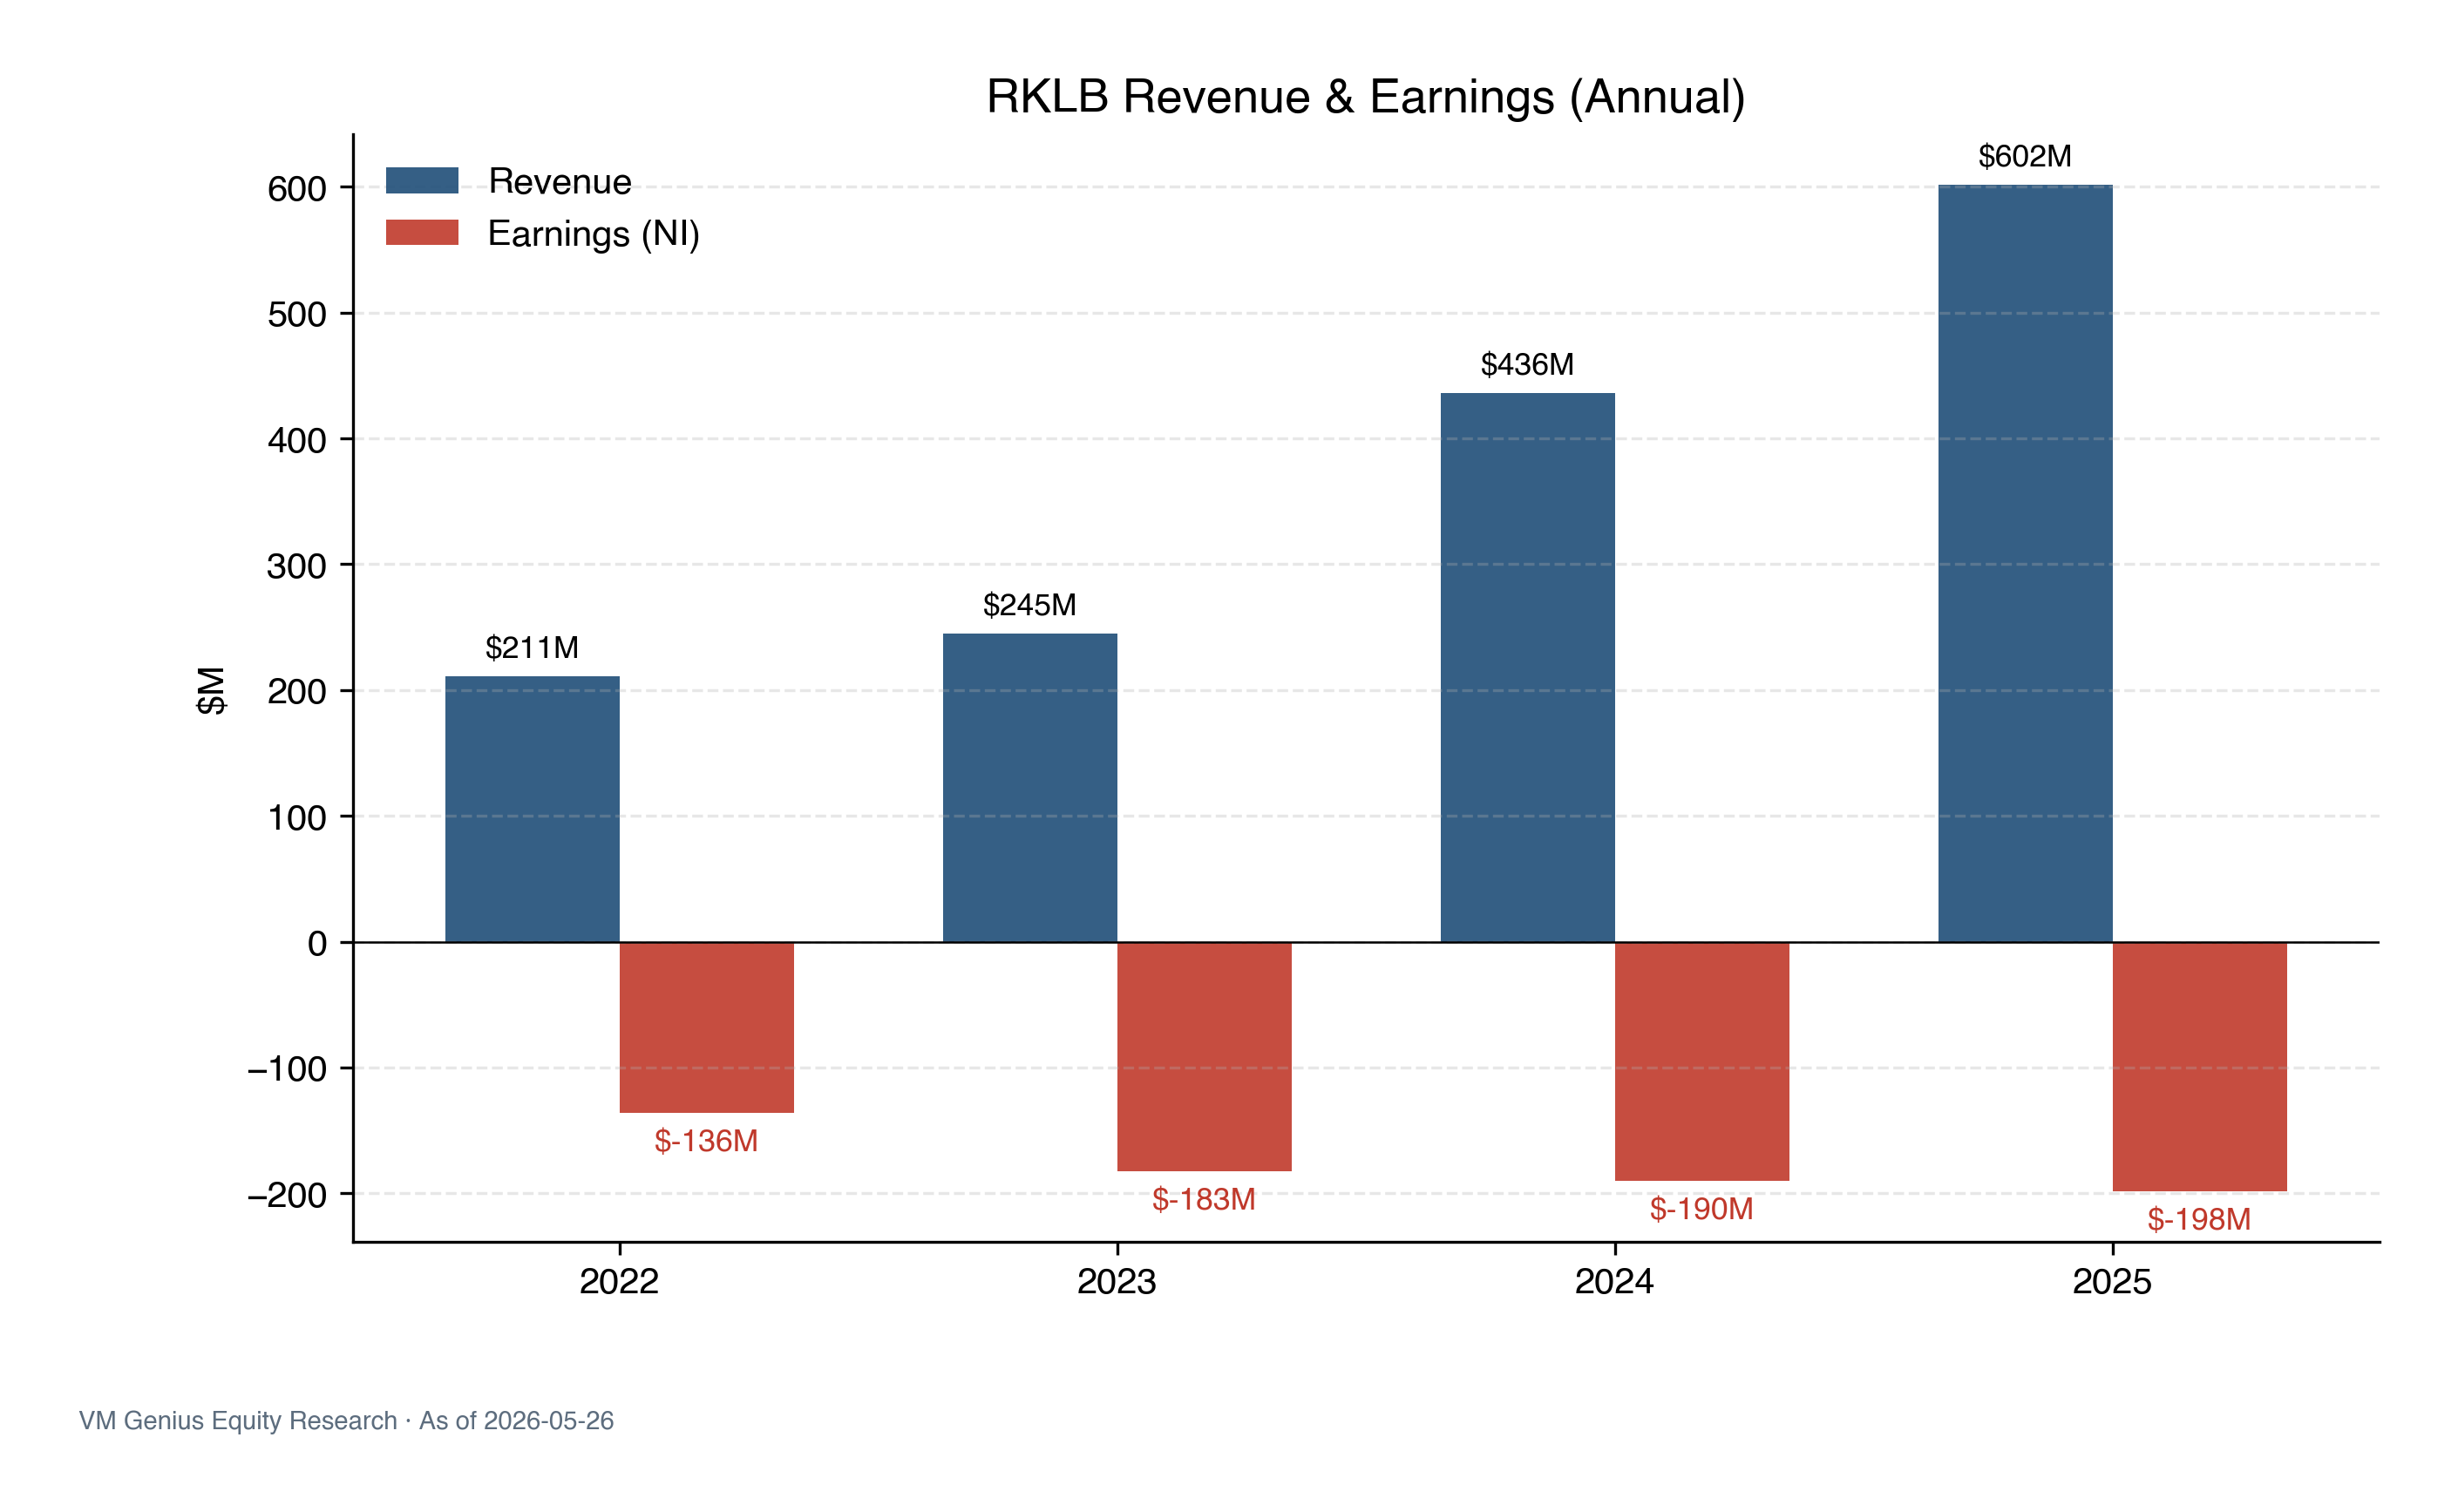
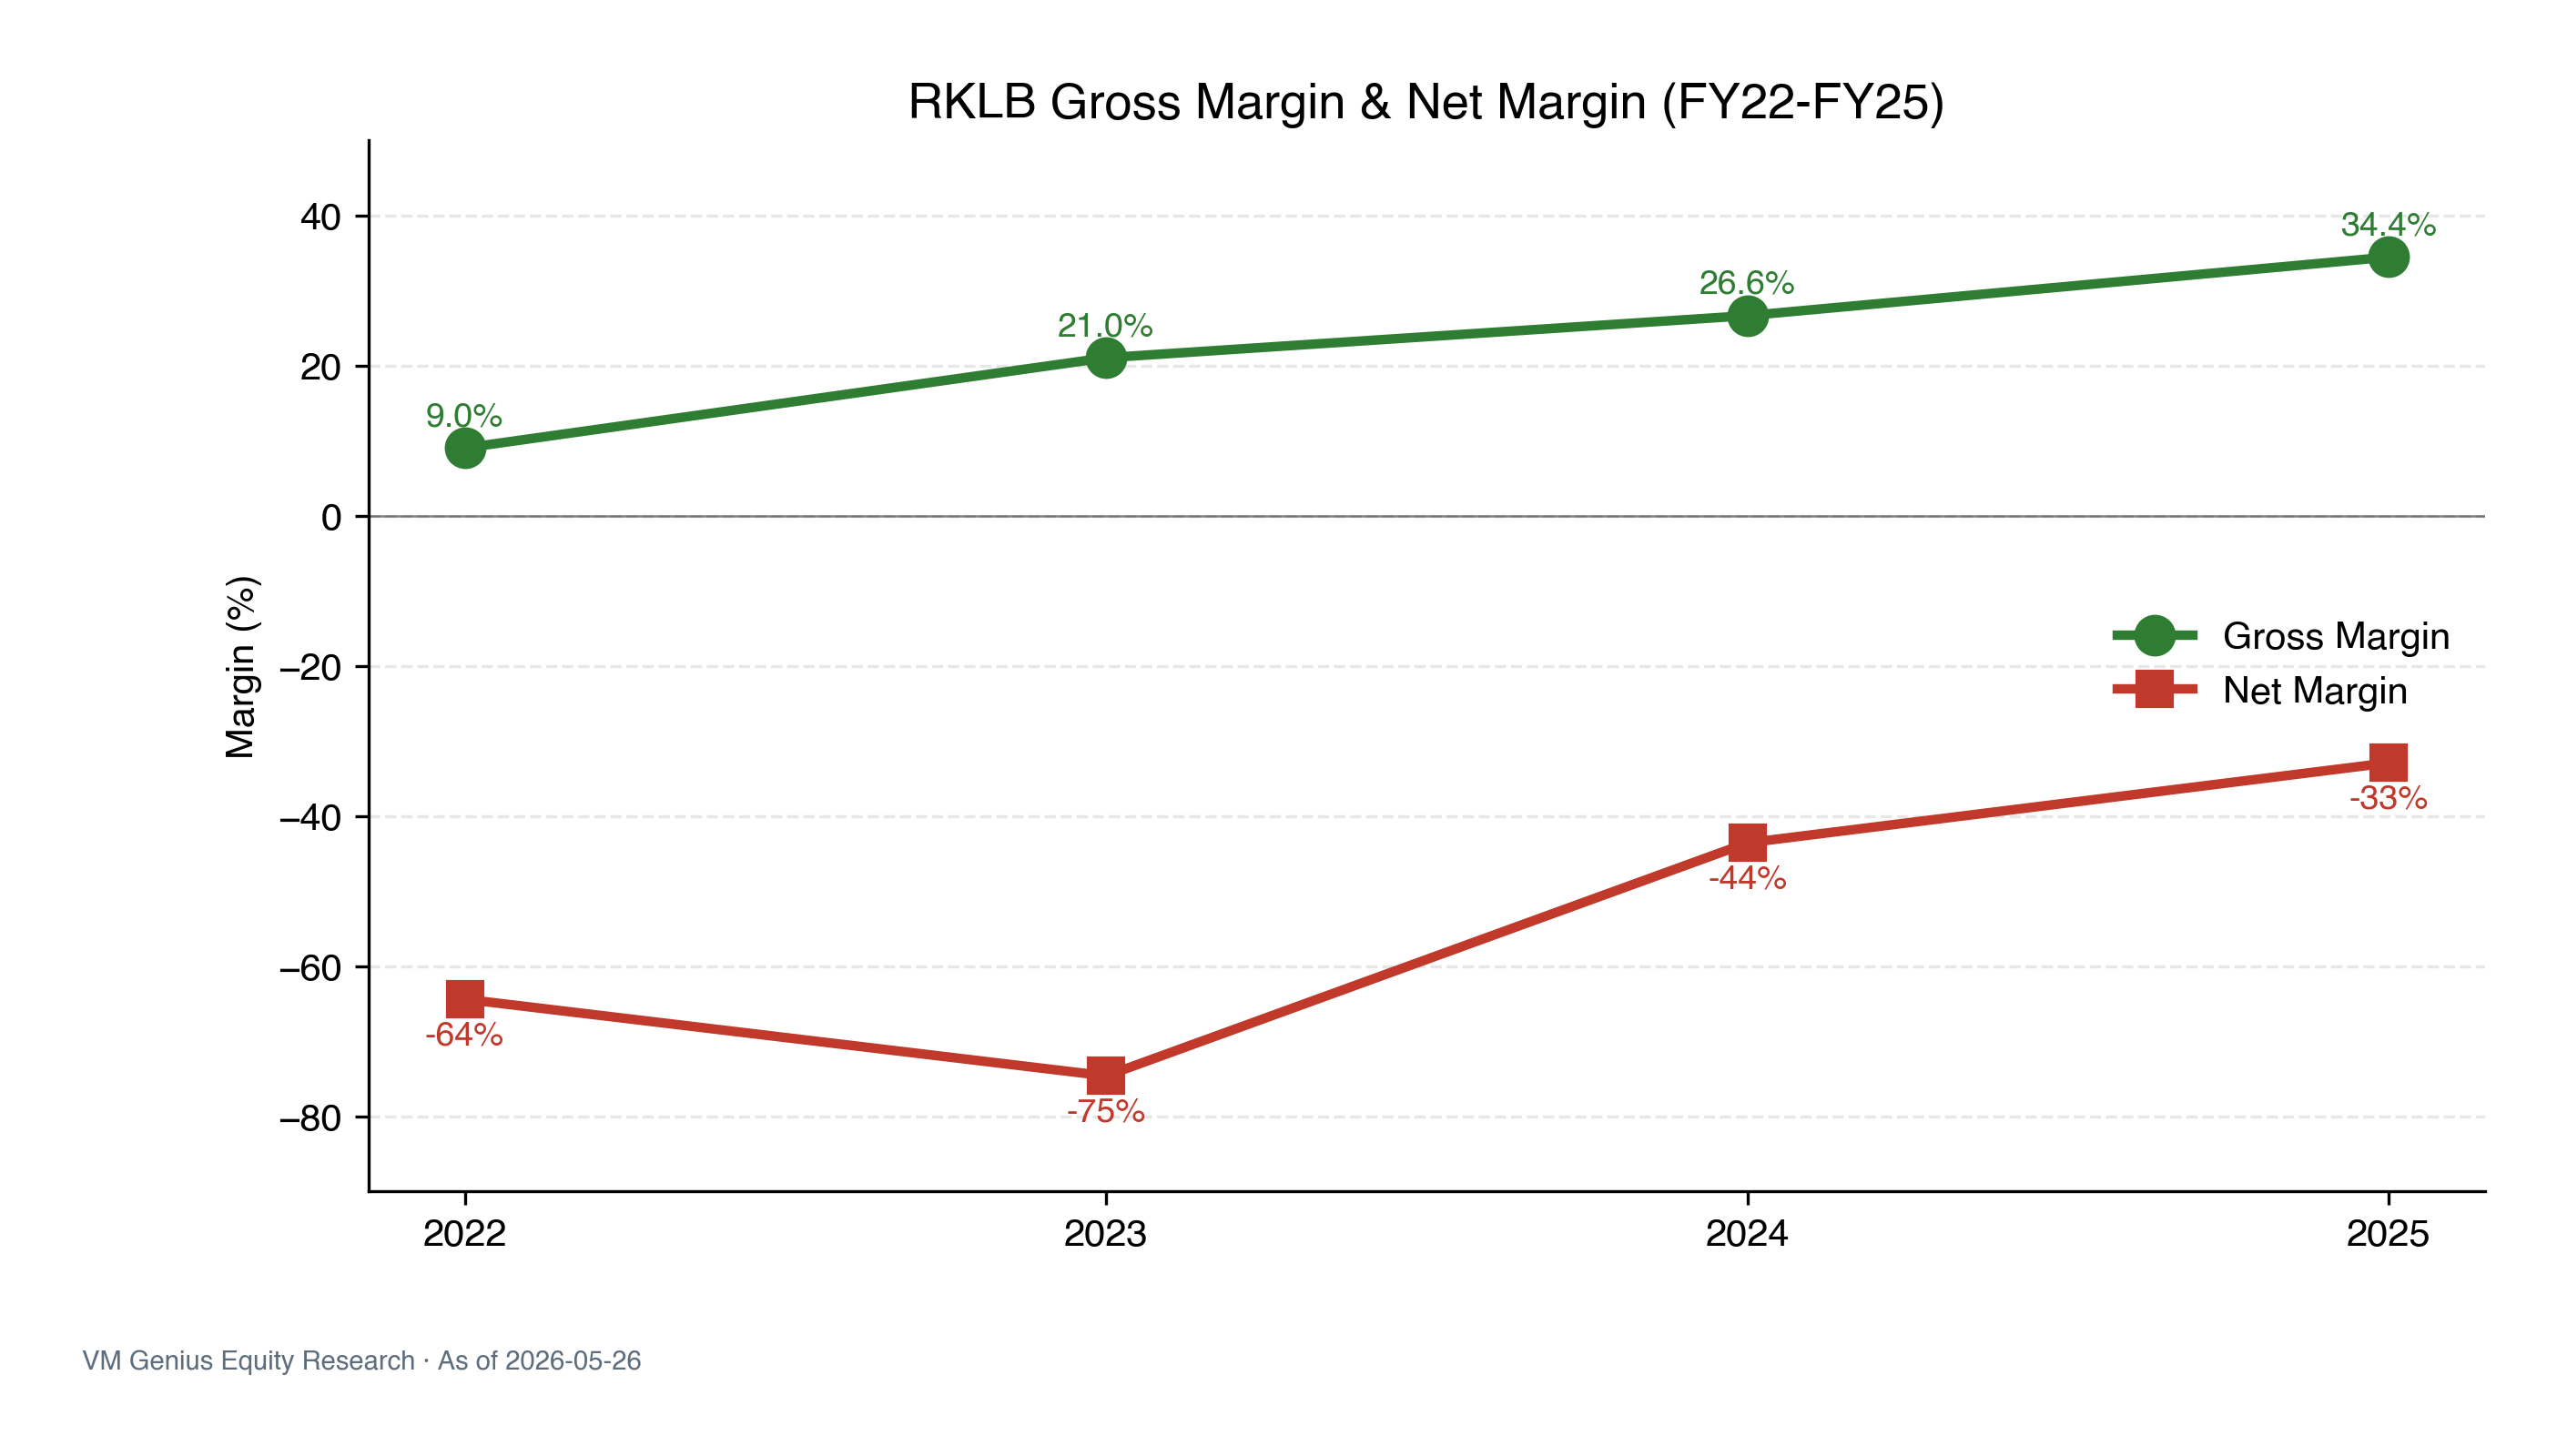
Reported FY25 revenue was $602M, +38% over FY24 ($436M); TTM revenue growth reached +63.5%. Gross margin expanded from 9.0% in FY22 (just $19M GP on $211M Rev) to 34.4% in FY25 ($207M GP), with TTM further at 36.6%. This is real, verifiable execution — the business is shifting from a "high-burn, low-margin small-launch player" into a "vertically-integrated, margin-expanding space platform."
Catalysts ahead: (a) Neutron medium-lift hasn't flown yet — a successful debut would open the $10B+ medium-lift TAM; (b) SDA Tranche 3 prime contract is expected to be awarded in 2H 2026, with RKLB one of four credible primes; (c) NSSL Phase 3 Lane 1 first task-order allocation will convert the $5.6B IDIQ ceiling into visible bookings. 14 of 18 analysts rate Buy/Strong Buy, reflecting the bull consensus.
3.2 Bear Case · Valuation Priced 3Y of Perfection
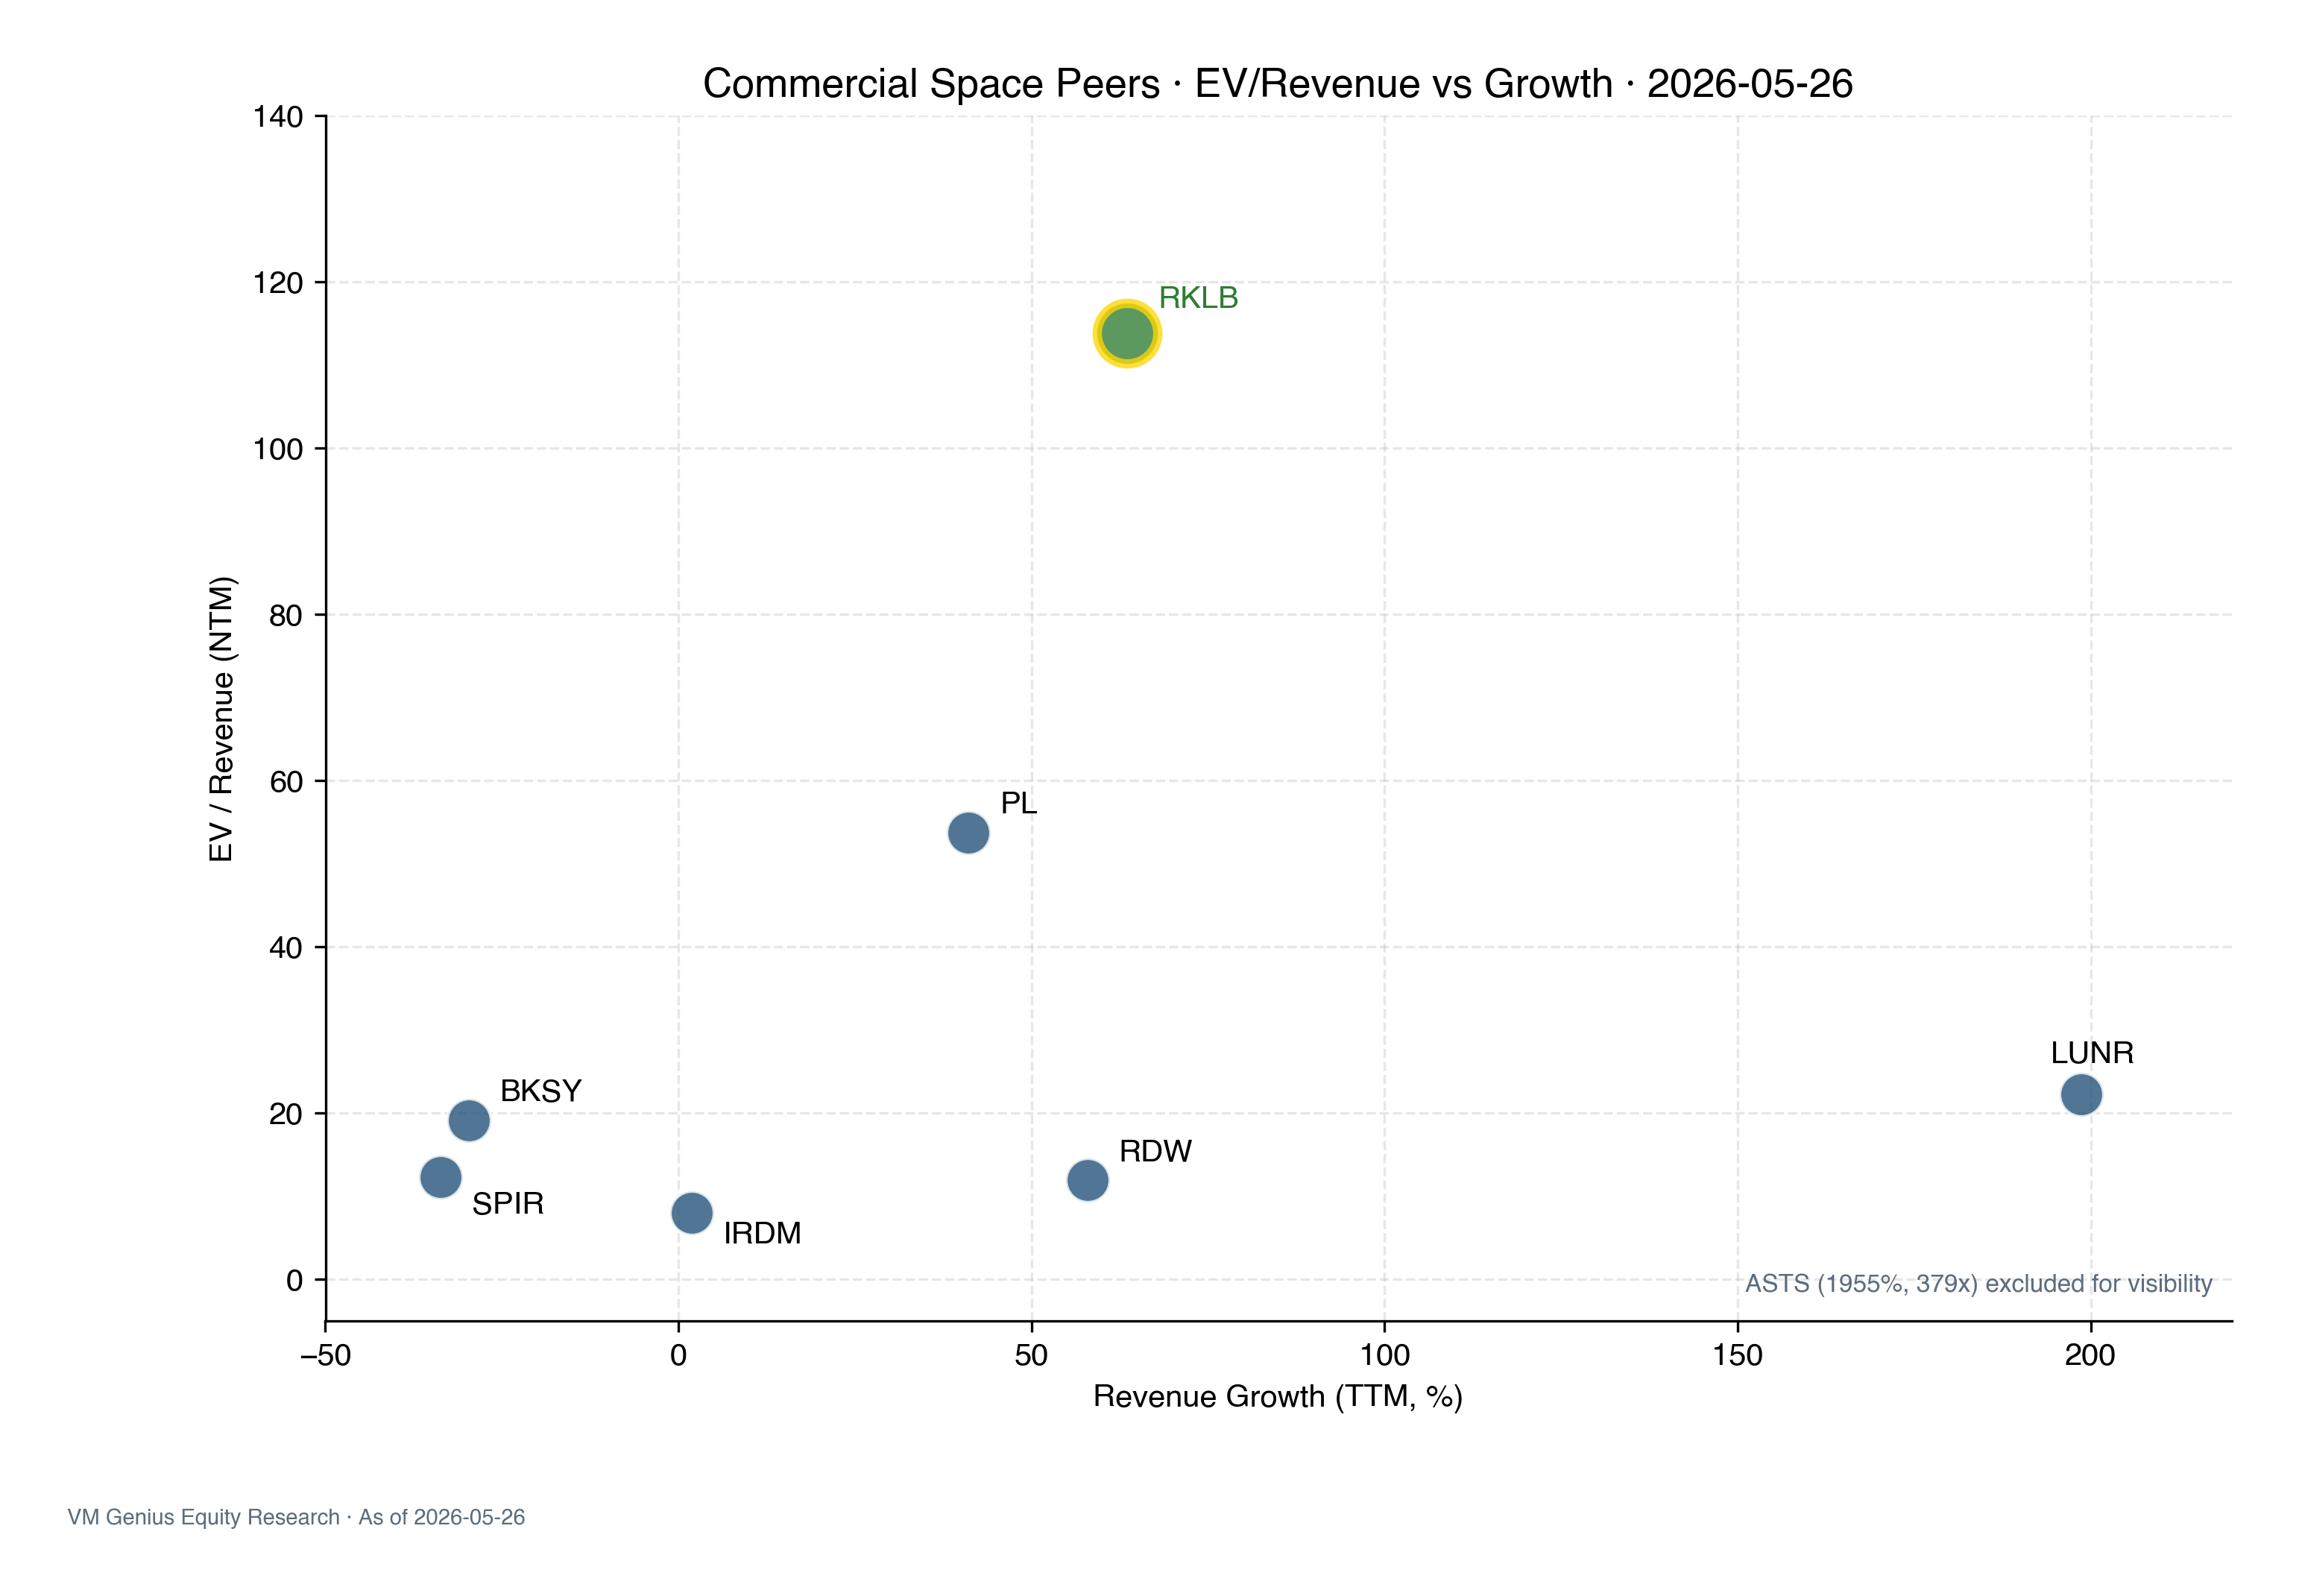
What does 113.8x EV/Revenue mean? Real peer comps: Iridium (IRDM) 8.0x, Redwire (RDW) 11.9x, Spire (SPIR) 12.3x, BlackSky (BKSY) 19.1x, Intuitive Machines (LUNR) 22.2x, Planet Labs (PL) 53.8x. Even the most expensive peer — PL — is less than half RKLB's multiple.
Working back from FY27E revenue of $1,282M (18-analyst consensus): the current $83B EV implies EV / 2027E Rev = 65x. Historically, even the highest-quality high-growth SaaS / defense names haven't traded sustainably above 25-30x forward revenue. To compress from 65x to a more sustainable 15x, revenue would need to grow another 4.3x to ~$5.5B just to maintain today's price — implying 30%+ growth for 5 straight years, with Neutron commercialization, meaningful SDA share, and new business lines all landing on time.
Additional risk signals: insider ownership is just 0.88% (well below the healthy 5-15% typical for space startups). After the 472% 12-month run, most of the retail float has shifted under the momentum-factor umbrella; if momentum rotation reverses (cf. the 2024-04 GLP-1 sector -25% in weeks), pullback risk is elevated.
§ 04Financial Truth (Reported)
Annual Financial Summary ($M · Reported)
| ($M) | FY22 | FY23 | FY24 | FY25 | FY25 vs FY22 |
|---|---|---|---|---|---|
| Revenue | 211 | 245 | 436 | 602 | +185% |
| Gross Profit | 19 | 51 | 116 | 207 | +989% |
| Gross Margin | 9.0% | 20.8% | 26.6% | 34.4% | +25pp |
| Net Income | (136) | (183) | (190) | (198) | Still loss |
| Net Margin | (64.5%) | (74.7%) | (43.6%) | (32.9%) | +32pp |
§ 05Peer Comparison (Real EV/Revenue)
| Company | Ticker | Mkt Cap ($B) | EV/Rev NTM | Rev Growth TTM | Gross Margin |
|---|---|---|---|---|---|
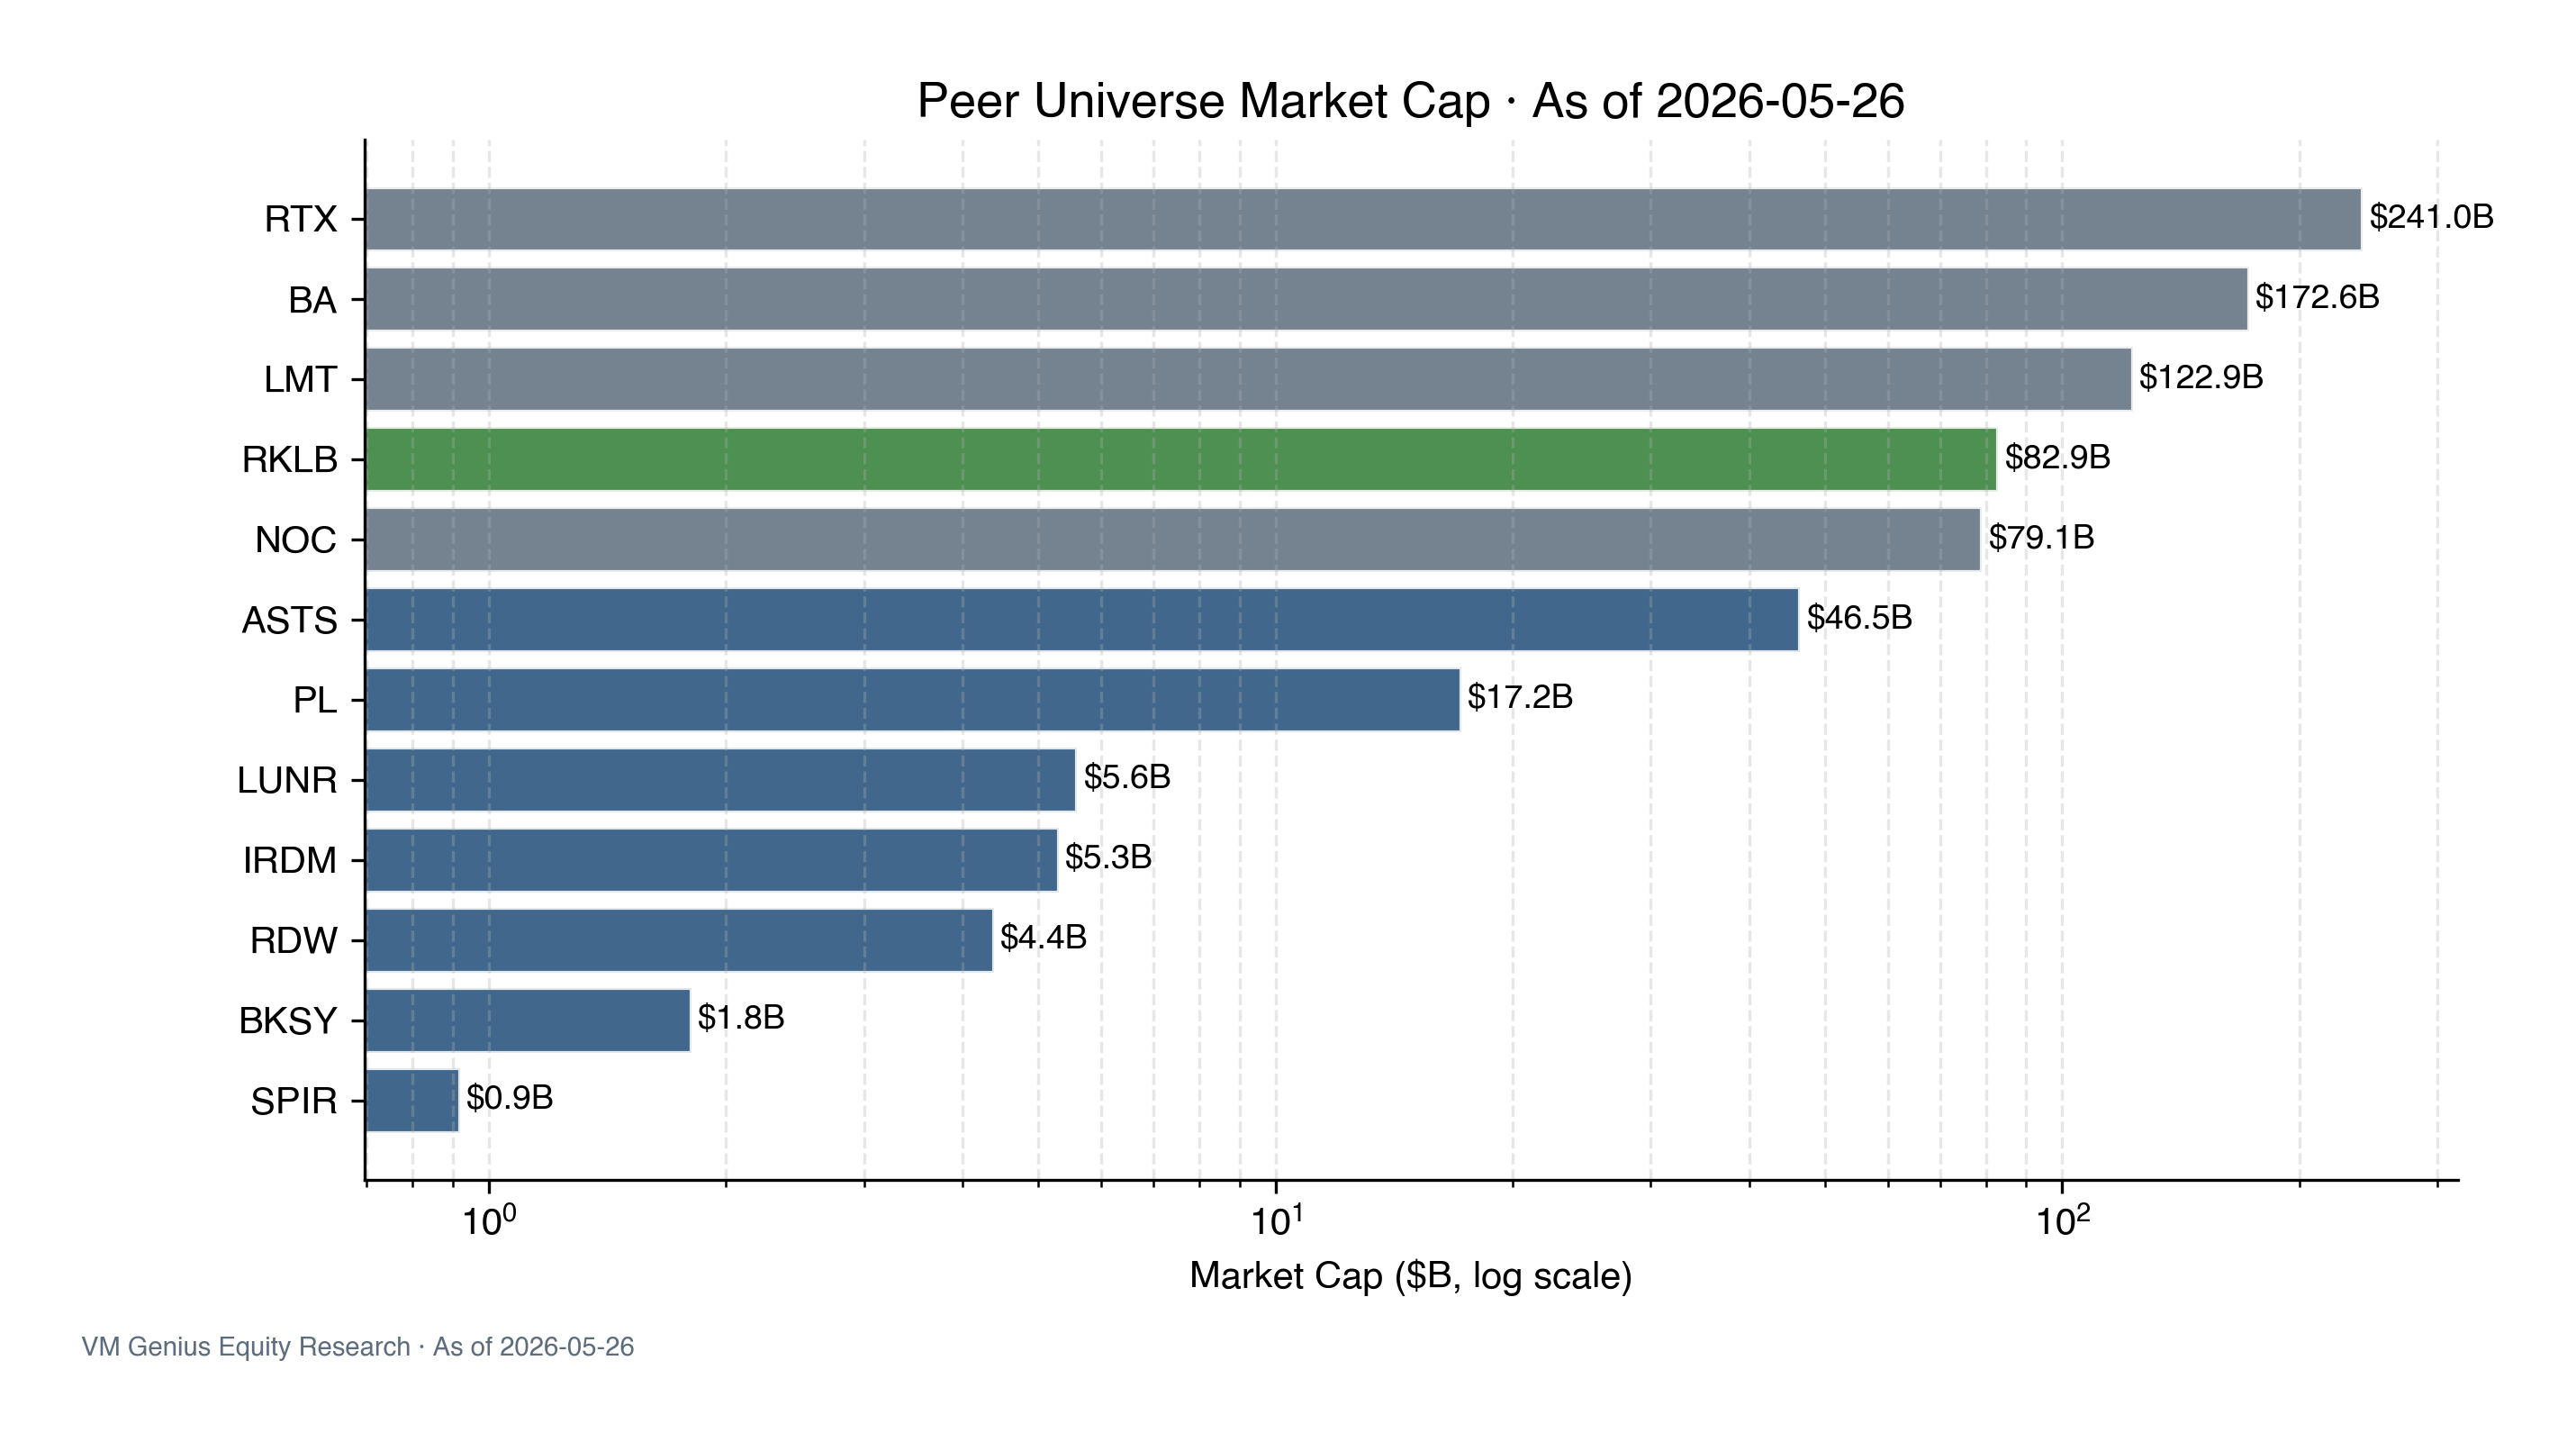
| Rocket Lab | RKLB | 82.9 | 113.8x | +63.5% | 36.6% |
| AST SpaceMobile | ASTS | 46.5 | 378.7x* | pre-rev | n/a |
| Planet Labs | PL | 17.2 | 53.8x | +12.5% | ~50% |
| Intuitive Machines | LUNR | 5.6 | 22.2x | +85% | ~10% |
| BlackSky | BKSY | 1.8 | 19.1x | +30% | ~14% |
| Spire Global | SPIR | 0.9 | 12.3x | +20% | ~50% |
| Redwire | RDW | 4.4 | 11.9x | +20% | ~15% |
| Iridium | IRDM | 5.3 | 8.0x | +4% | ~70% |
| Commercial Space Median | — | ~5 | ~19x | ~22% | ~30% |
| Boeing (defense ref.) | BA | 172.6 | ~2x | +5% | ~15% |
| RTX (defense ref.) | RTX | 241.0 | ~2.5x | +8% | ~22% |
* ASTS lacks scaled revenue, so its EV/Revenue multiple is distorted — shown for reference only. Data as of 2026-05-26.
§ 06Ownership Structure
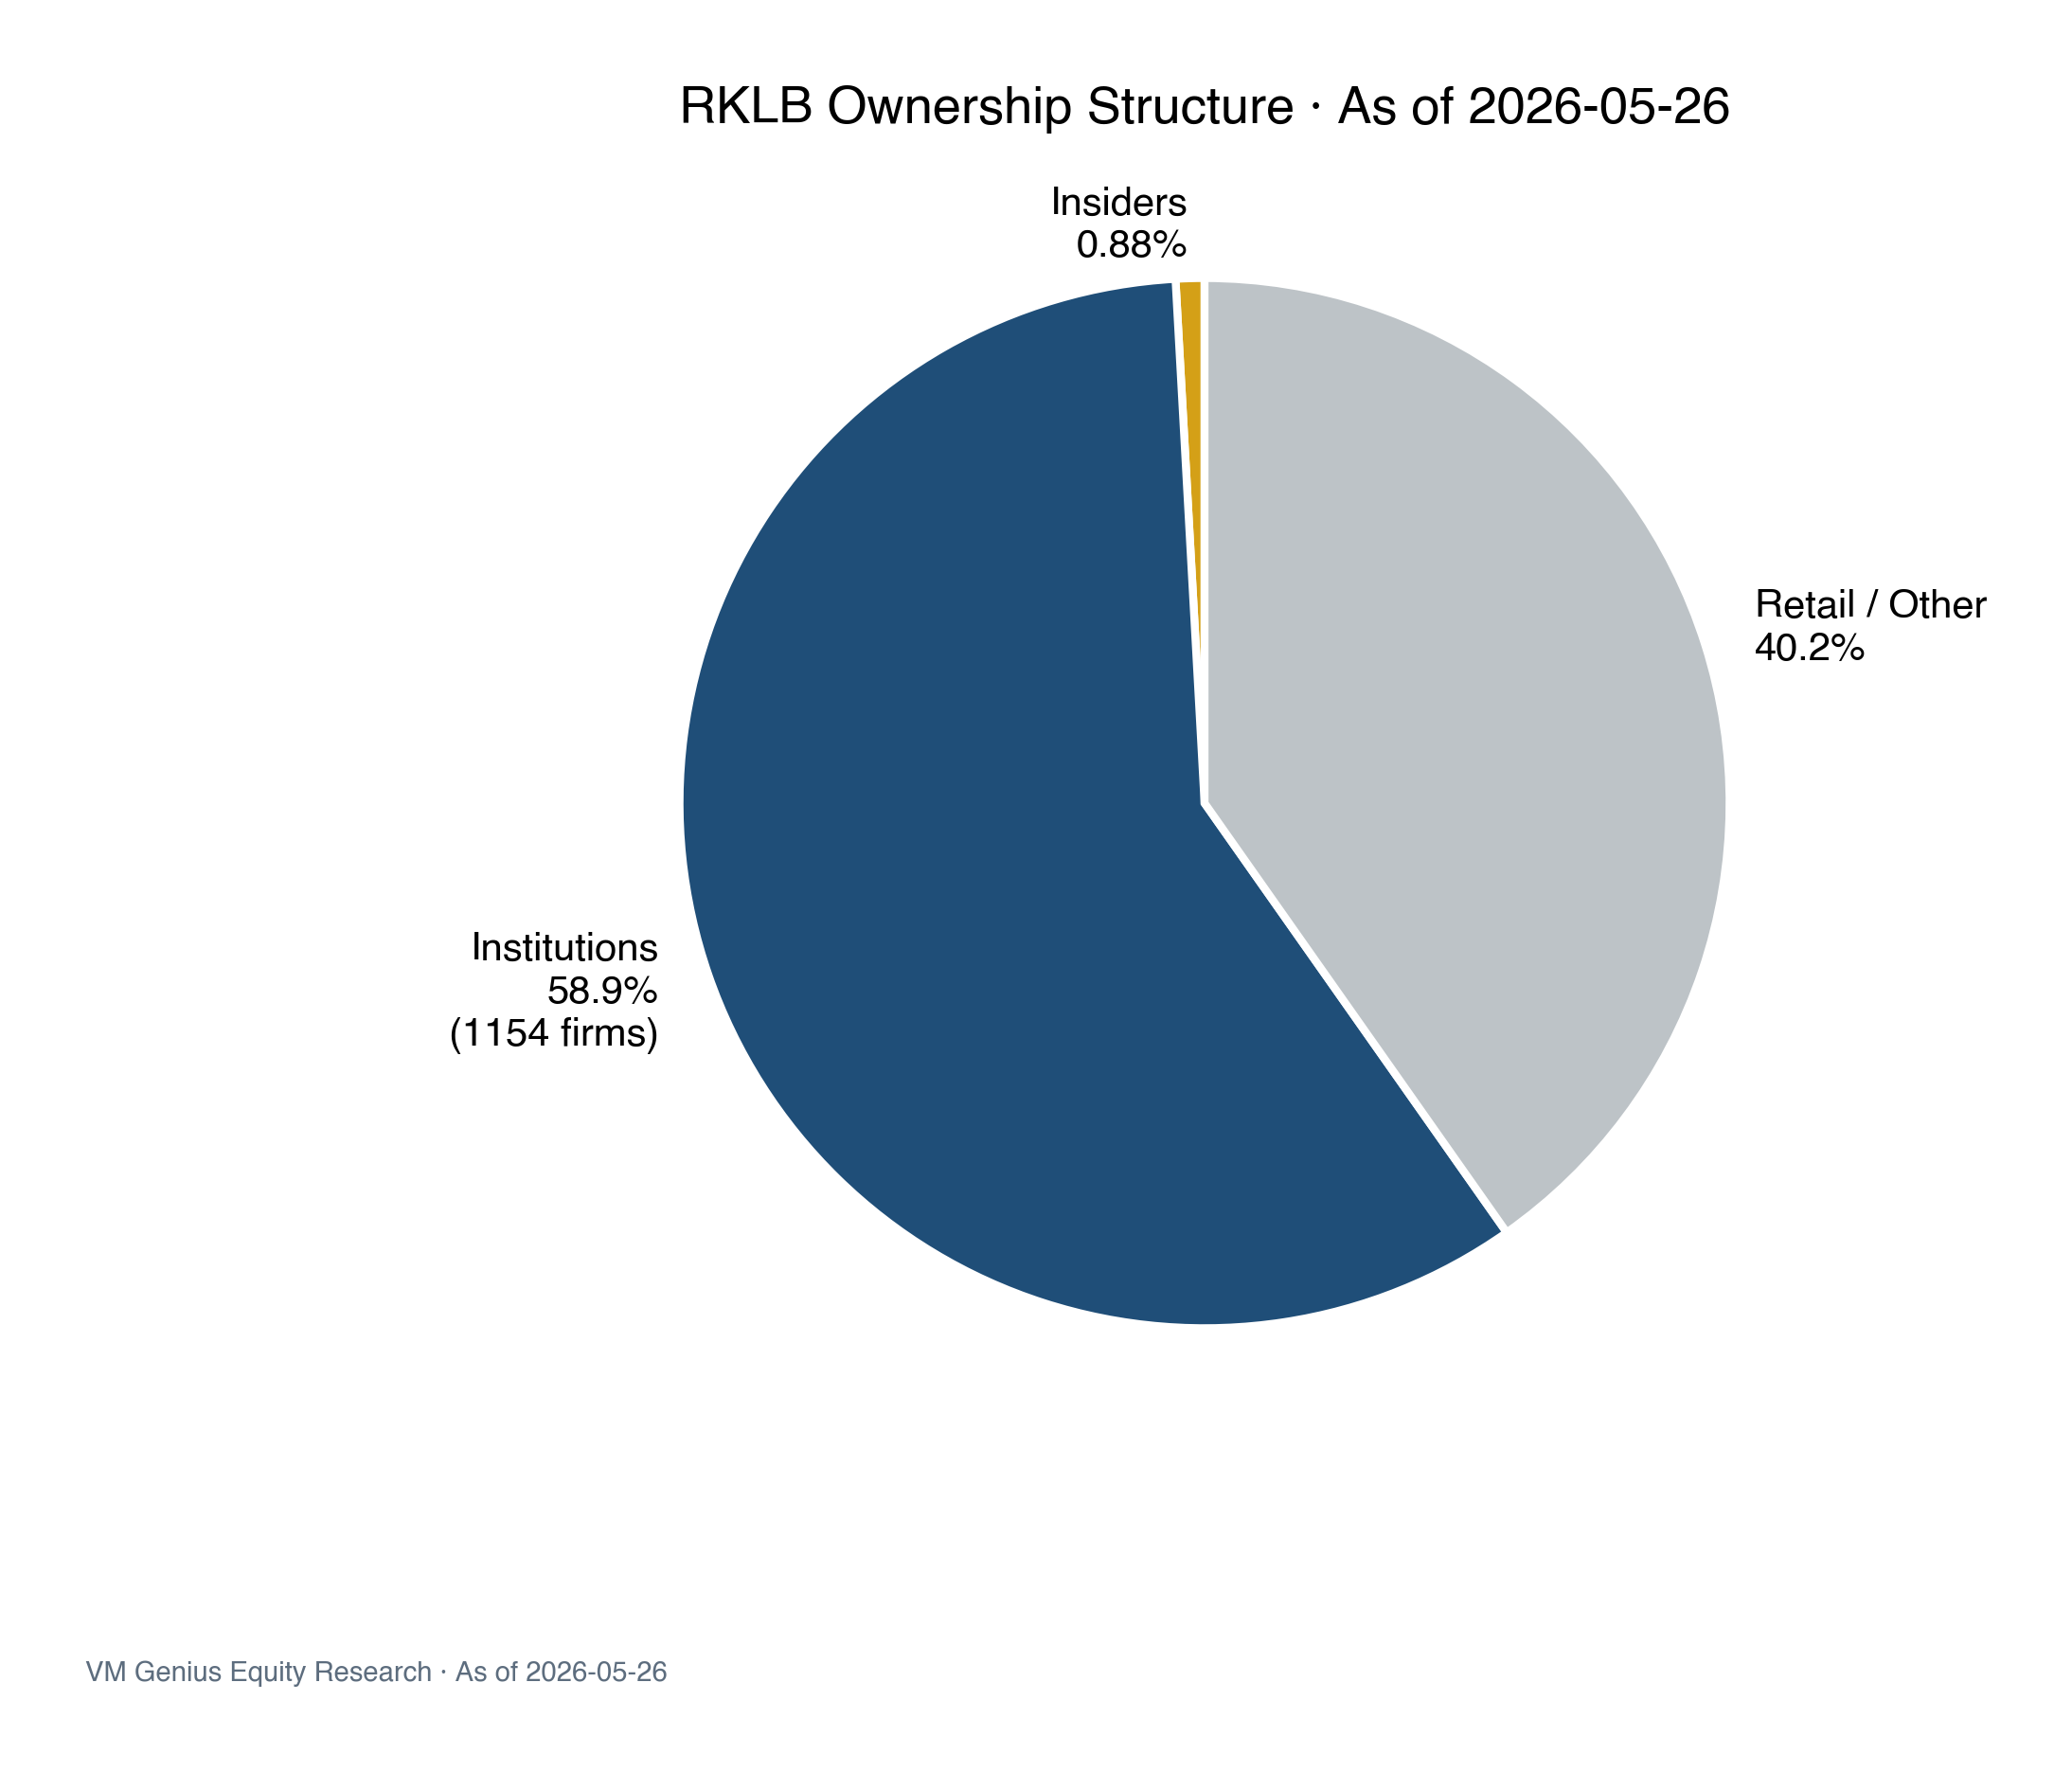
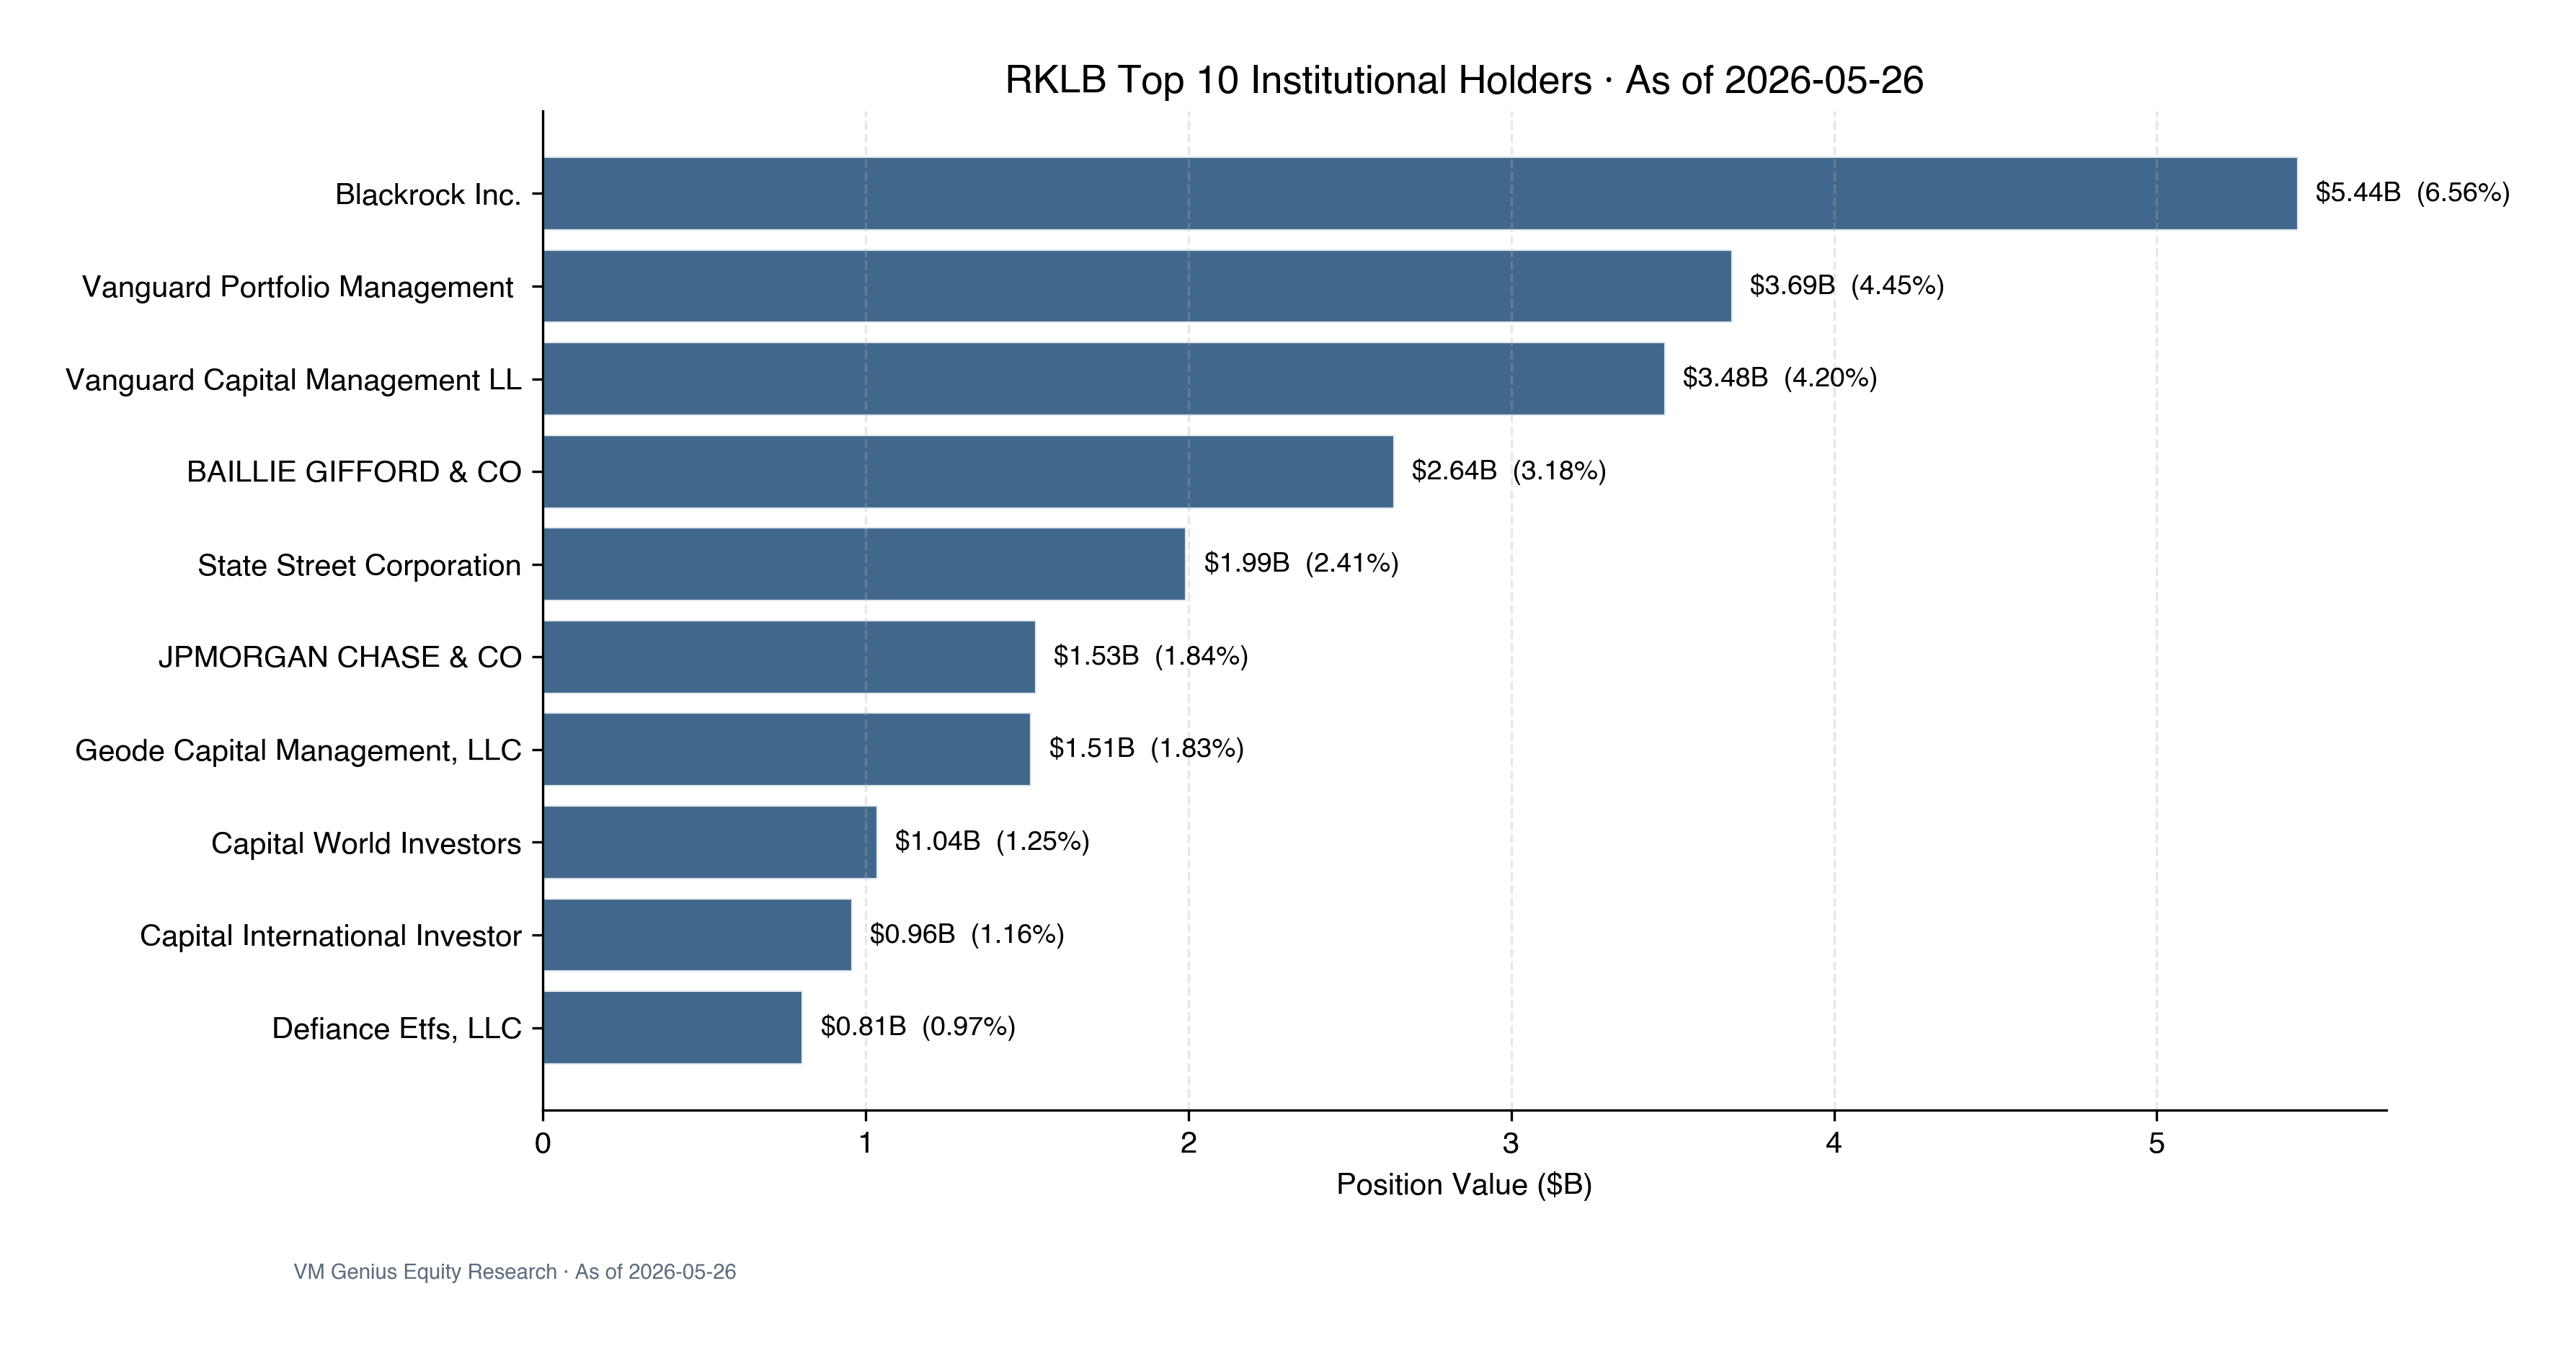
Insider ownership at 0.88% is notably below the healthy 5-15% range typical for space startups, reflecting the heavy founder-and-early-investor selldown over the past 12 months (stock +472%) via lockup expirations and secondary sales. This dampens the strength of management confidence signals.
§ 07Analyst Estimates (Consensus)
| Period | Revenue Mean | Revenue Range | EPS Mean | # Analysts | Expected Release |
|---|---|---|---|---|---|
| Q2 2026 (0q) | $230M | $207M - $236M | ($0.07) | 11-14 | 2026-08-06 |
| Q3 2026 (+1q) | $234M | $200M - $254M | ($0.06) | 11-14 | 2026-11 (est) |
| FY 2026 (0y) | $911M | $851M - $983M | ($0.25) | 14-18 | — |
| FY 2027 (+1y) | $1,282M | $1,100M - $1,535M | ($0.04) | 14-19 | — |
Consensus FY26 revenue is $911M (implying +51% YoY); FY27 climbs to $1,282M (+41%). EPS consensus has FY27 near breakeven (-$0.04), but consensus has not pinned a specific year for sustainable profitability. This is the fundamental support for the BUY rating — analysts endorse the growth curve but think valuation has gotten ahead of it.
§ 08Valuation & Price Target
Price Target Methodology
Our $115 price target is built from a multi-method football-field synthesis, anchored primarily on the analyst consensus PT distribution:
| Methodology | Implied PT | Weight | Rationale |
|---|---|---|---|
| Analyst Consensus PT (Mean) | $103.91 | 40% | 16 analysts · primary anchor |
| Analyst Consensus PT (Median) | $110 | 15% | Outlier-resistant |
| EV/2027E Rev @ 50x (60% PL multiple) | $120 | 15% | "Above commercial-space high, lightly discounted" |
| EV/2027E Rev @ 55x | $135 | 10% | "Matched to current PL multiple" |
| High analyst PT / upside | $150 | 10% | Highly bullish |
| Low analyst PT / downside | $60 | 10% | Highly bearish |
| VM Genius 12M PT (Weighted) | $115 | 100% | — |
Scenario Analysis
| Scenario | Probability | 12M PT | Implied Return | Trigger |
|---|---|---|---|---|
| Bull | 25% | $170 | +18.7% | Neutron maiden flight clean + SDA T3 30%+ share win + Mynaric synergies realized |
| Base | 50% | $115 | -19.7% | Consensus scenario plays out; valuation normalizes toward 50x EV/27E Rev |
| Bear | 25% | $70 | -51.1% | Neutron maiden delay / failure + momentum-factor rotation |
Probability-weighted PT = 0.25 × $170 + 0.50 × $115 + 0.25 × $70 = $117.50. Implies a -17.9% return from the current $143.20. Even with upside scenarios baked in, expected return is negative.
§ 09Catalysts (with Real Dates)
| Date | Event | PT Impact | Source |
|---|---|---|---|
| 2026-08-06 | Q2 2026 earnings Consensus: Revenue $230M / EPS -$0.07 | ±$15 | Company release |
| 2026-11 (est) | Q3 2026 earnings Consensus: Revenue $234M / EPS -$0.06 | ±$10 | Consensus estimates |
| 2026 H2 | Neutron maiden flight (management guidance: H2 2026) | +$25 / -$30 | Company guidance |
| 2026 H2 | SDA Tranche 3 contract award (4 prime candidates) | +$10 / -$5 | SDA announcement |
| 2027 H1 | FY26 full results + FY27 guidance | ±$20 | — |
§ 10Limitations, Disclaimers & Disclosures
Disclosures
This research report was prepared by the VM Genius Equity Research team on 2026-05-26 from publicly available data. The covering analyst has no investment position in Rocket Lab Corporation. VM Genius has no investment banking relationship with Rocket Lab. All data was pulled via live financial-data interfaces but is not guaranteed to be error-free. All forward-looking statements carry material uncertainty. This report is for informational purposes only and does not constitute investment advice. Past performance is not indicative of future results.