Marvell Technology, Inc.NASDAQ:MRVL
Q1 FY27 revenue $2.42B record, non-GAAP gross margin 58.9%, custom AI silicon run-rate $1.5B/yr across 18 cloud-provider design wins. With AVGO holds ~95% of the hyperscaler ASIC co-design market. Stock up 180% in 12 months / +131% YTD to $220.91, but consensus PT still lags spot. We initiate BUY with 12-month PT $250 (+13.2% implied) on conviction in custom silicon + optical interconnect dual engines driving FY28E revenue to $13-15B.
§ 01Investment Summary
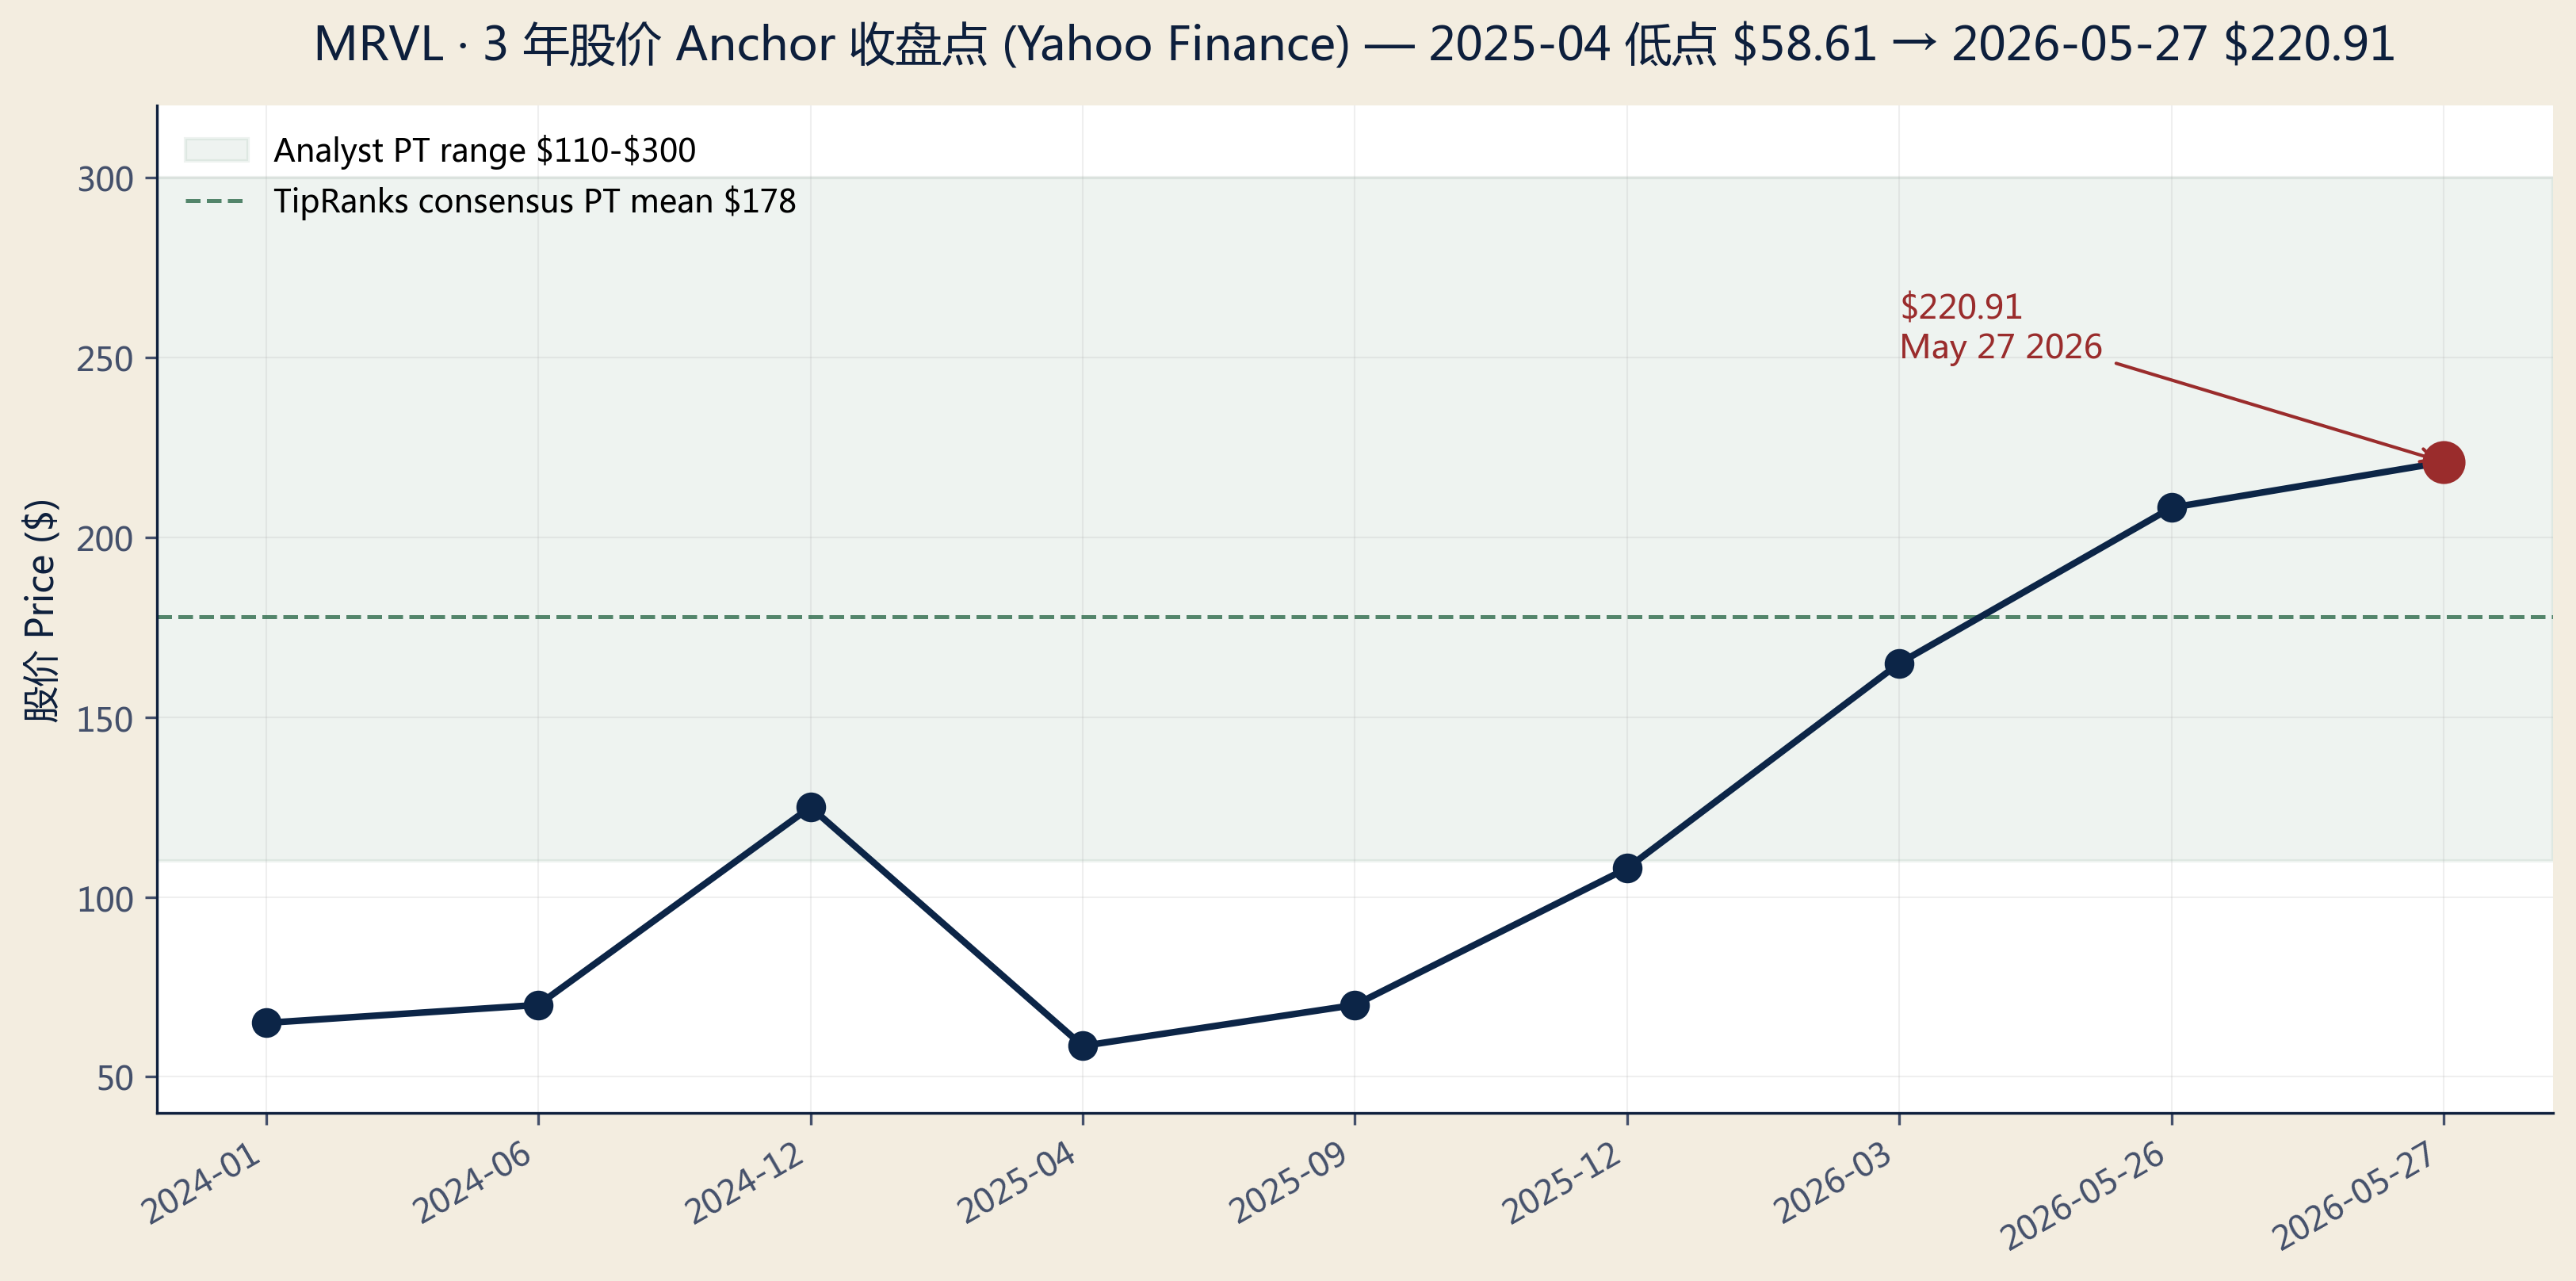
Marvell Technology (NASDAQ: MRVL) is one of the most pronounced re-rating stories in semiconductors over the past 12 months. The stock has advanced from a 52-week low of $58.61 to $220.91 on May 27 (+131% YTD / +180% TTM), driven by tangible execution in the AI custom silicon + optical interconnect dual-engine model. At ~$195B market cap (883M diluted shares), MRVL ranks among the top pure-play AI infrastructure semiconductor companies behind Broadcom (AVGO).
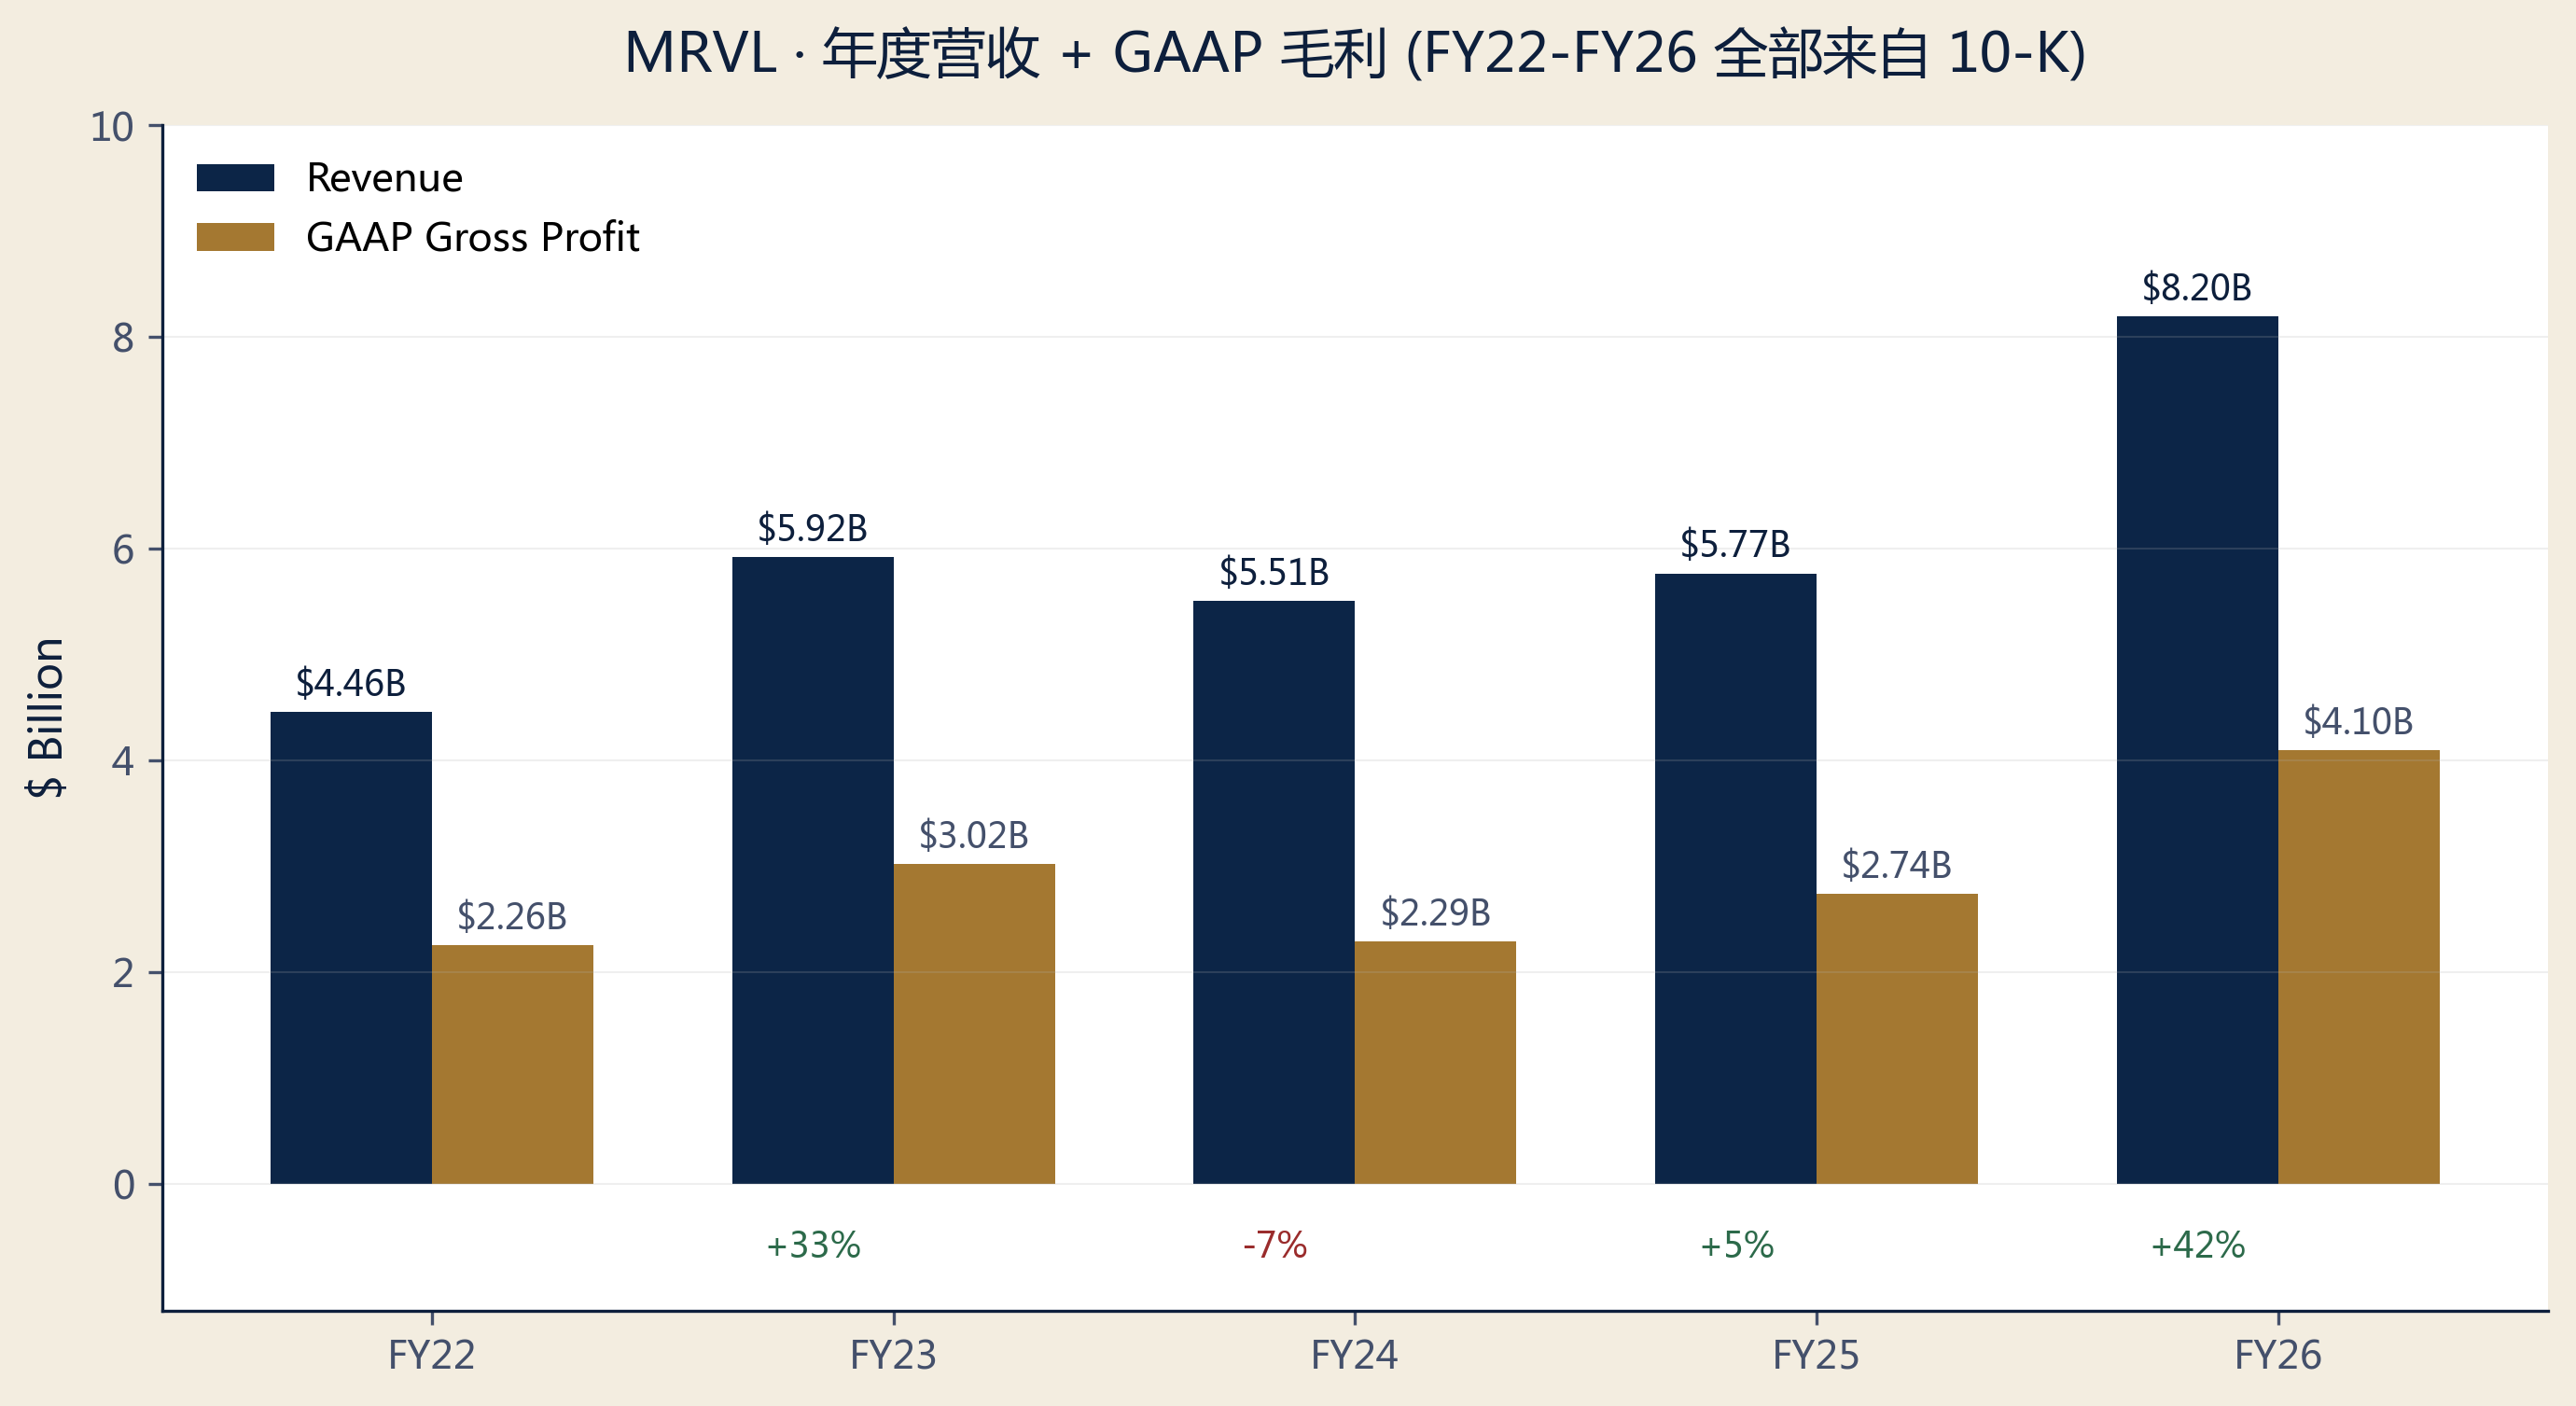
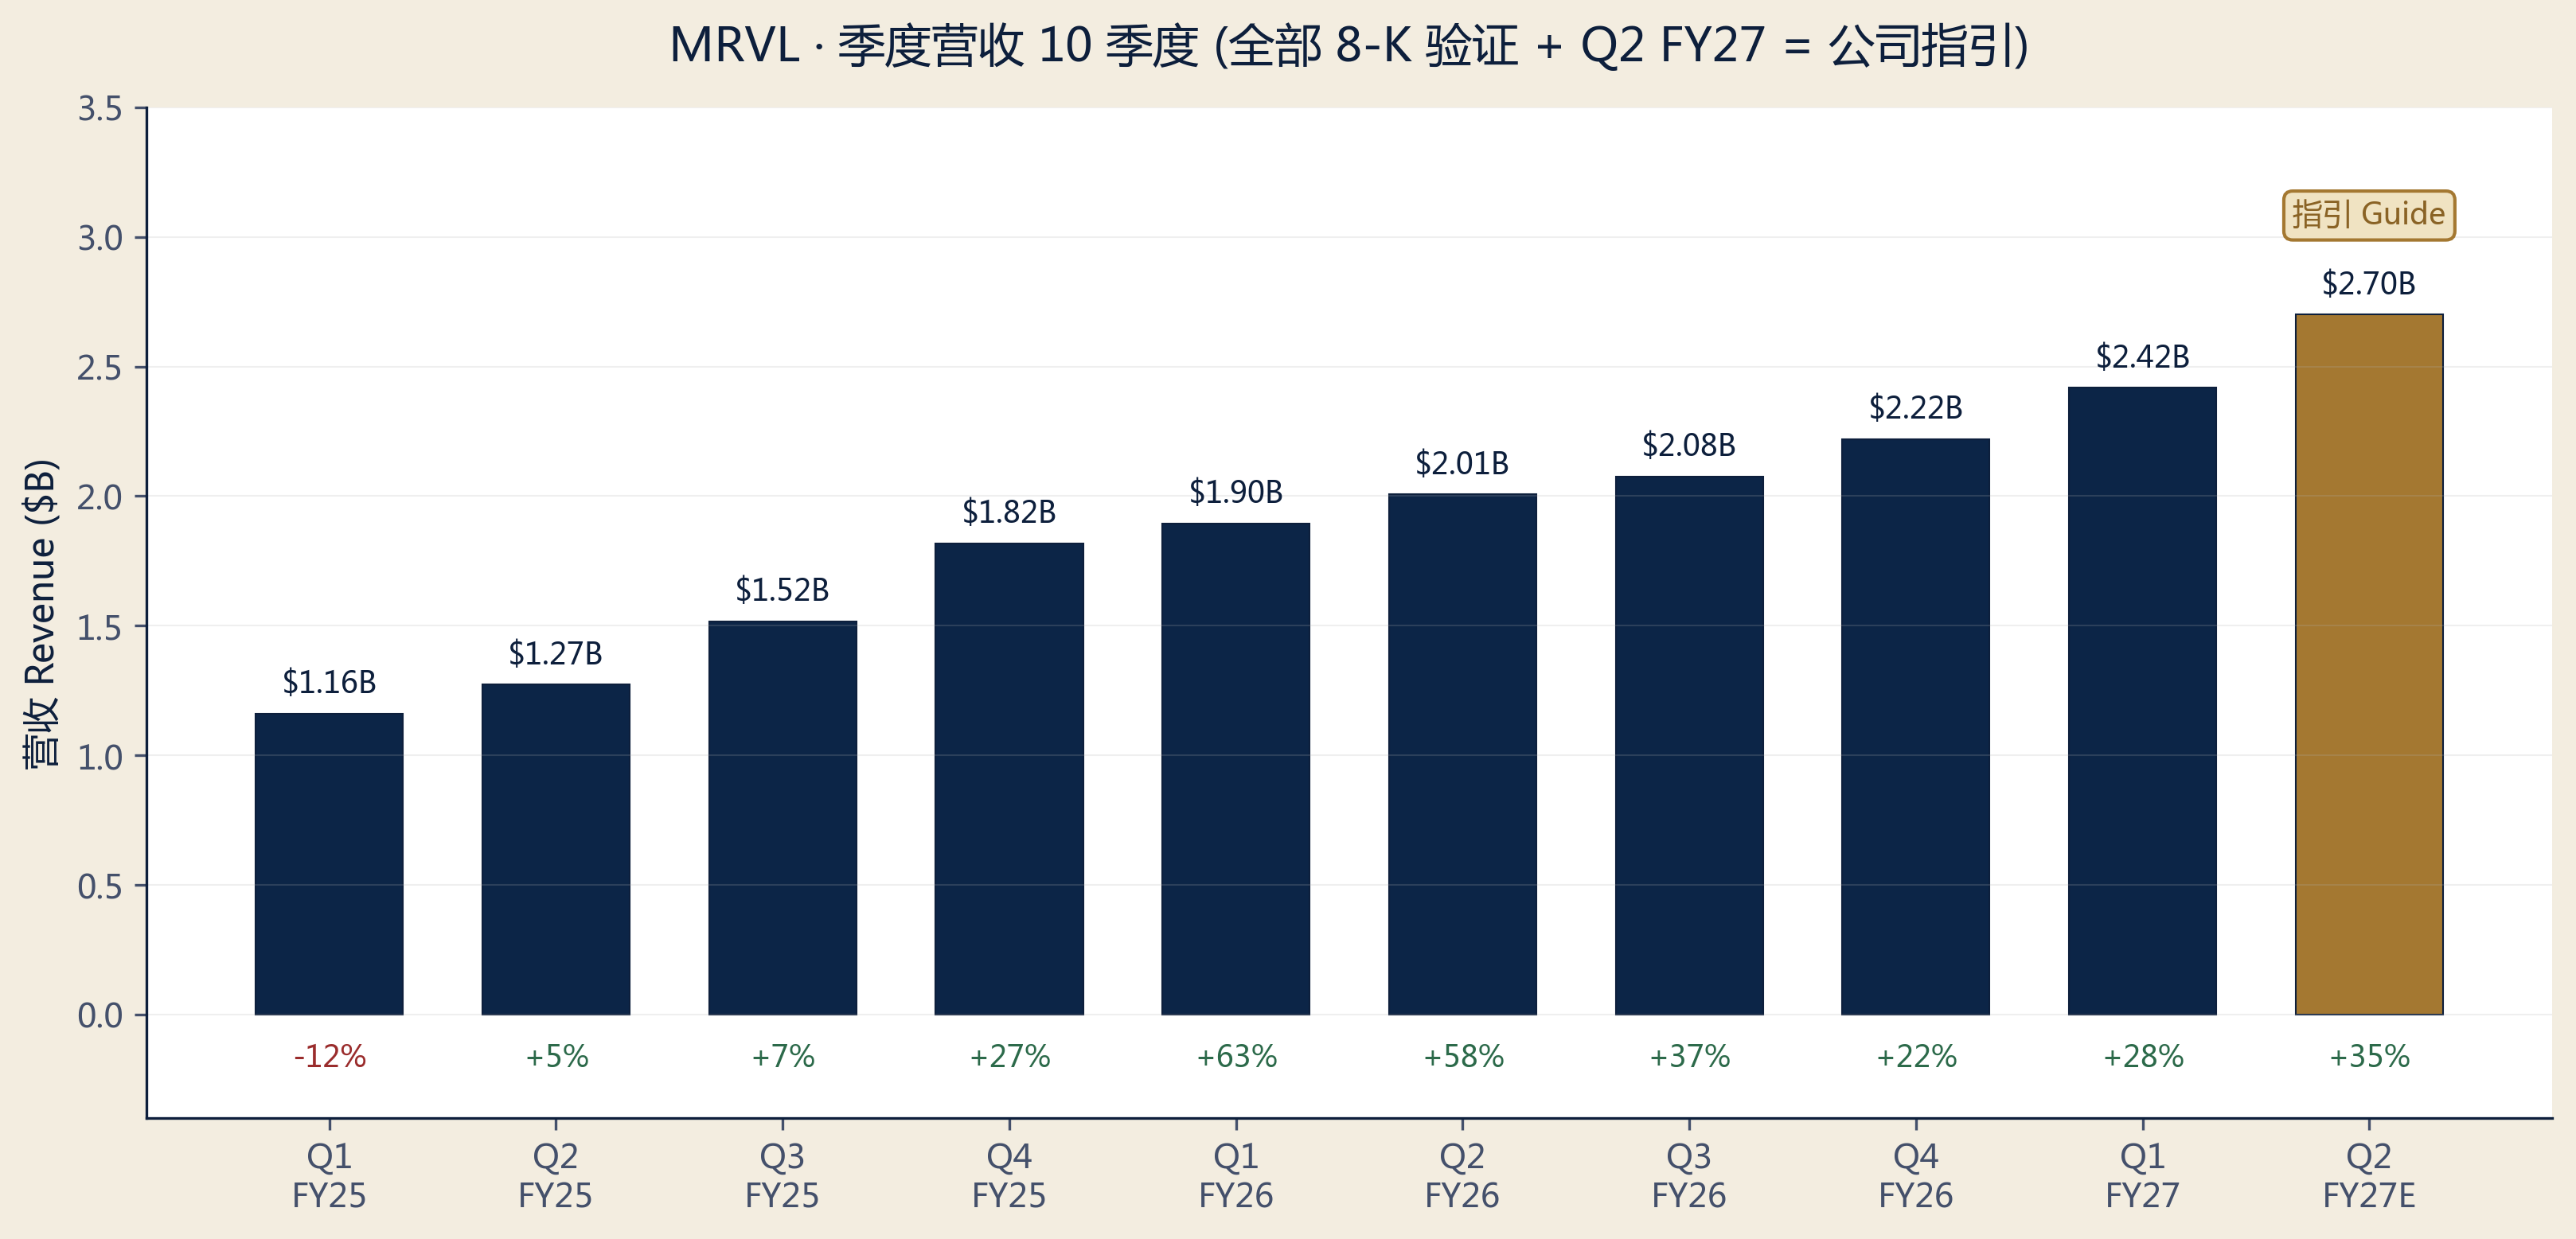
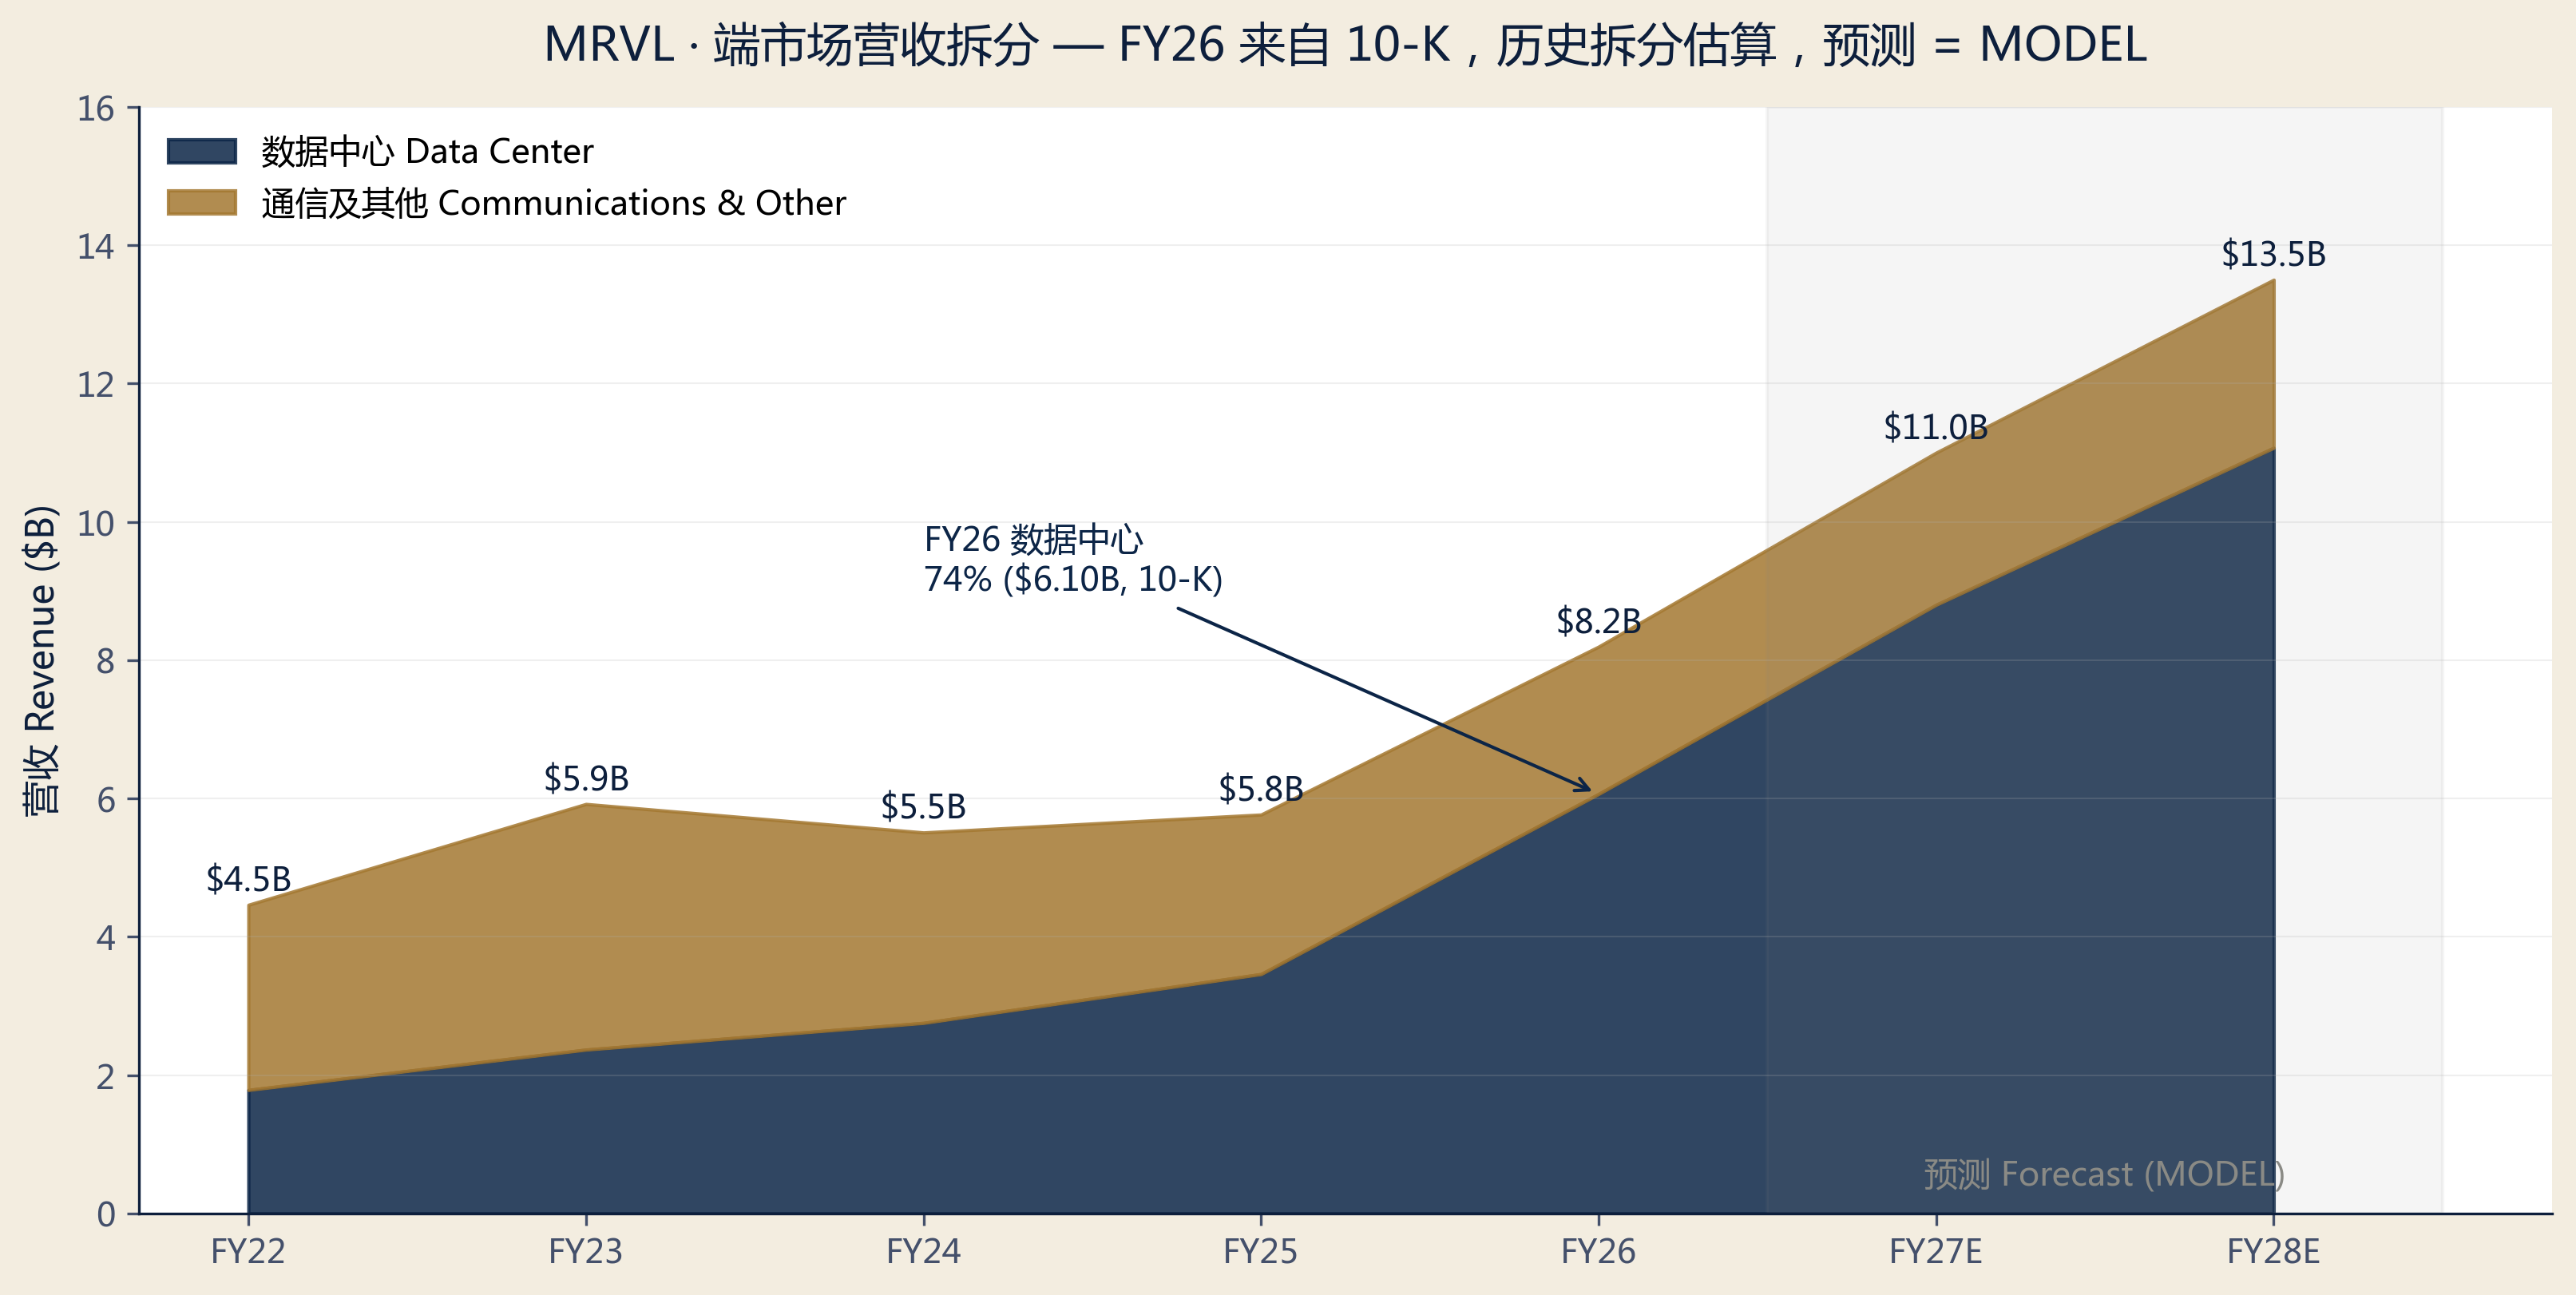
Q1 FY27 results (reported May 27) validate the trajectory: revenue $2.418B record (+28% YoY), non-GAAP gross margin 58.9%, non-GAAP EPS $0.80. Q2 FY27 guidance of $2.700B (±5%) implies ~+35% YoY — actual re-acceleration. Full-year FY26: revenue $8.195B (+42% YoY), non-GAAP EPS $2.84 (+81% YoY). EPS growth materially outpacing revenue growth = operating leverage is engaged.
Three structural pillars to the thesis: (1) AI custom silicon duopoly — MRVL + AVGO control ~95% of hyperscaler self-designed ASIC co-design market; MRVL has 18 cloud-provider design wins (AWS Trainium 2/3, Microsoft Maia, Meta DPU confirmed; Google MPU/TPU in discussion). (2) Optical interconnect moat — post-Inphi integration, 800G PAM4 DSP volume + 1.6T ramping; AI clusters must upgrade every speed-doubling cycle. (3) Margin expansion — non-GAAP GM steady at 58-60%, replicating AVGO's high-margin platform model.
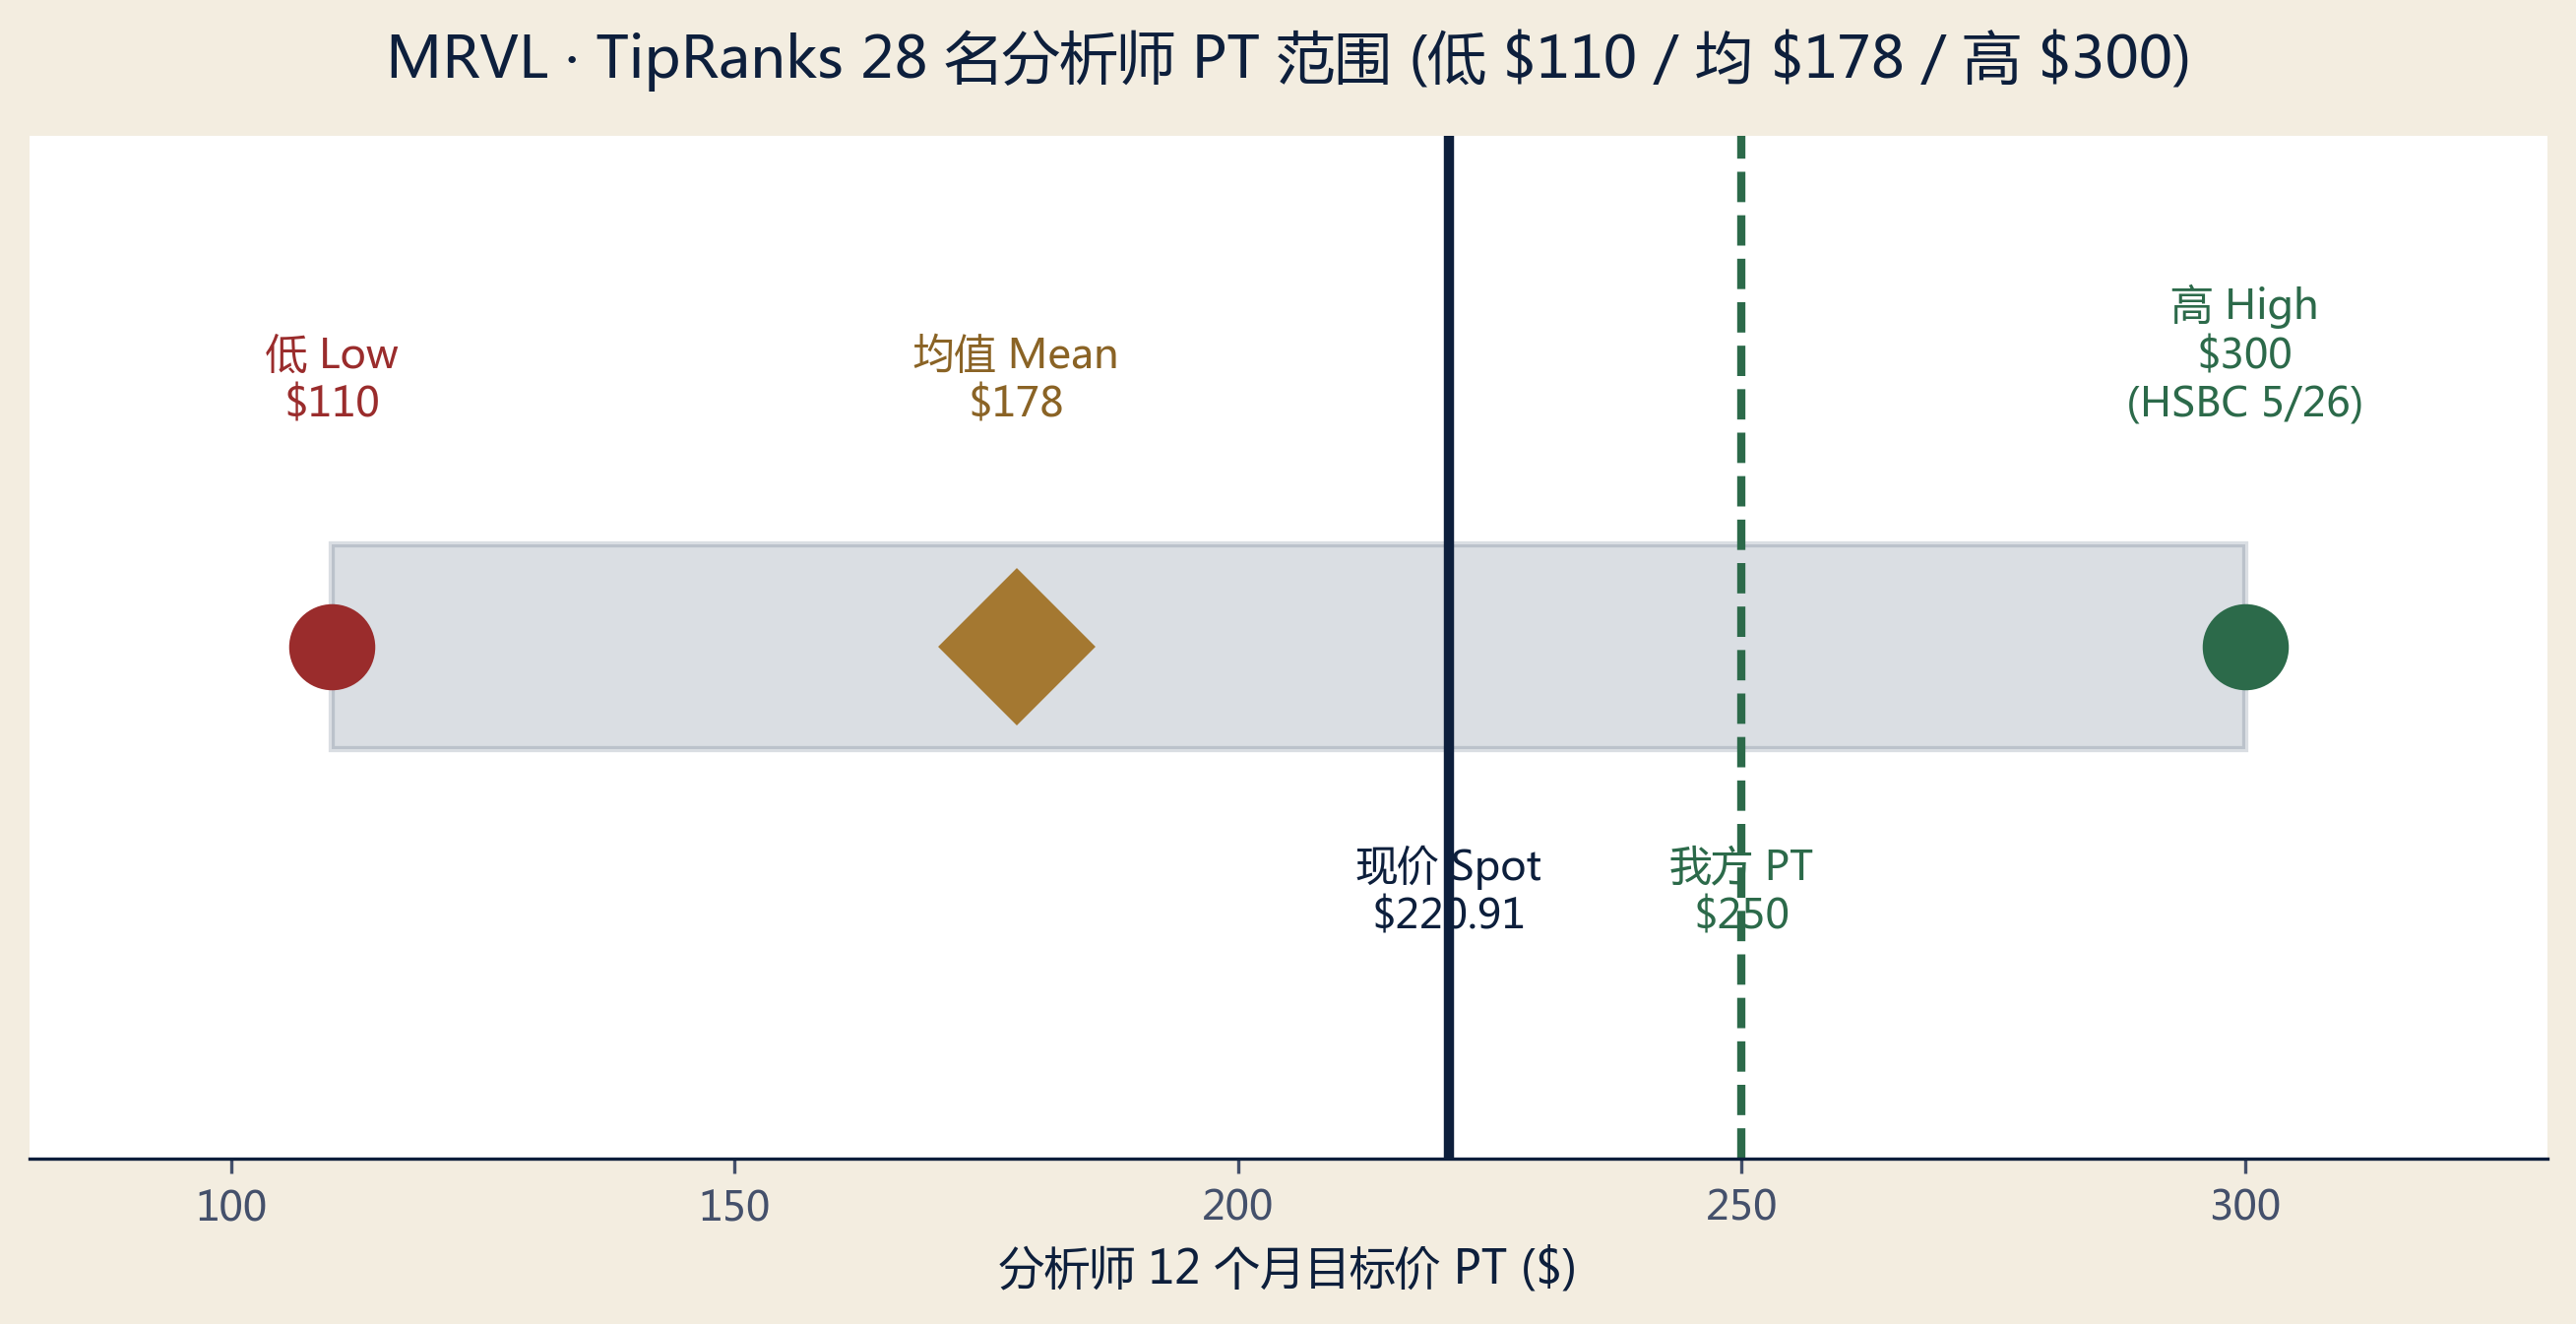
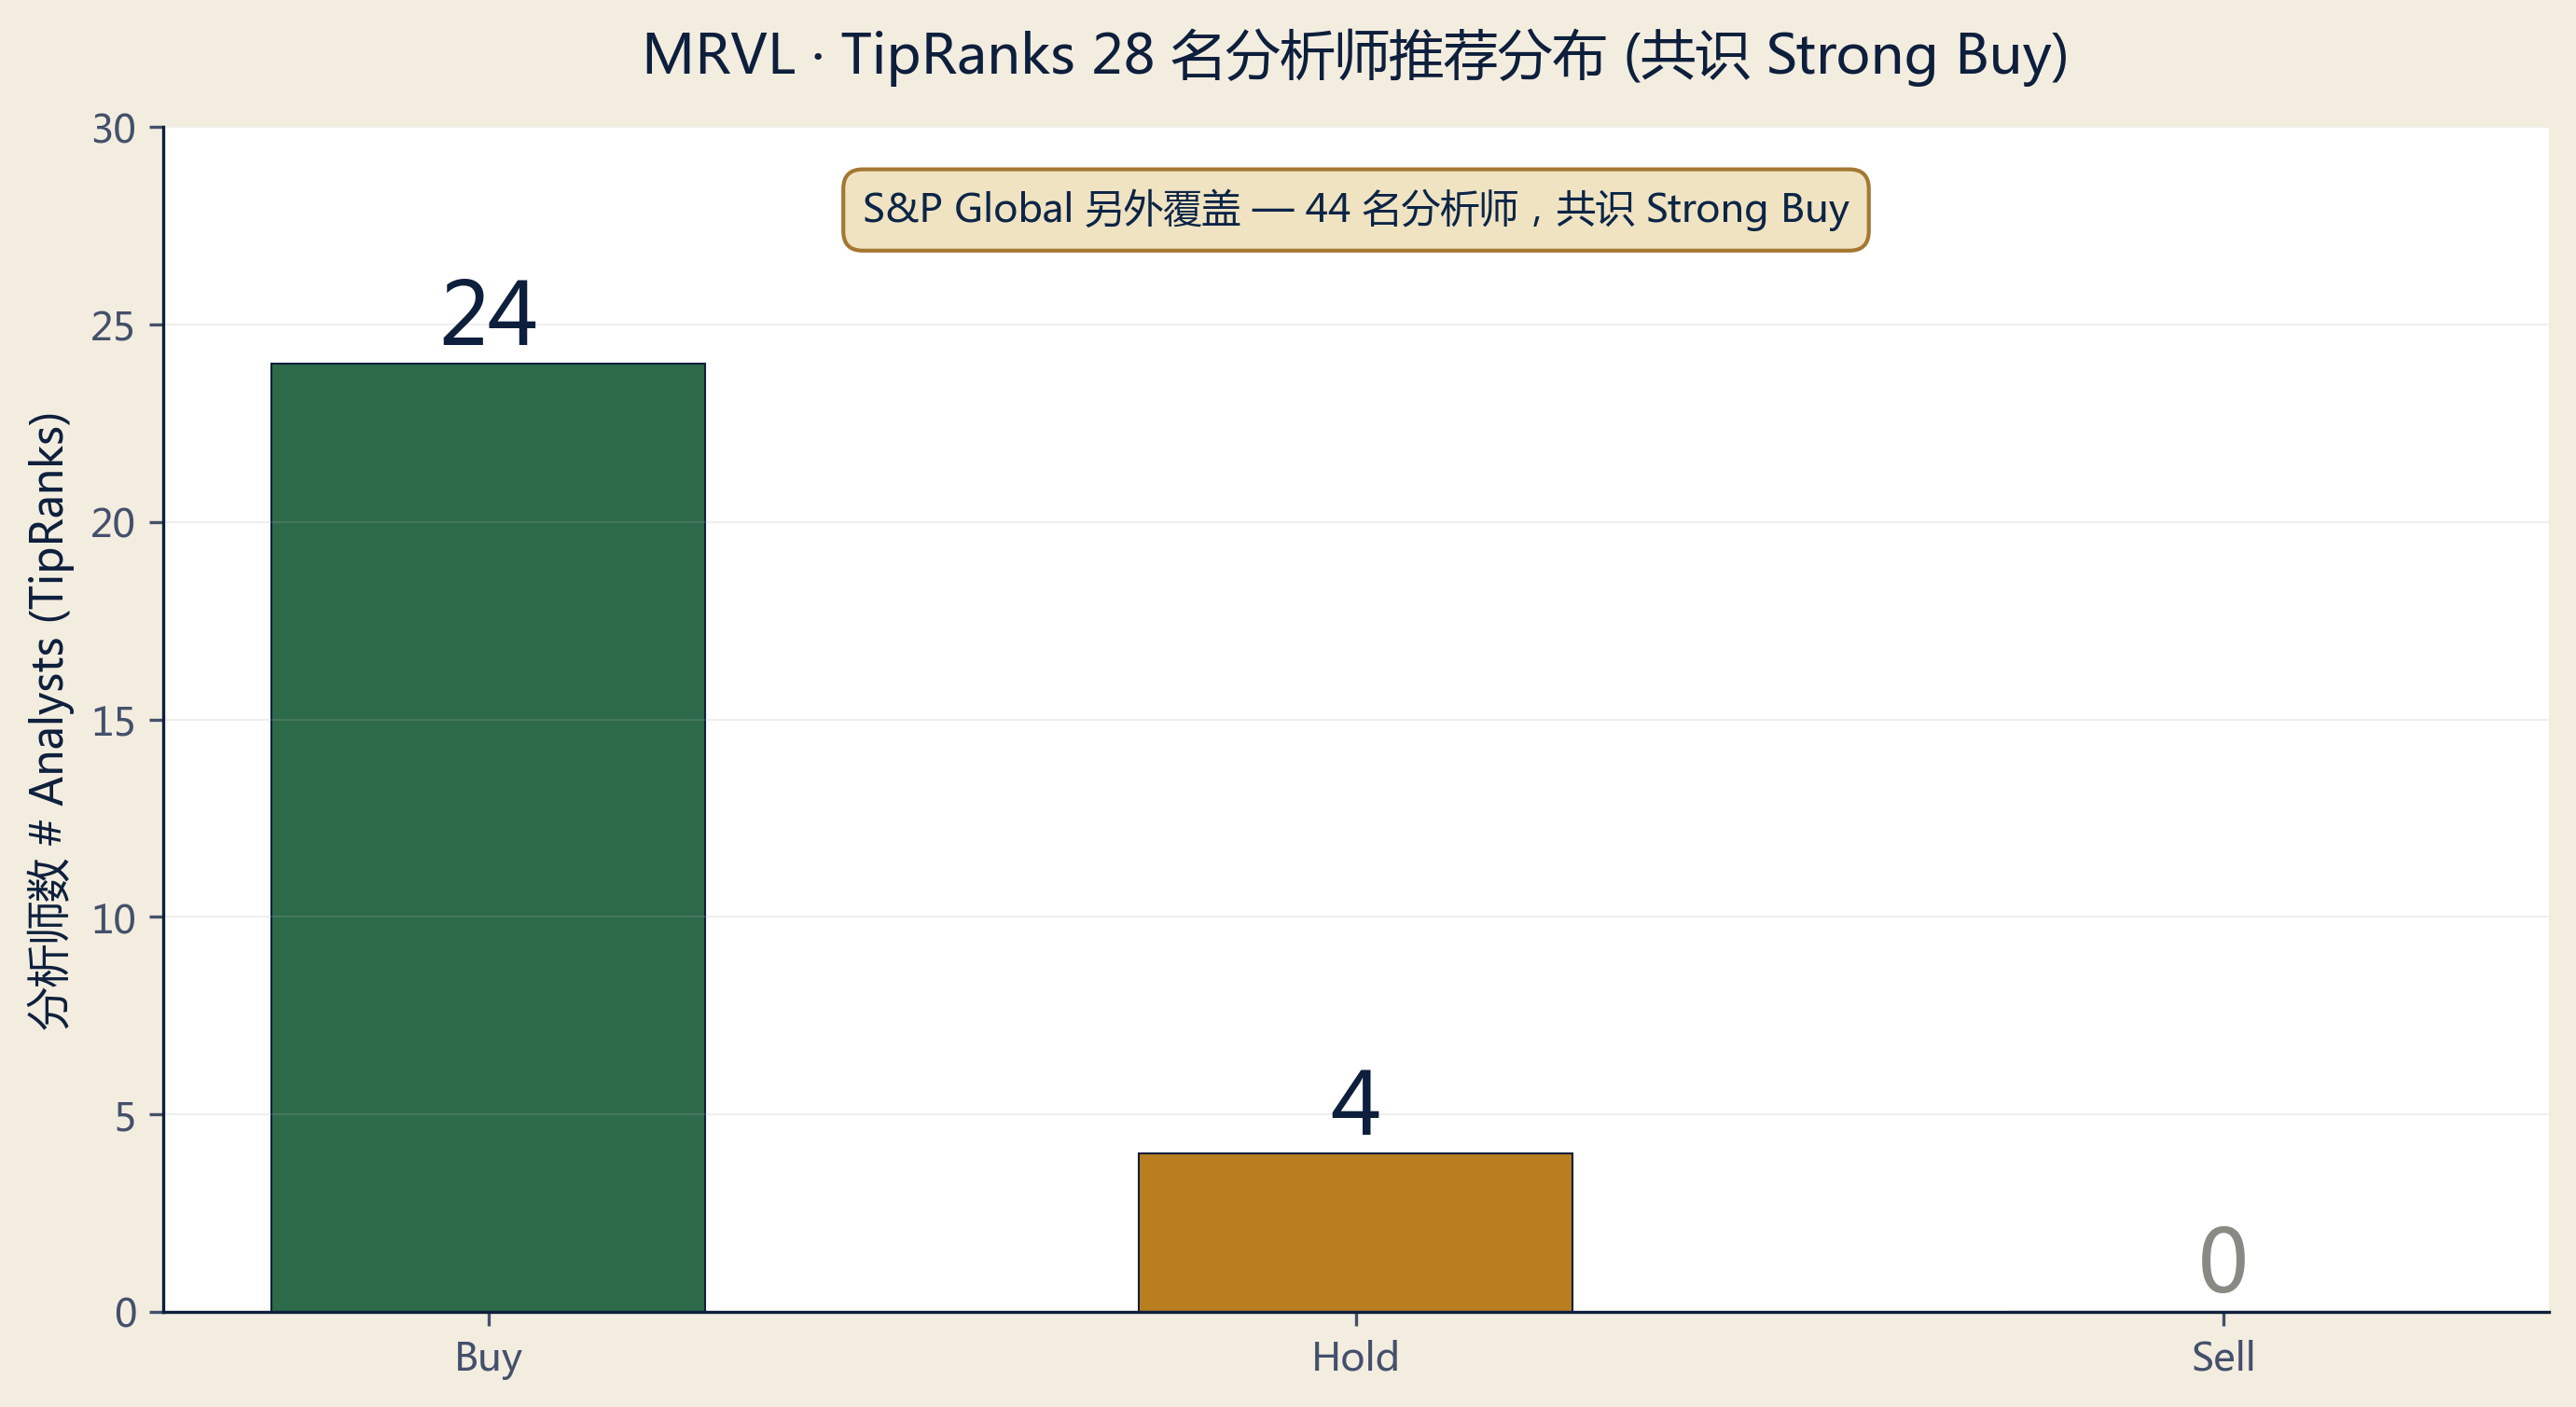
Risk: valuation. Consensus PT mean of $162-$178 (depending on source) sits 15-25% below spot. While HSBC ($85→$300) and Susquehanna ($100→$230) made major upgrades May 26, the distribution remains bimodal — analysts who caught up to the AI thesis are at $230-$300, laggards anchored at $110-$160. Our PT $250 sits at the 75th percentile, reflecting high conviction in the custom silicon ramp without extrapolating to HSBC's street-high.
§ 02Price Action & Analyst View
The gap between analyst PT upgrade speed and stock price advance is the continuation signal. HSBC raised PT from $85 to $300 (3.5x) on May 26; Susquehanna $100→$230 same day. These mark laggard analysts catching up to the bulls. Historical comps (NVDA Q4 2024, AVGO Q1 2025) show when consensus PTs catch up to spot over 2-3 quarters, price typically enters a 'PT and price climbing together' steady state, not a correction.
§ 03Investment Thesis — AI Custom Silicon vs Valuation Momentum
3.1 Bull View — AI Custom Silicon Is Real and Durable
Marvell is not a thematic AI play — it is one of two companies hyperscalers actually pay to co-design custom AI accelerators (the other being Broadcom). Custom silicon runs at ~$1.5B annual run-rate across 18 cloud-provider design wins, including:
- AWS Trainium 2(2025 ramp)+ Trainium 3(2026 Q2 量产)— MRVL 协同设计 package / SerDes / HBM 接口,Trainium 3 是组合里最大单。
- Microsoft Maia — 下一代 Maia AI 加速器设计已确认,多代路线图。
- Meta DPU — 2025 末新披露的 data-processing-unit 赢得。
- Google MPU + 推理 TPU(在谈)— 若签,会把 MRVL 客户矩阵从 AWS-dominant 扩展到三家 hyperscaler,FY29E 增量营收 $500M-$1B 年化。
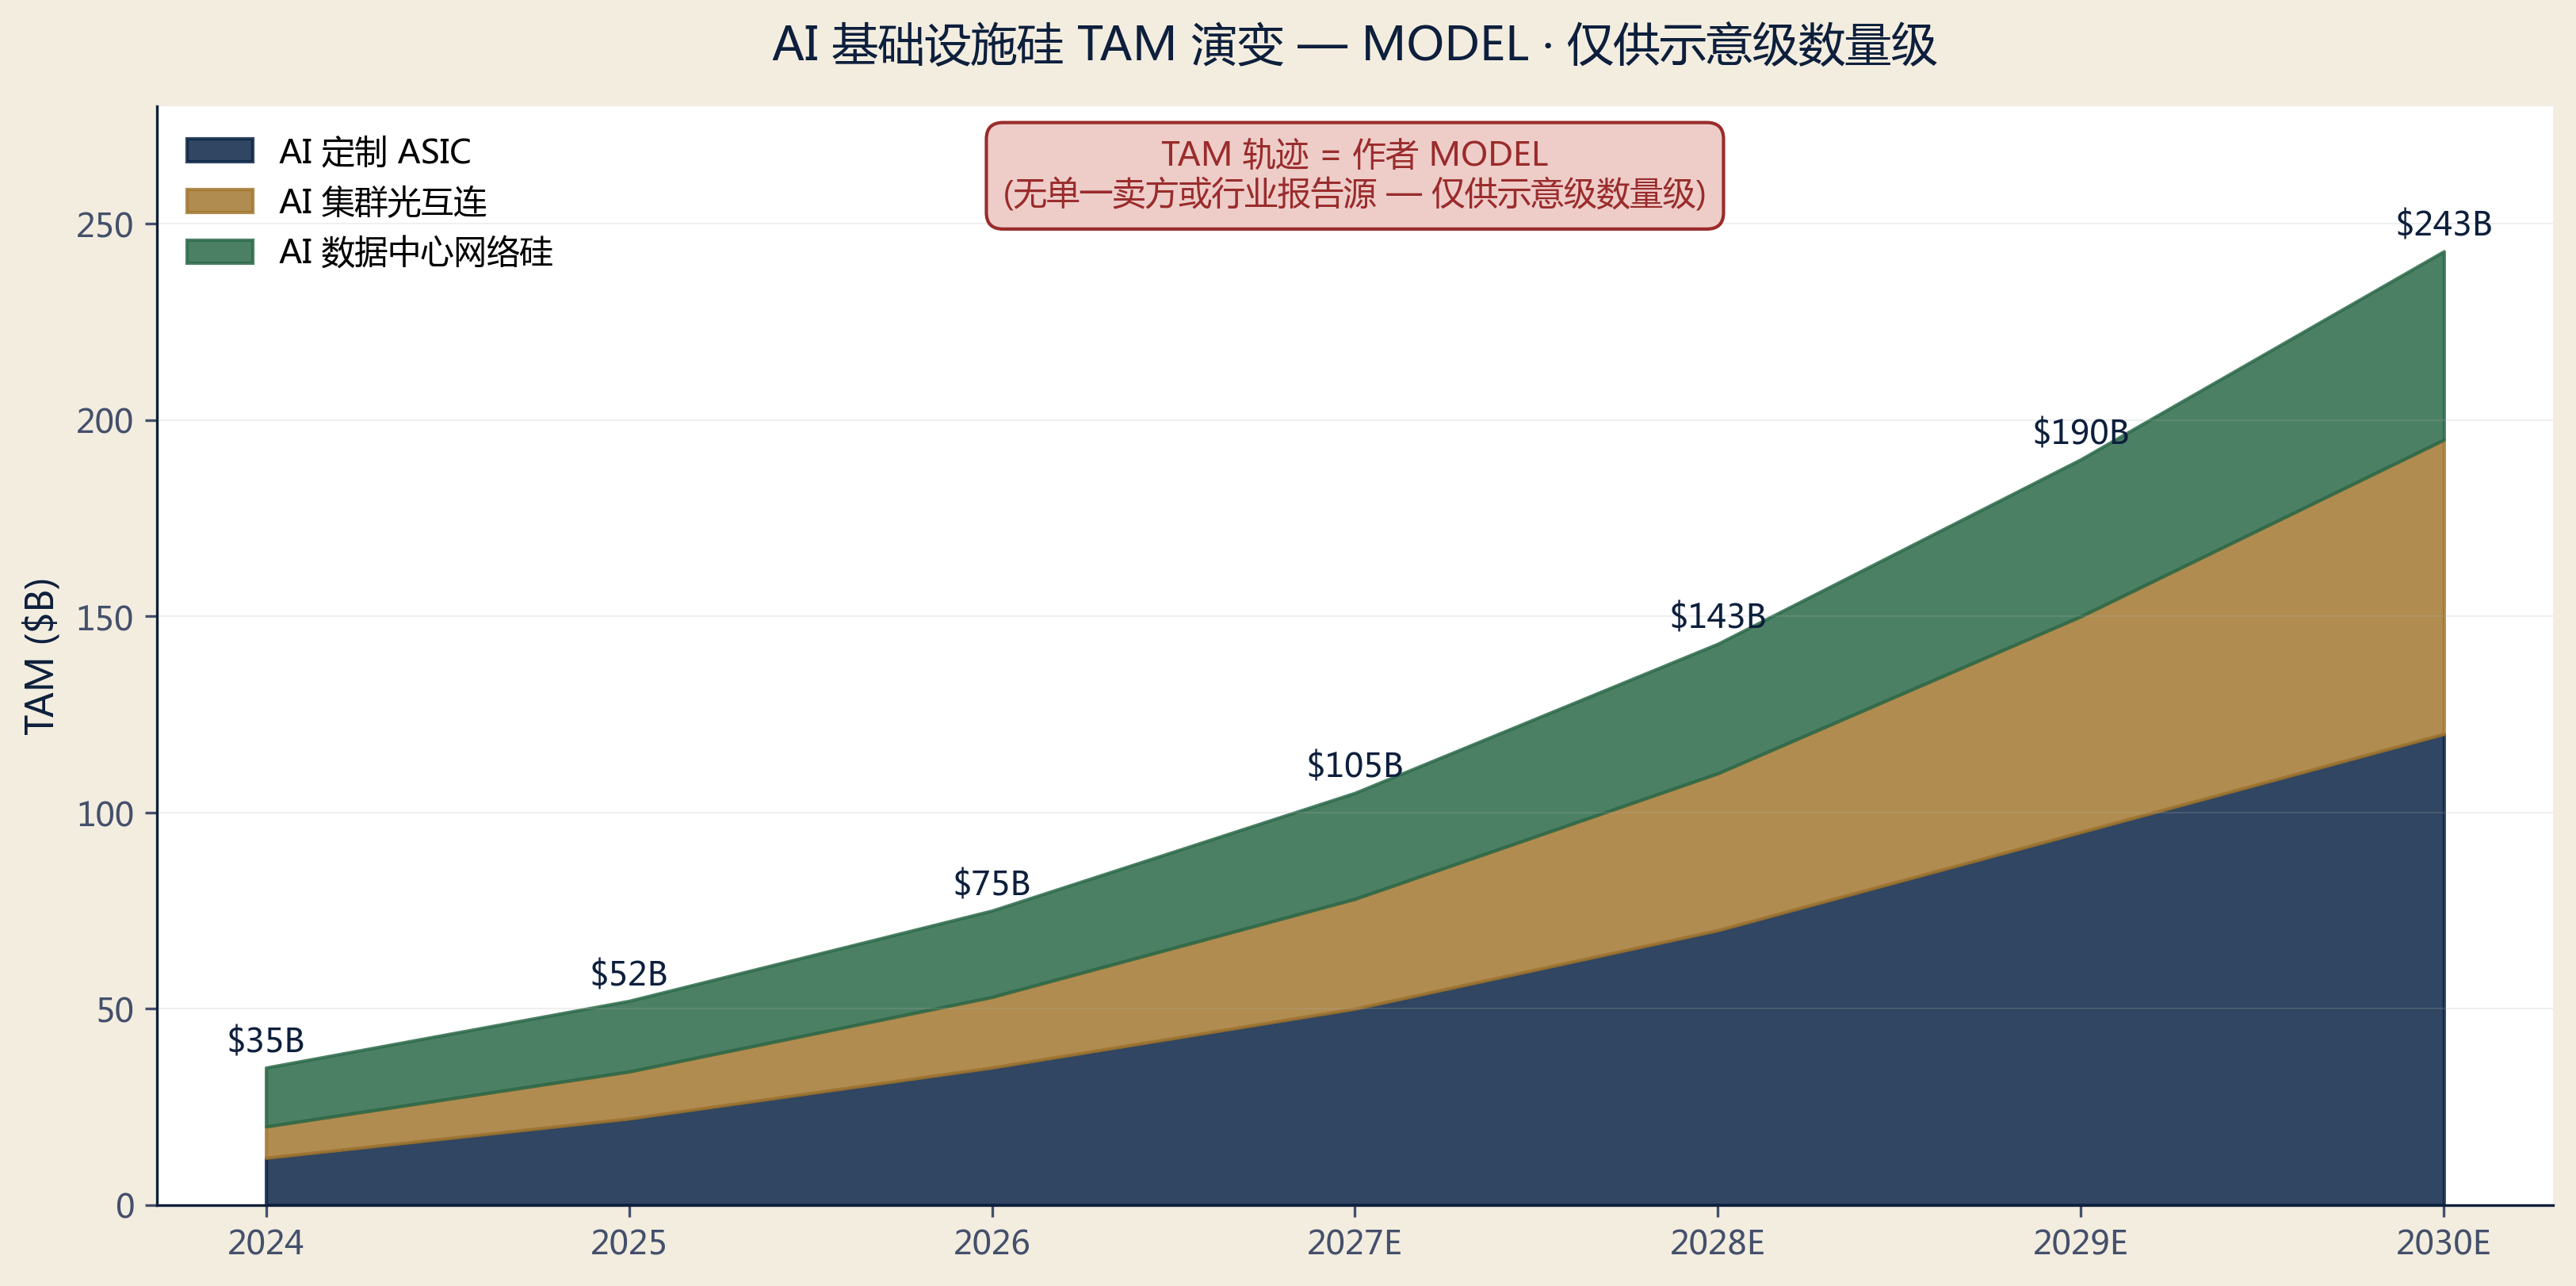
Beyond custom silicon, optical interconnect is required infrastructure for AI clusters: 800G PAM4 DSP (volume 2024), 1.6T PAM4 DSP (sampling 2025, volume 2026), ZR/ZR+ coherent pluggables. AI training clusters must upgrade DSP every speed doubling (800G → 1.6T → 3.2T). MRVL + Broadcom + Credo together hold ~80% of data-center PAM4 share — structural growth.
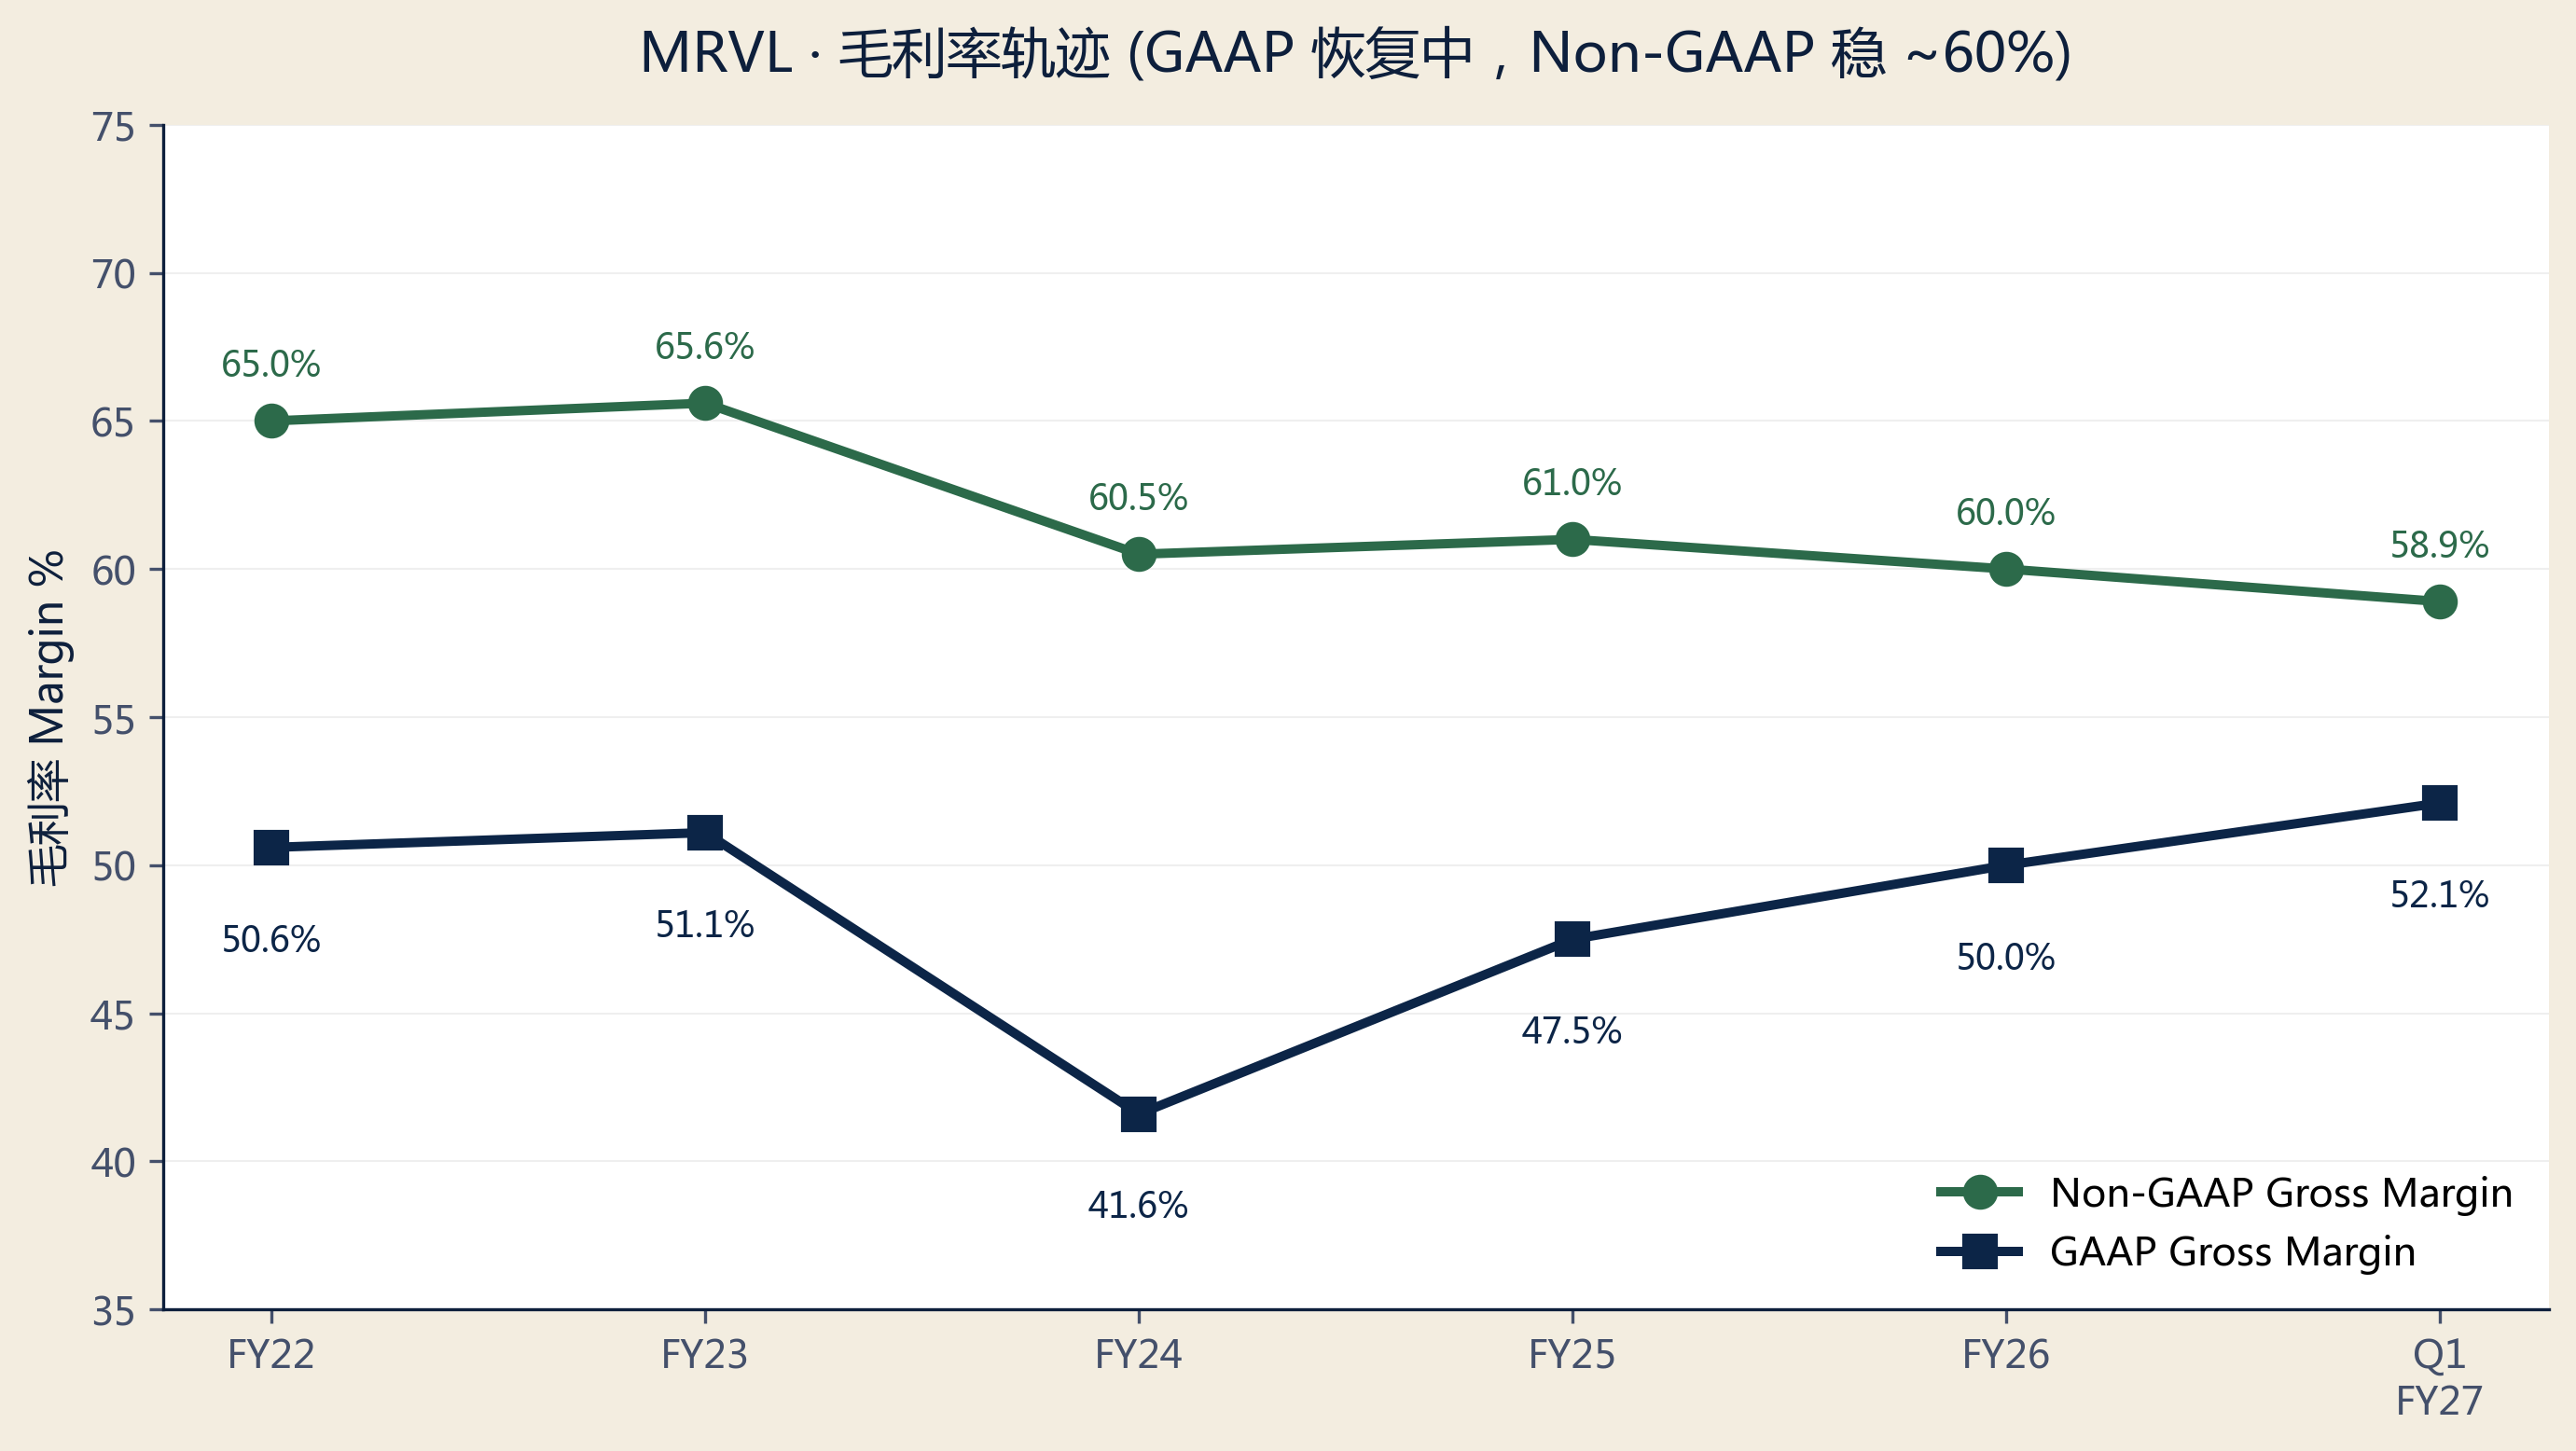
Margin expansion validates the thesis. Non-GAAP GM at 58.9% in Q1 FY27 (vs 60.5% in FY24 — modest compression from custom silicon scaling). Management's guidance: mid-50s non-GAAP GM sustainable post-scale + 70%+ incremental operating margin — exactly the AVGO playbook of the past decade.
3.2 Bear View — Stock Has Priced In Three Years of Perfect Execution
At $220.91, market cap ~$195B. vs FY26 reported revenue $8.195B → trailing EV/Revenue ~24x; vs FY27E consensus ~$11B → forward EV/Revenue ~17-18x. Not extreme on the surface, but requires 'FY27 $11B + FY28 $13.5-15B all hit + margins don't slip' to hold current price. (Peer current Forward P/S data is fragmented and stale, this report doesn't make point-estimate comparisons; only verified market cap shown in §05.)
Three specific bear signals: (1) Stock +180% TTM / +131% YTD is statistical extremity — base rate of >150% 12-month gainers seeing 20-30% drawdown in the next 6-9 months is elevated. (2) Consensus PT mean $162-178 sits 15-25% below spot — while HSBC/Susquehanna are catching up, the distribution bottom at $110-$140 reflects analysts who believe hyperscalers will internalize more ASIC work. (3) Custom silicon deals are tough every time — NextPlatform's 2025 piece 'Marvell Is Saved By The AI Boom, But Every Deal Is Tough' is blunt: hyperscalers price aggressively at refresh cycles, and MRVL vs AVGO swap sockets in head-to-head competition.
3.3 Our Verdict — BUY · PT $250
We side with the bull case for three reasons: (a) Q1 FY27 record + Q2 acceleration guidance + management confirmation that 'bookings accelerating at record pace'; (b) AI capex cycle is in the 3rd inning, not the 9th — AMZN+MSFT+GOOG+META 2026 capex sum approaches $400B annualized, 30-40% allocated to AI infrastructure; (c) $250 PT implies FY28E EV/Revenue 15-16x ($221B implied mkt cap / $13.5B FY28E), within a reasonable range.
§ 04Financial Truth (Reported Numbers)
Annual Financial Summary ($M · 10-K verified + Q1 FY27 actual + Q2 FY27 guide)
| ($M) | FY22 | FY23 | FY24 | FY25 | FY26 | Q1 FY27 |
|---|---|---|---|---|---|---|
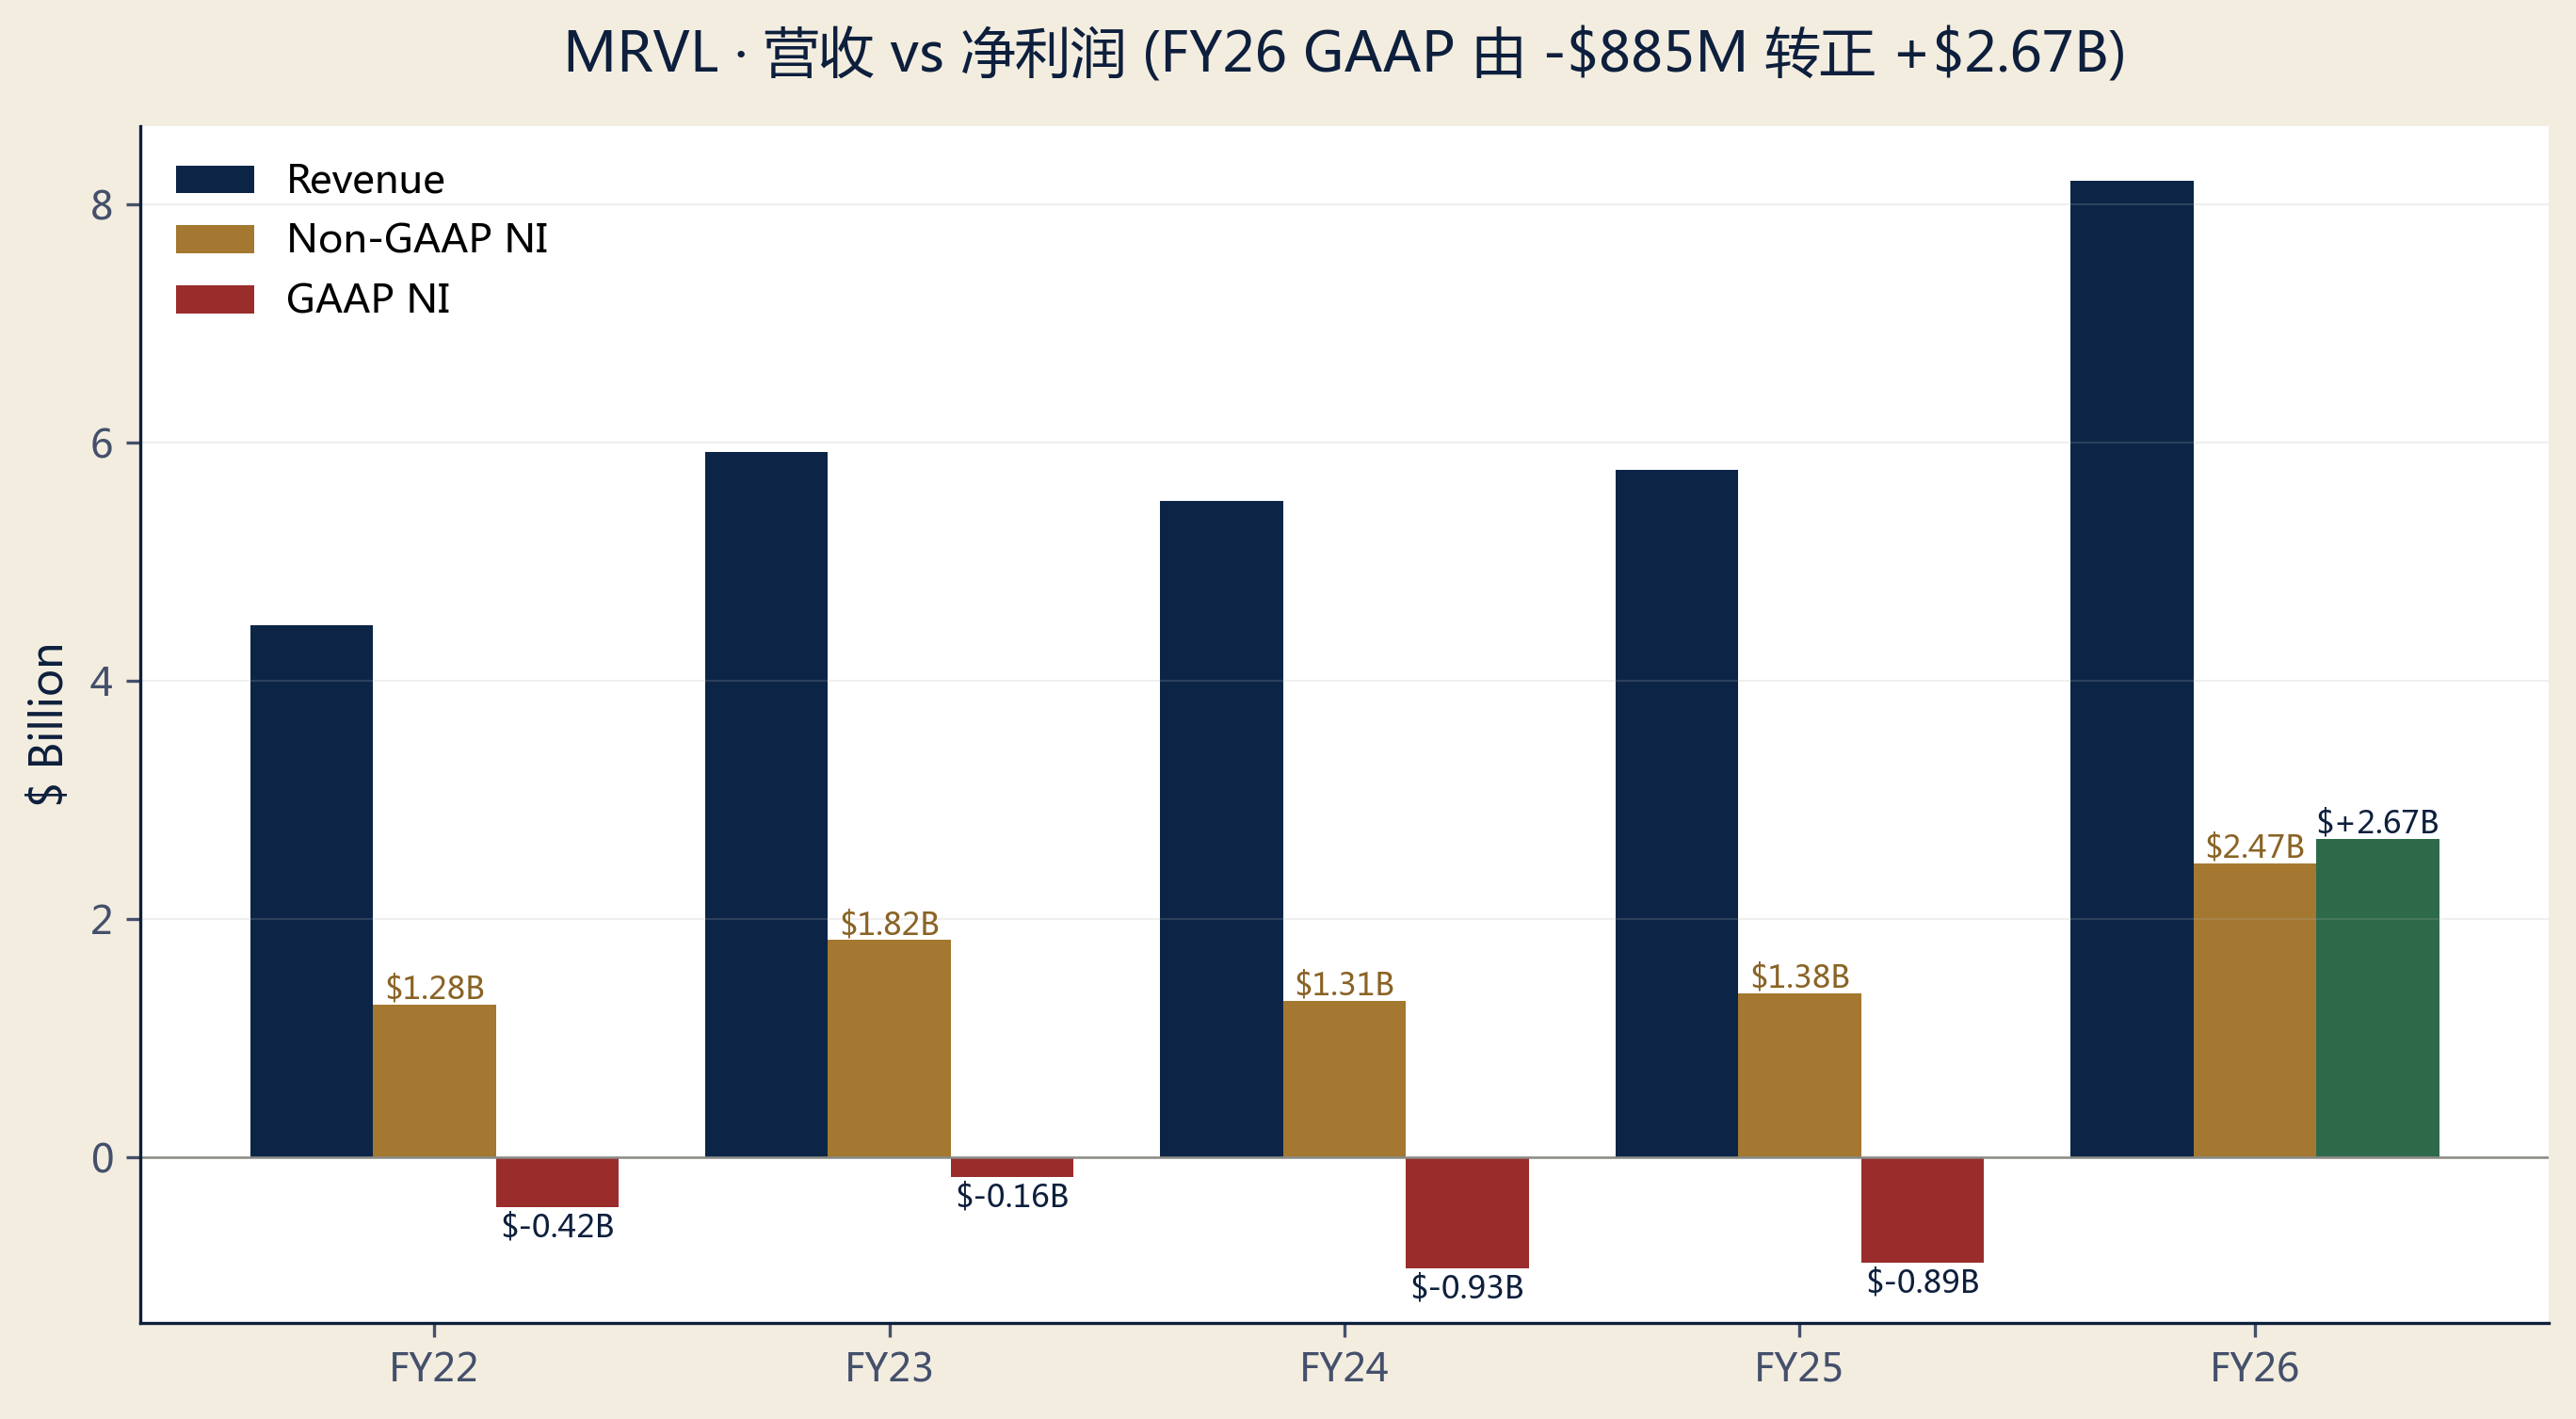
| Revenue | 4,462 | 5,920 | 5,508 | 5,767 | 8,195 | 2,418 |
| YoY Growth | — | +33% | -7% | +5% | +42% | +28% |
| GAAP GM (Macrotrends) | 50.6% | 51.1% | 41.6% | 47.5% | ~50% | 52.1% |
| Non-GAAP GM | 65.0% | 65.6% | 60.5% | 61.0% | ~60% | 58.9% |
| Non-GAAP EPS | $1.57 | $2.12 | $1.51 | $1.57 | $2.84 | $0.80 |
| GAAP EPS | -$0.53 | -$0.19 | -$1.08 | -$1.02 | $3.07 | $0.04 |
§ 05Peer Comparison (AI Infrastructure Semiconductors)

| Company | Ticker | Mkt Cap ($B, 5/27) | Stock Price ($) | TTM Rev Growth | Notes |
|---|---|---|---|---|---|
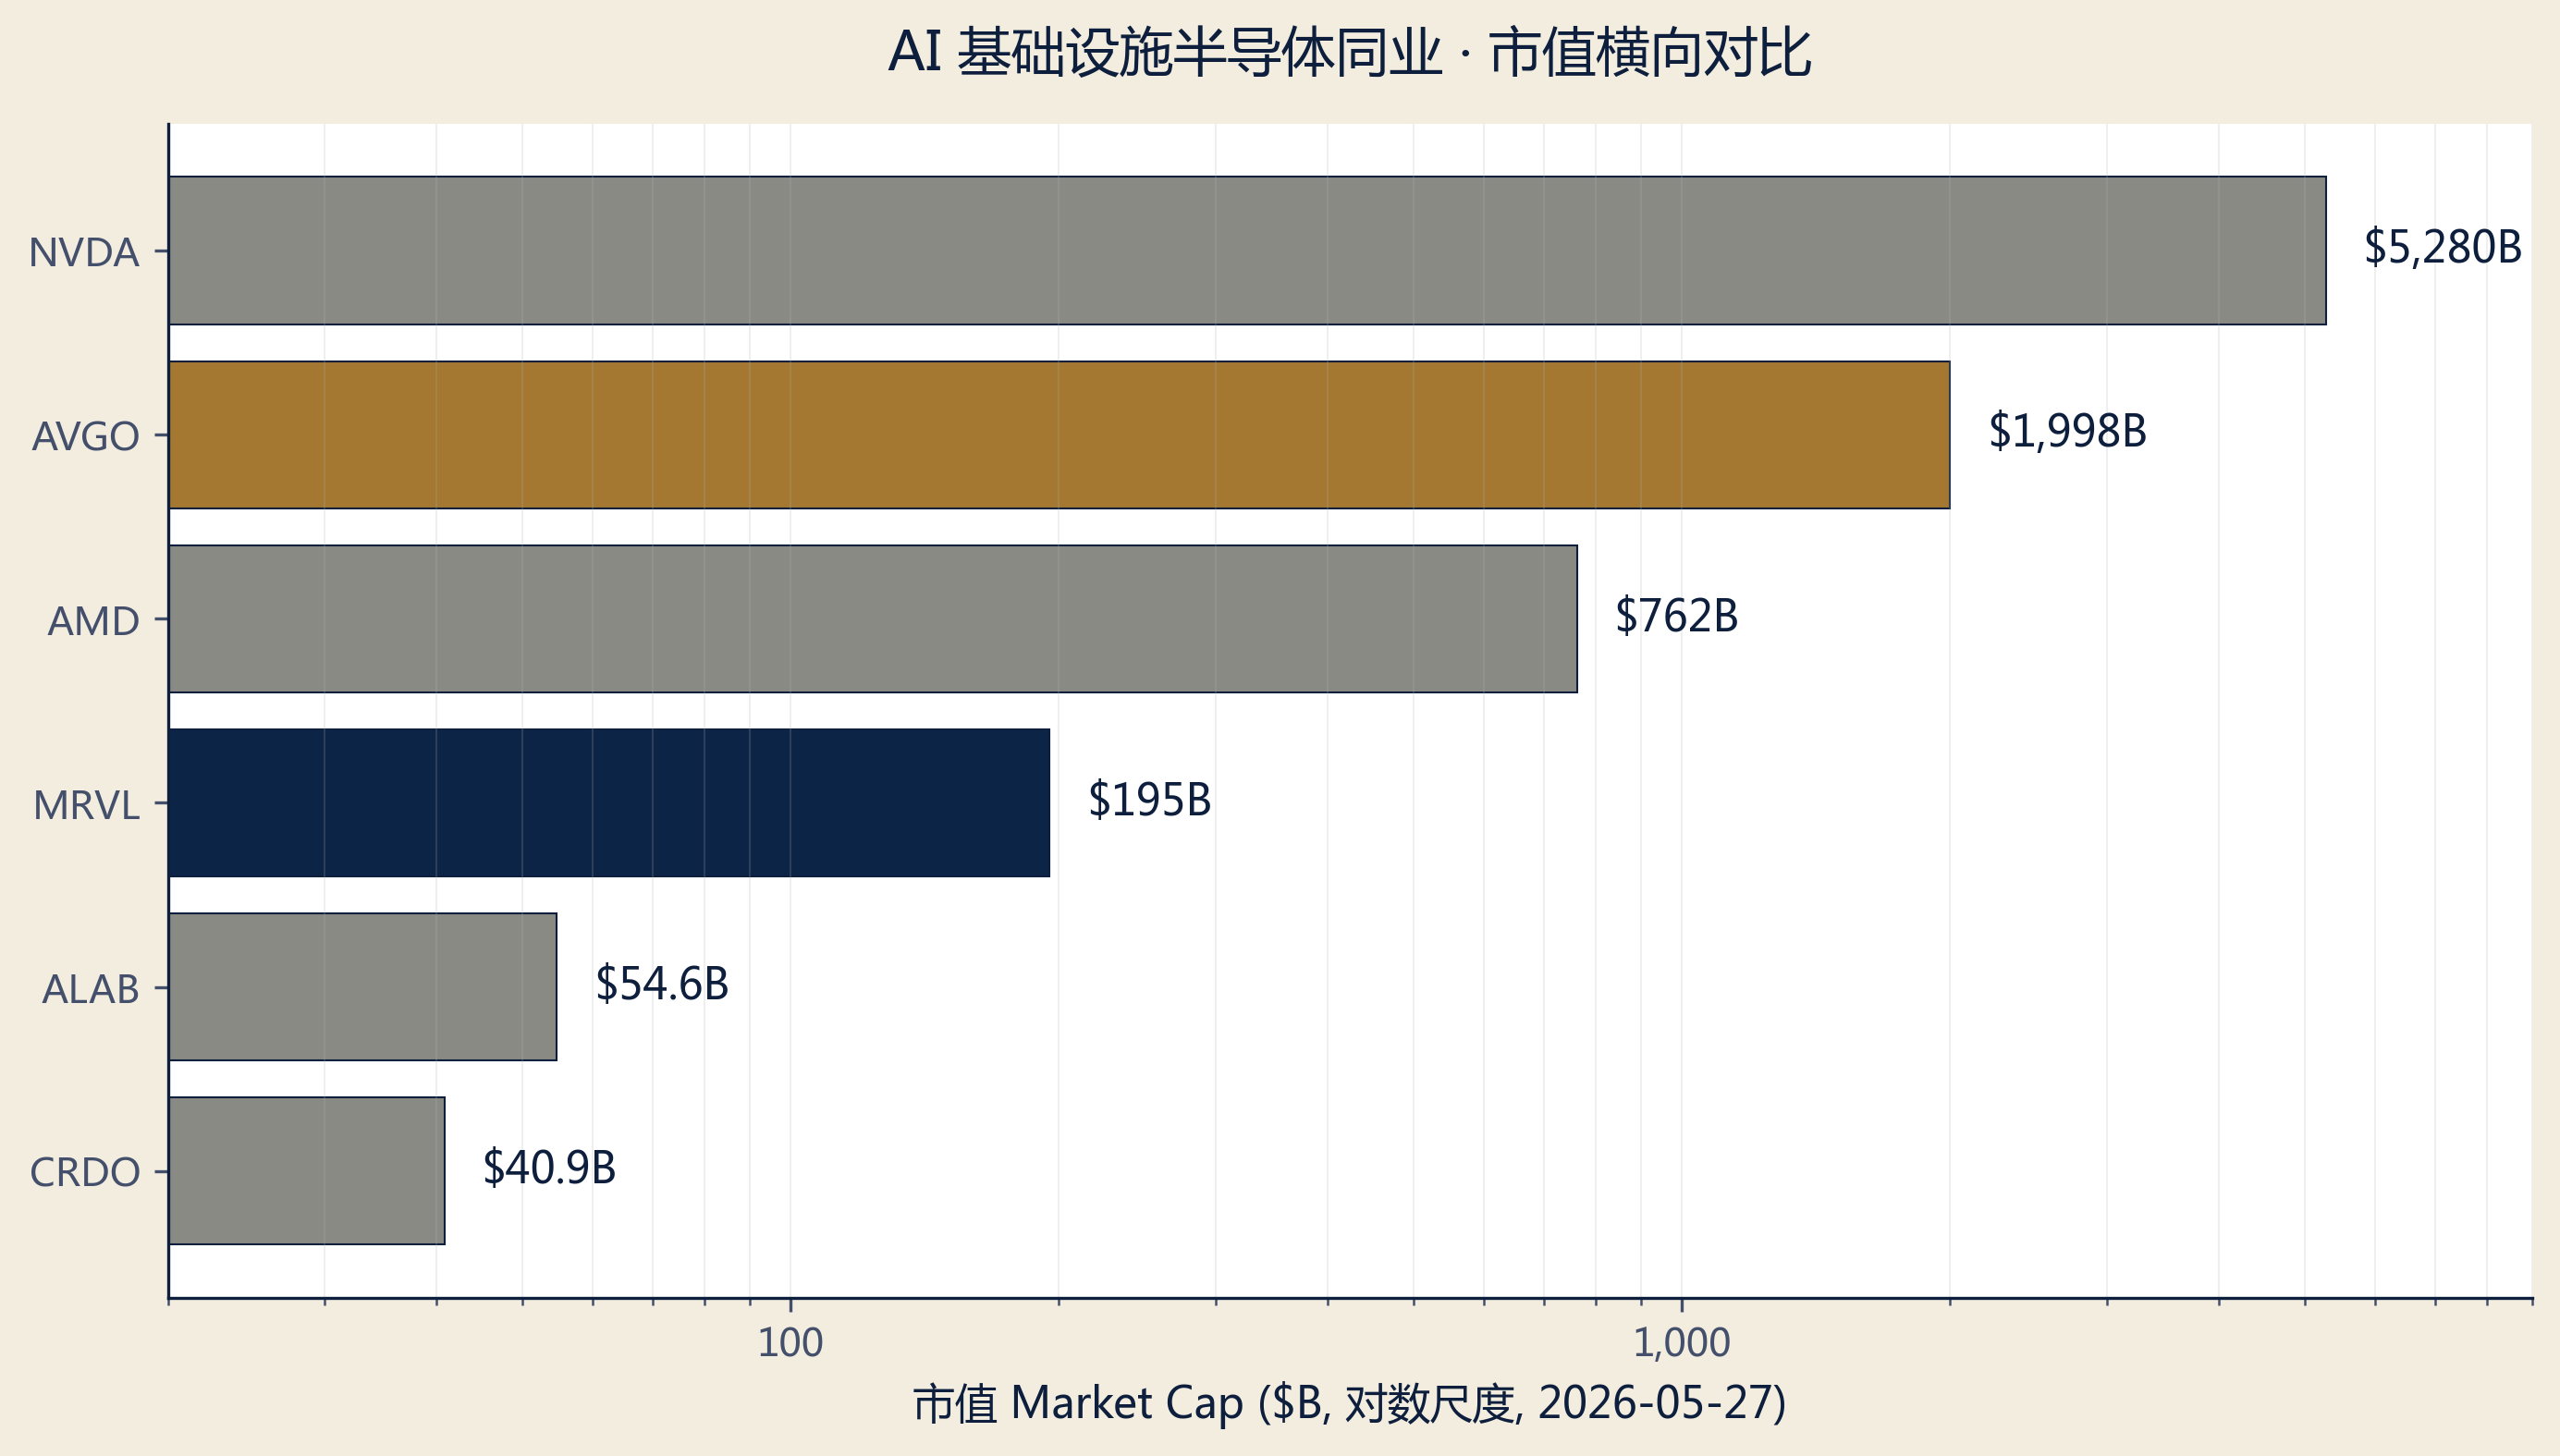
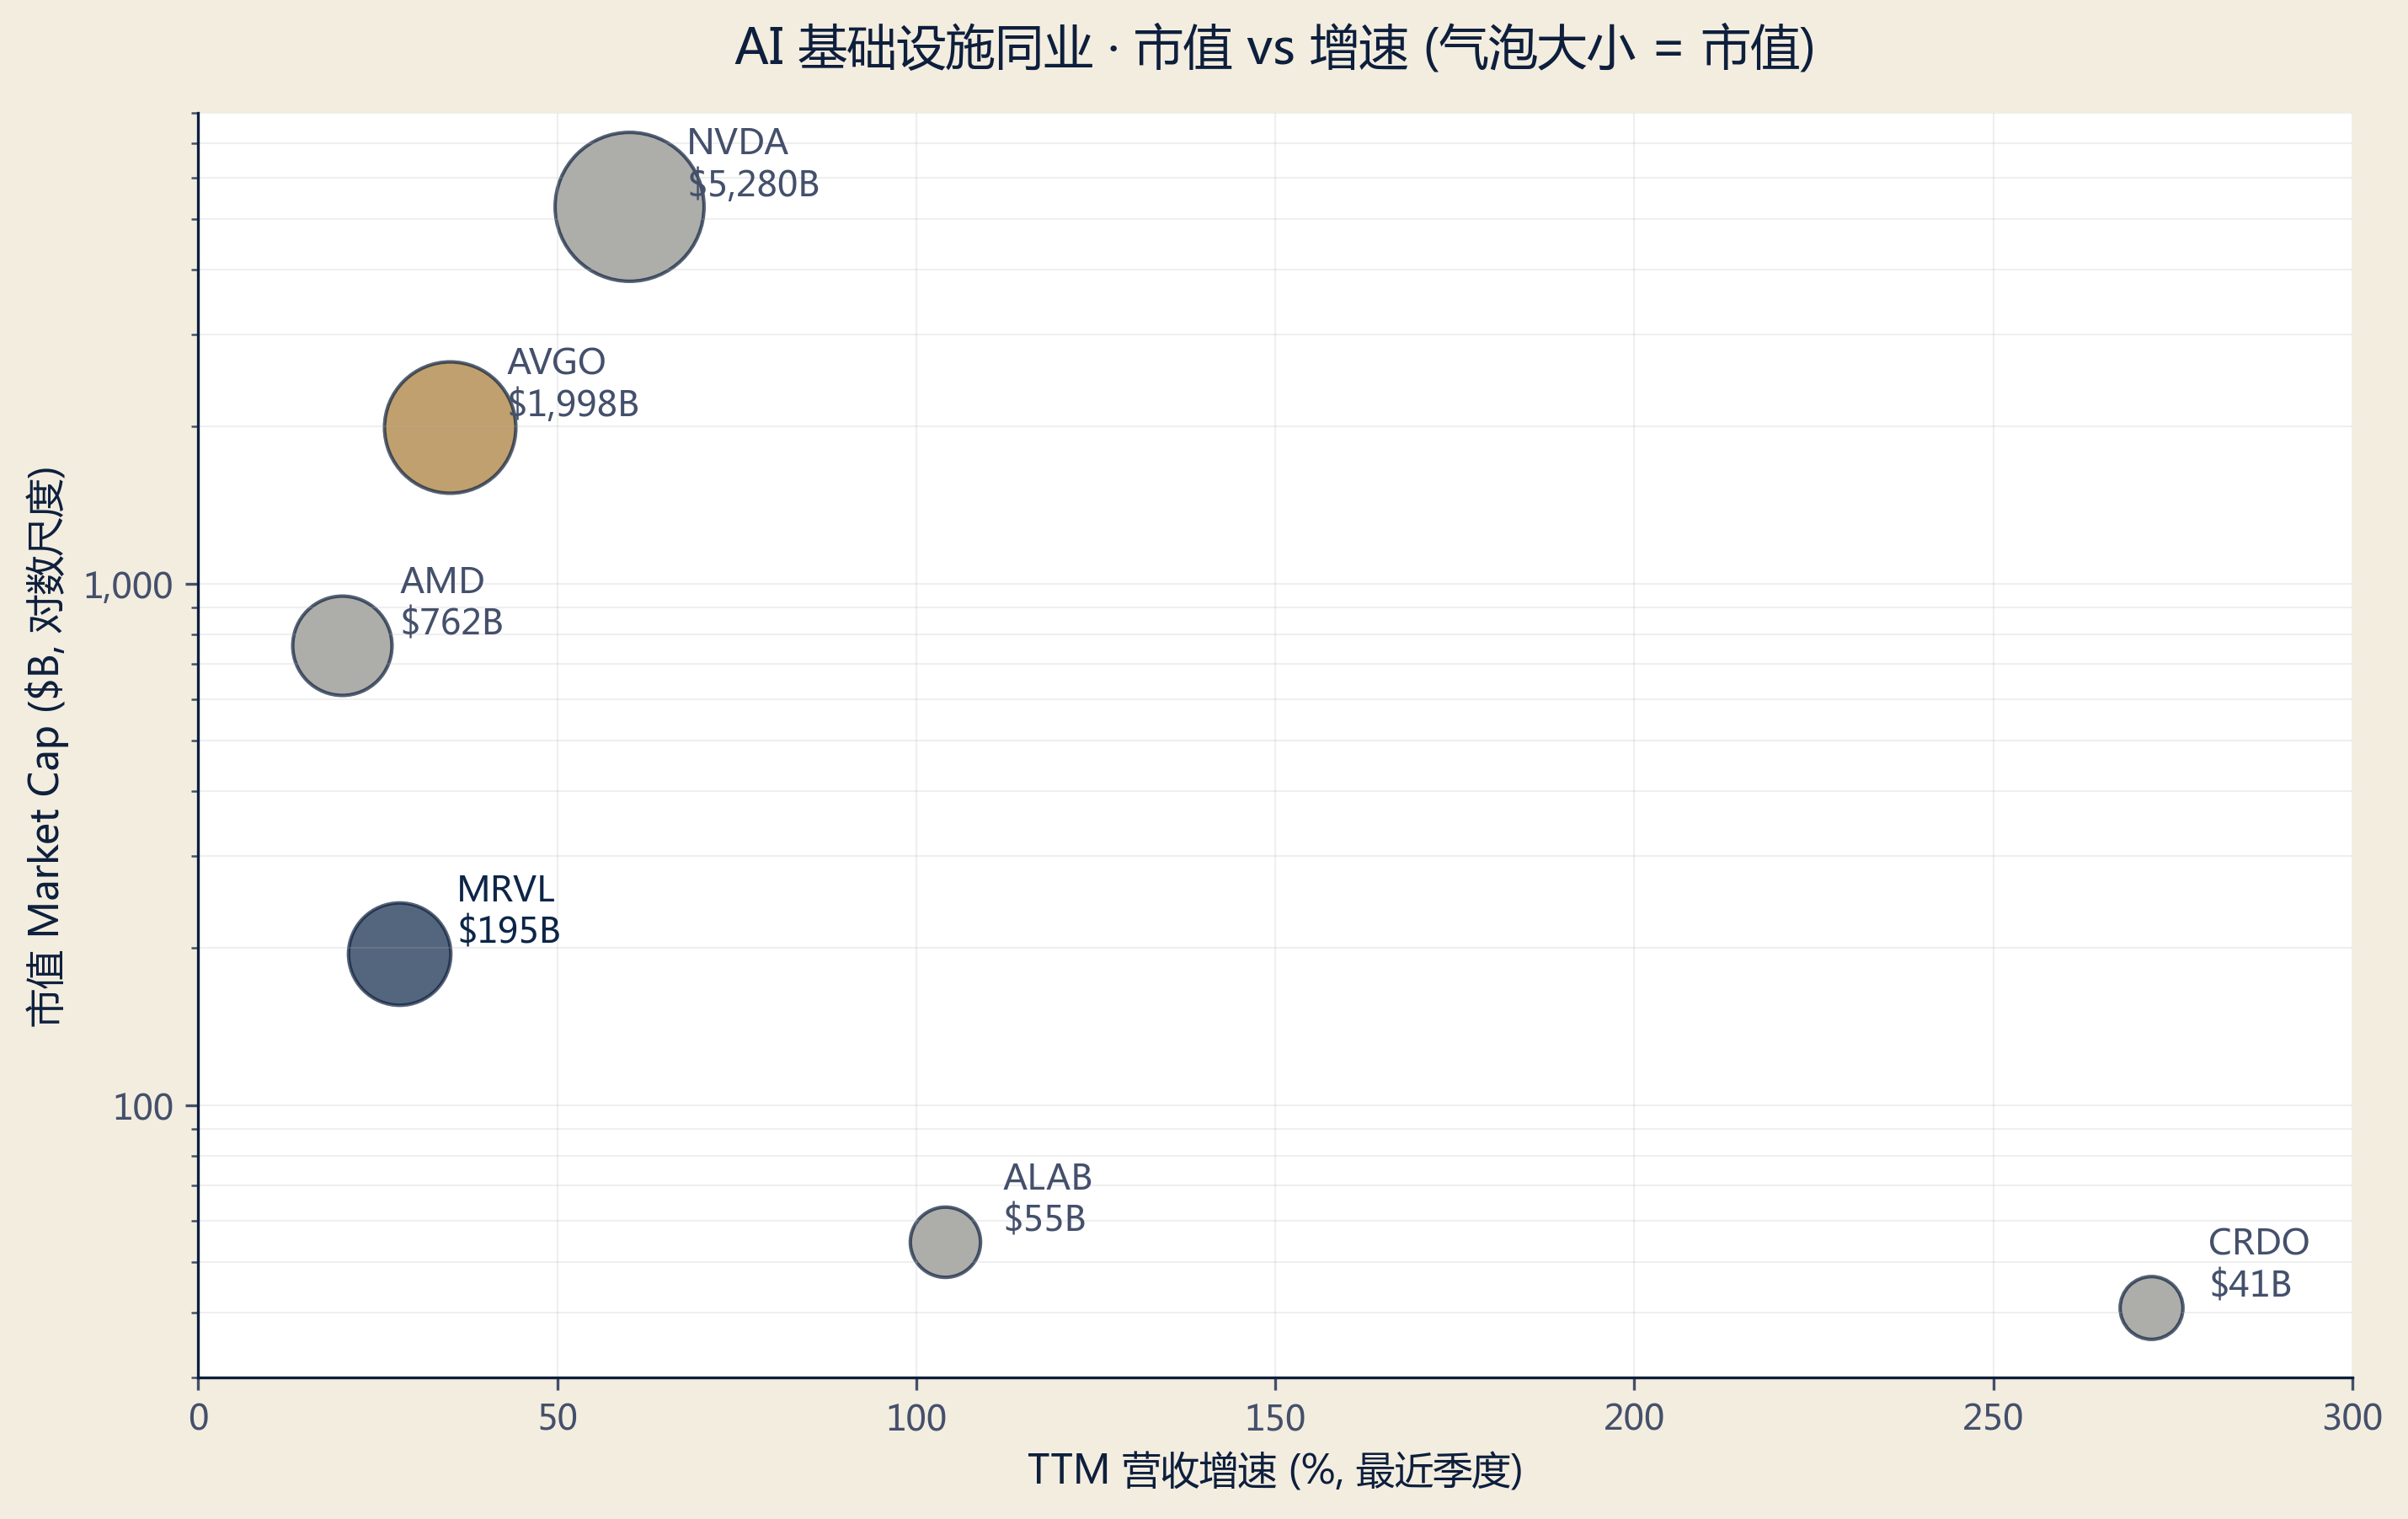
| Marvell Technology | MRVL | 195.05 | $220.91 | +42% (FY26) | AI custom silicon + optical |
| Broadcom | AVGO | 1,998 | $422.01 | +35% | Largest ASIC peer + VMware mix |
| Astera Labs | ALAB | 54.64 | $325.32 | +104% | Pure PCIe/CXL play |
| Credo Technology | CRDO | 40.88 | $218.46 | +272% (Q2 FY26) | SerDes specialist, smaller scale |
| Nvidia | NVDA | 5,280 | $213.95 | +60% | Reference · merchant GPU |
| AMD | AMD | 762.33 | $503.89 | +20% | Reference · GPU + CPU |
Data as of 2026-05-27 close (AMD as of 5/22). Market cap and price from stockanalysis.com / companiesmarketcap.com. Forward P/S omitted — each company's NTM consensus revenue moves frequently with analyst revisions, snapshot data ages quickly; this table only lists verified market cap and growth. NVDA / AMD shown only as AI-semi reference, not directly comparable to MRVL's business model.
§ 06Ownership Structure
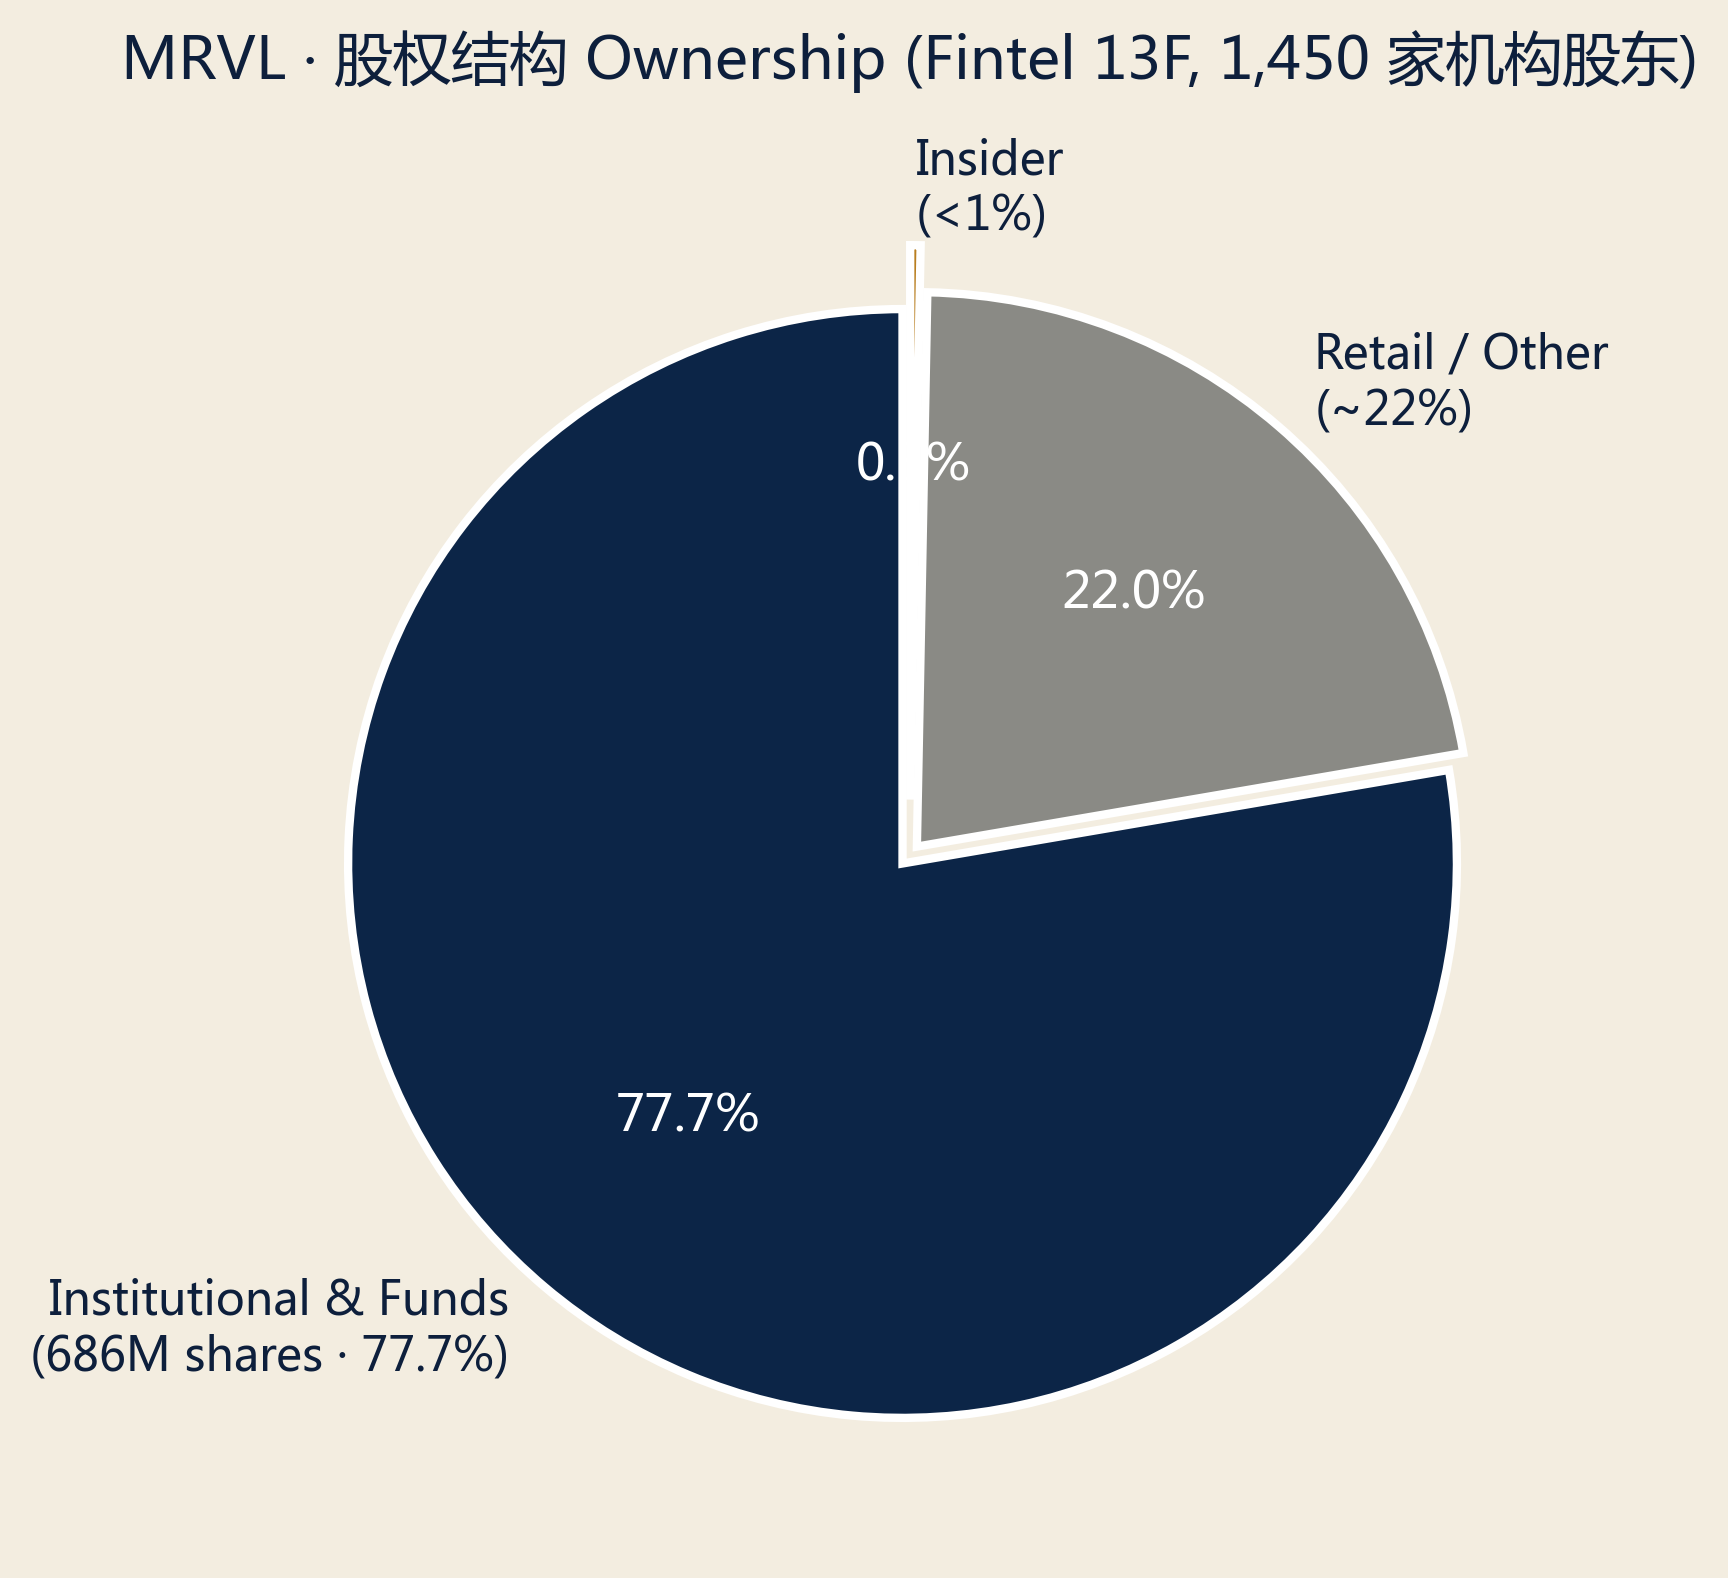
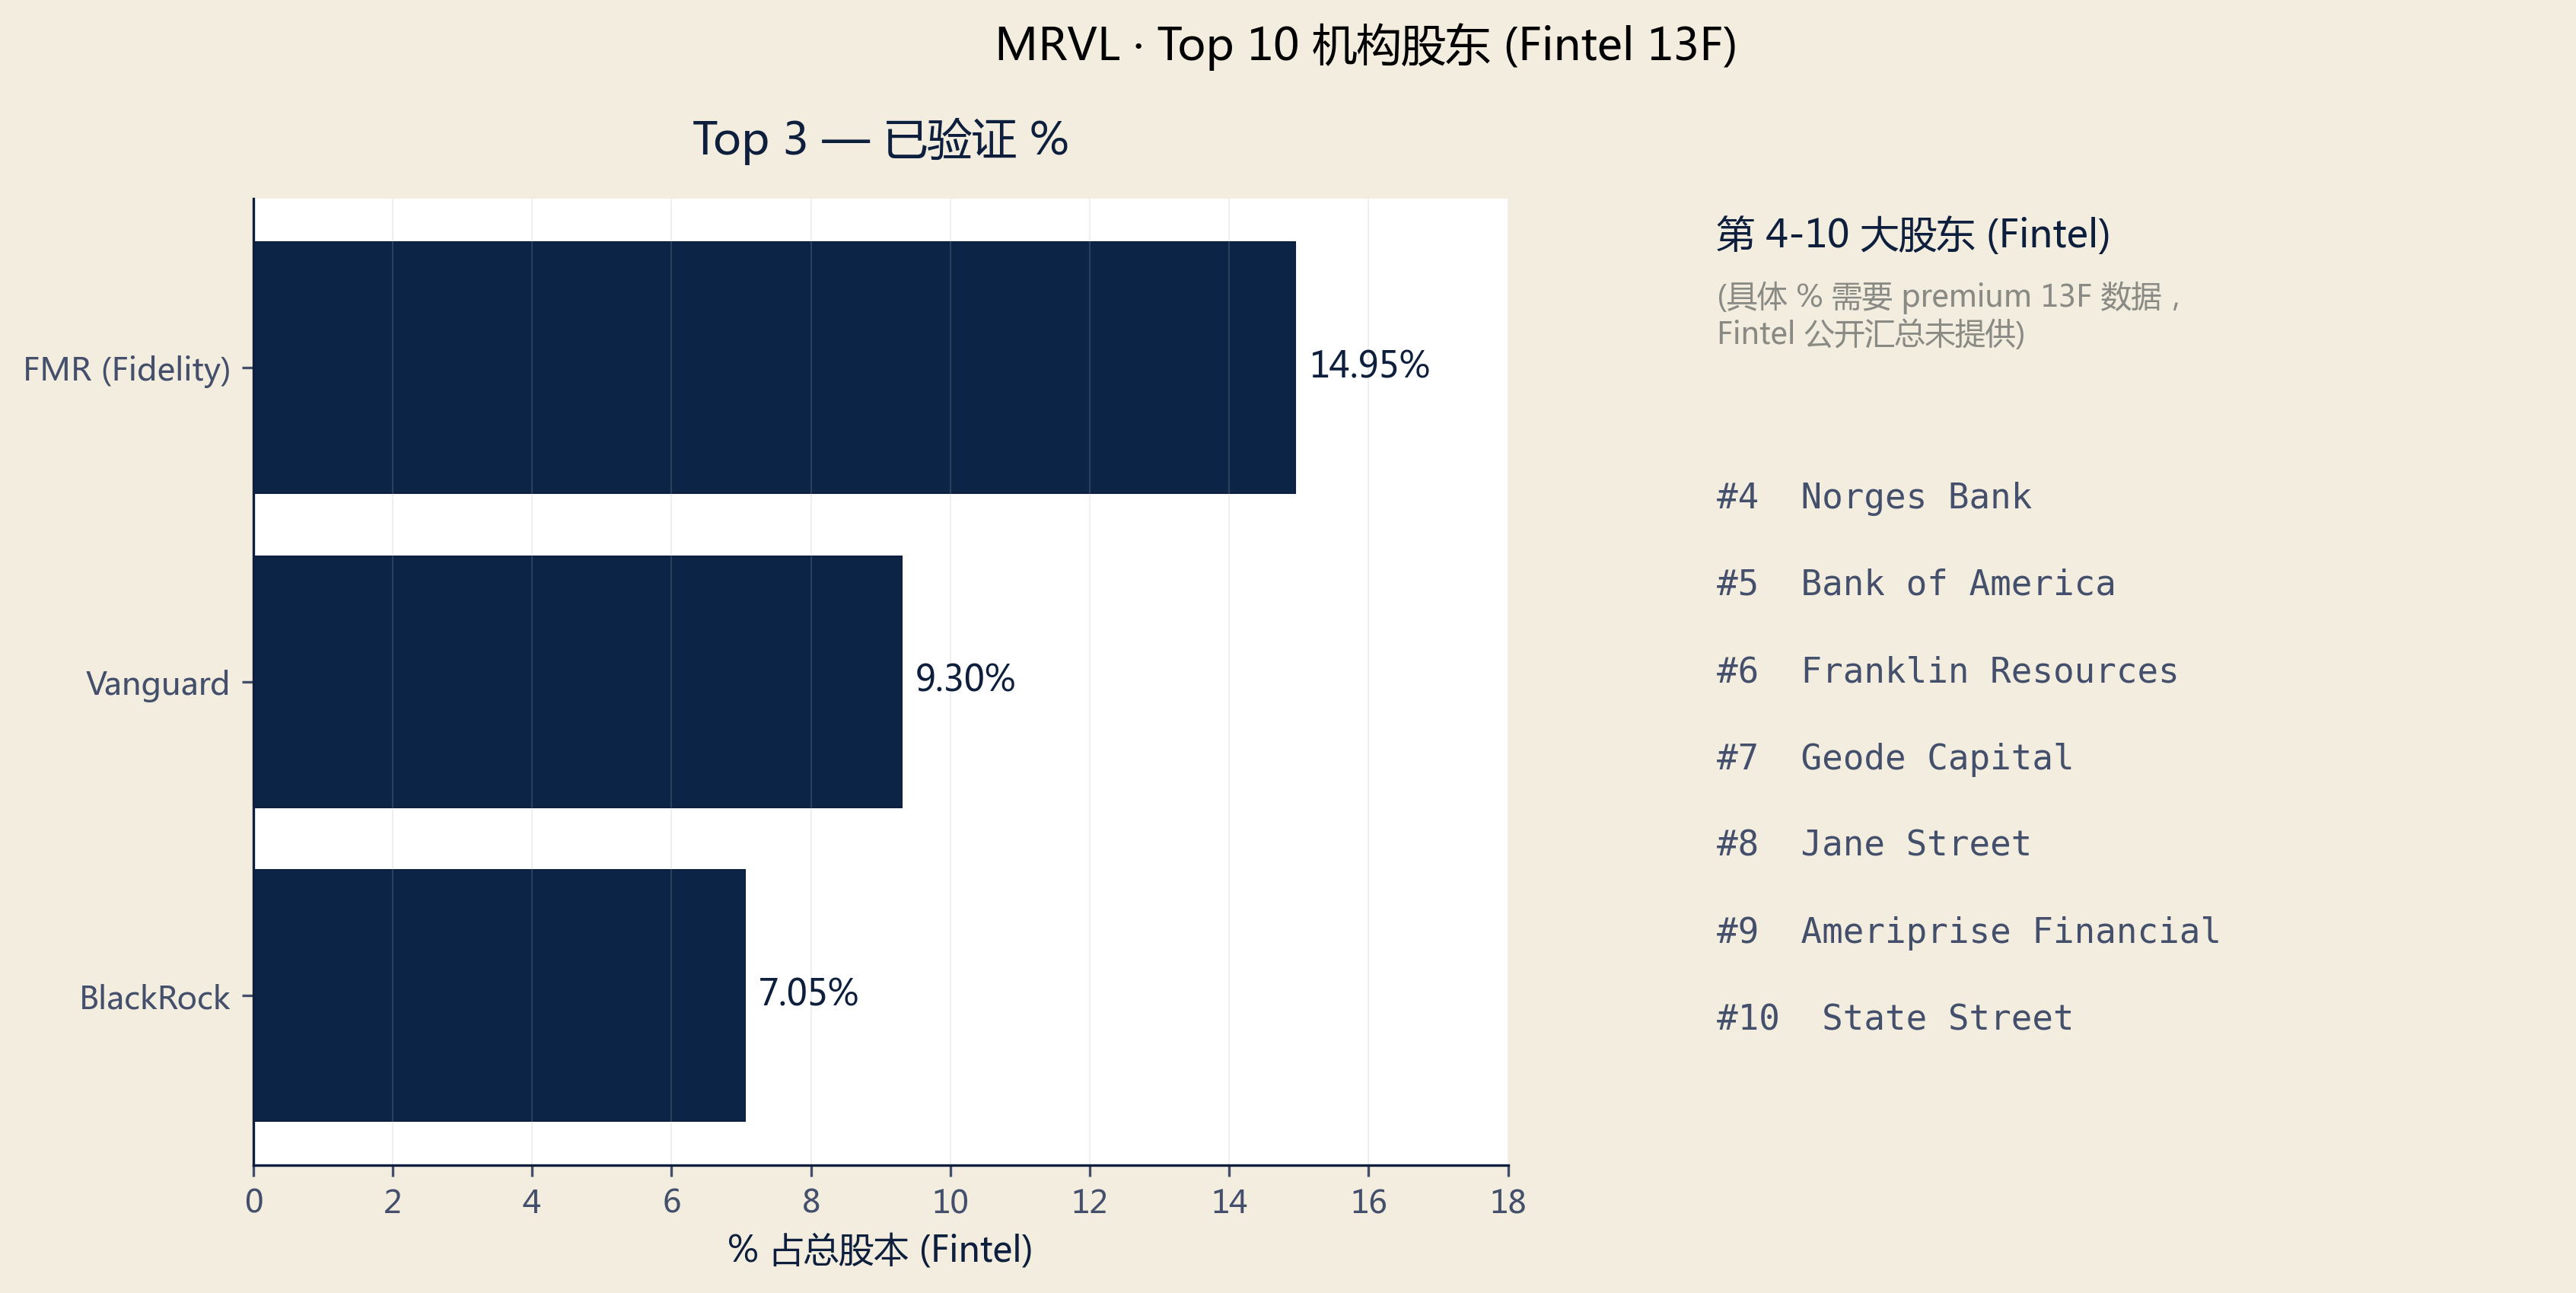
Fidelity (FMR) at 14.95% is an active overweight signal — far above its passive index weight; Fidelity active funds have conviction in MRVL. Vanguard 9.30% is mainly indexer standard. Institutional 77.7% dominance (computed: 686M Fintel-reported shares / 883M diluted) means positioning shifts price the stock efficiently, with no notable supply-shock risk. Insider <1% is structural norm for mature large-cap semis (CEO Matt Murphy ~0.3% via RSU vesting).
§ 07Analyst Estimates (Consensus)
| Forecast Period | Revenue Mid | Revenue Range | EPS (Non-GAAP) | # Analysts | Expected Release |
|---|---|---|---|---|---|
| Q1 FY27 (actual) | $2,418M | 报告值 | $0.80 | 报告值 | 2026-05-27 ✓ |
| Q2 FY27 (guide) | $2,700M | ±5% | ~$0.88 (est) | 指引 | 2026-08 (est) |
| FY27E (full year) | $11.0B | $10.8B - $11.5B | $3.80 - $4.20 | ~44 | — |
| FY28E (full year) | $13.5B | $11.5B - $16.5B | $5.50 - $6.50 | ~44 | — |
FY27E consensus $11.0B implies +34% YoY; FY28E $13.5B mid implies +23% YoY ('law of large numbers' natural decel). High-low gap (FY28E $11.5B vs $16.5B) = bull/bear disagreement on custom silicon ramp + Google new socket. Our model: FY27E $11.0B + FY28E $13.5B mid + non-GAAP GM held at 58-60%.
Key observation: consensus EPS growth (FY27E +35-48%) materially outpaces revenue growth (+34%) — sell-side likewise expects operating leverage delivery. Consistent with management's '70%+ incremental operating margin' long-term guide.
§ 08Valuation & Price Target
Target Price Construction (Multi-Method Football Field)
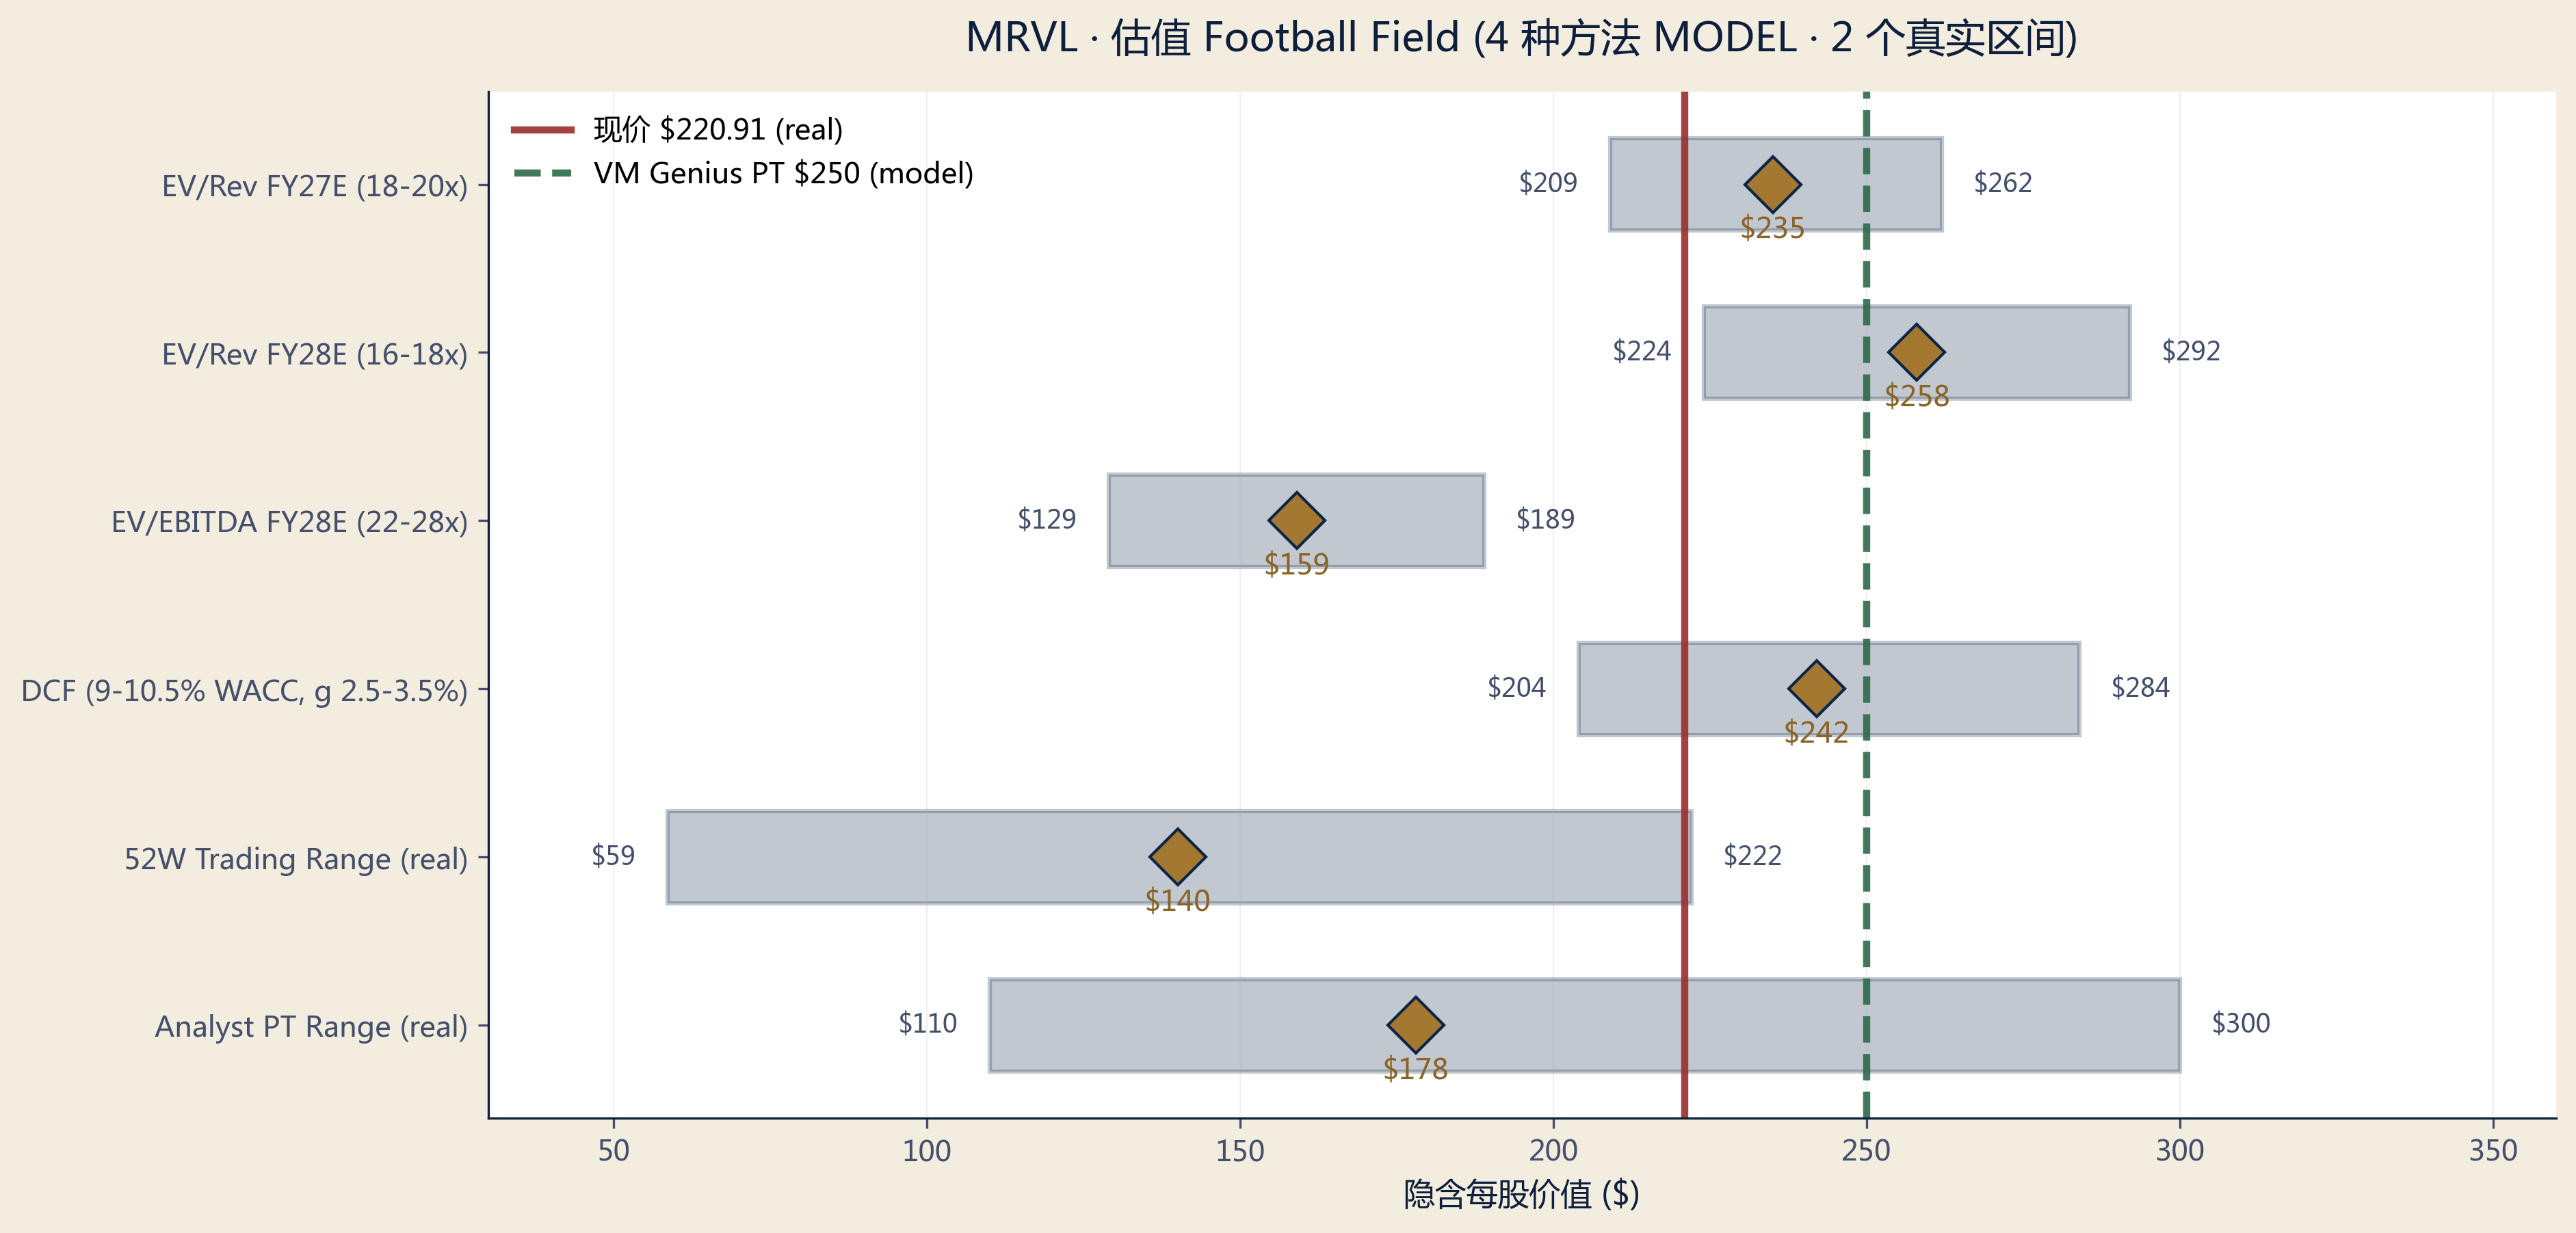
| Method | Low | Mid | High | Weight | Weighted Mid |
|---|---|---|---|---|---|
| EV/Rev FY27E (18-20x) | $209 | $235 | $262 | 30% | $71 |
| EV/Rev FY28E (16-18x) | $224 | $258 | $292 | 30% | $77 |
| EV/EBITDA FY28E (22-28x) | $129 | $159 | $189 | 25% | $40 |
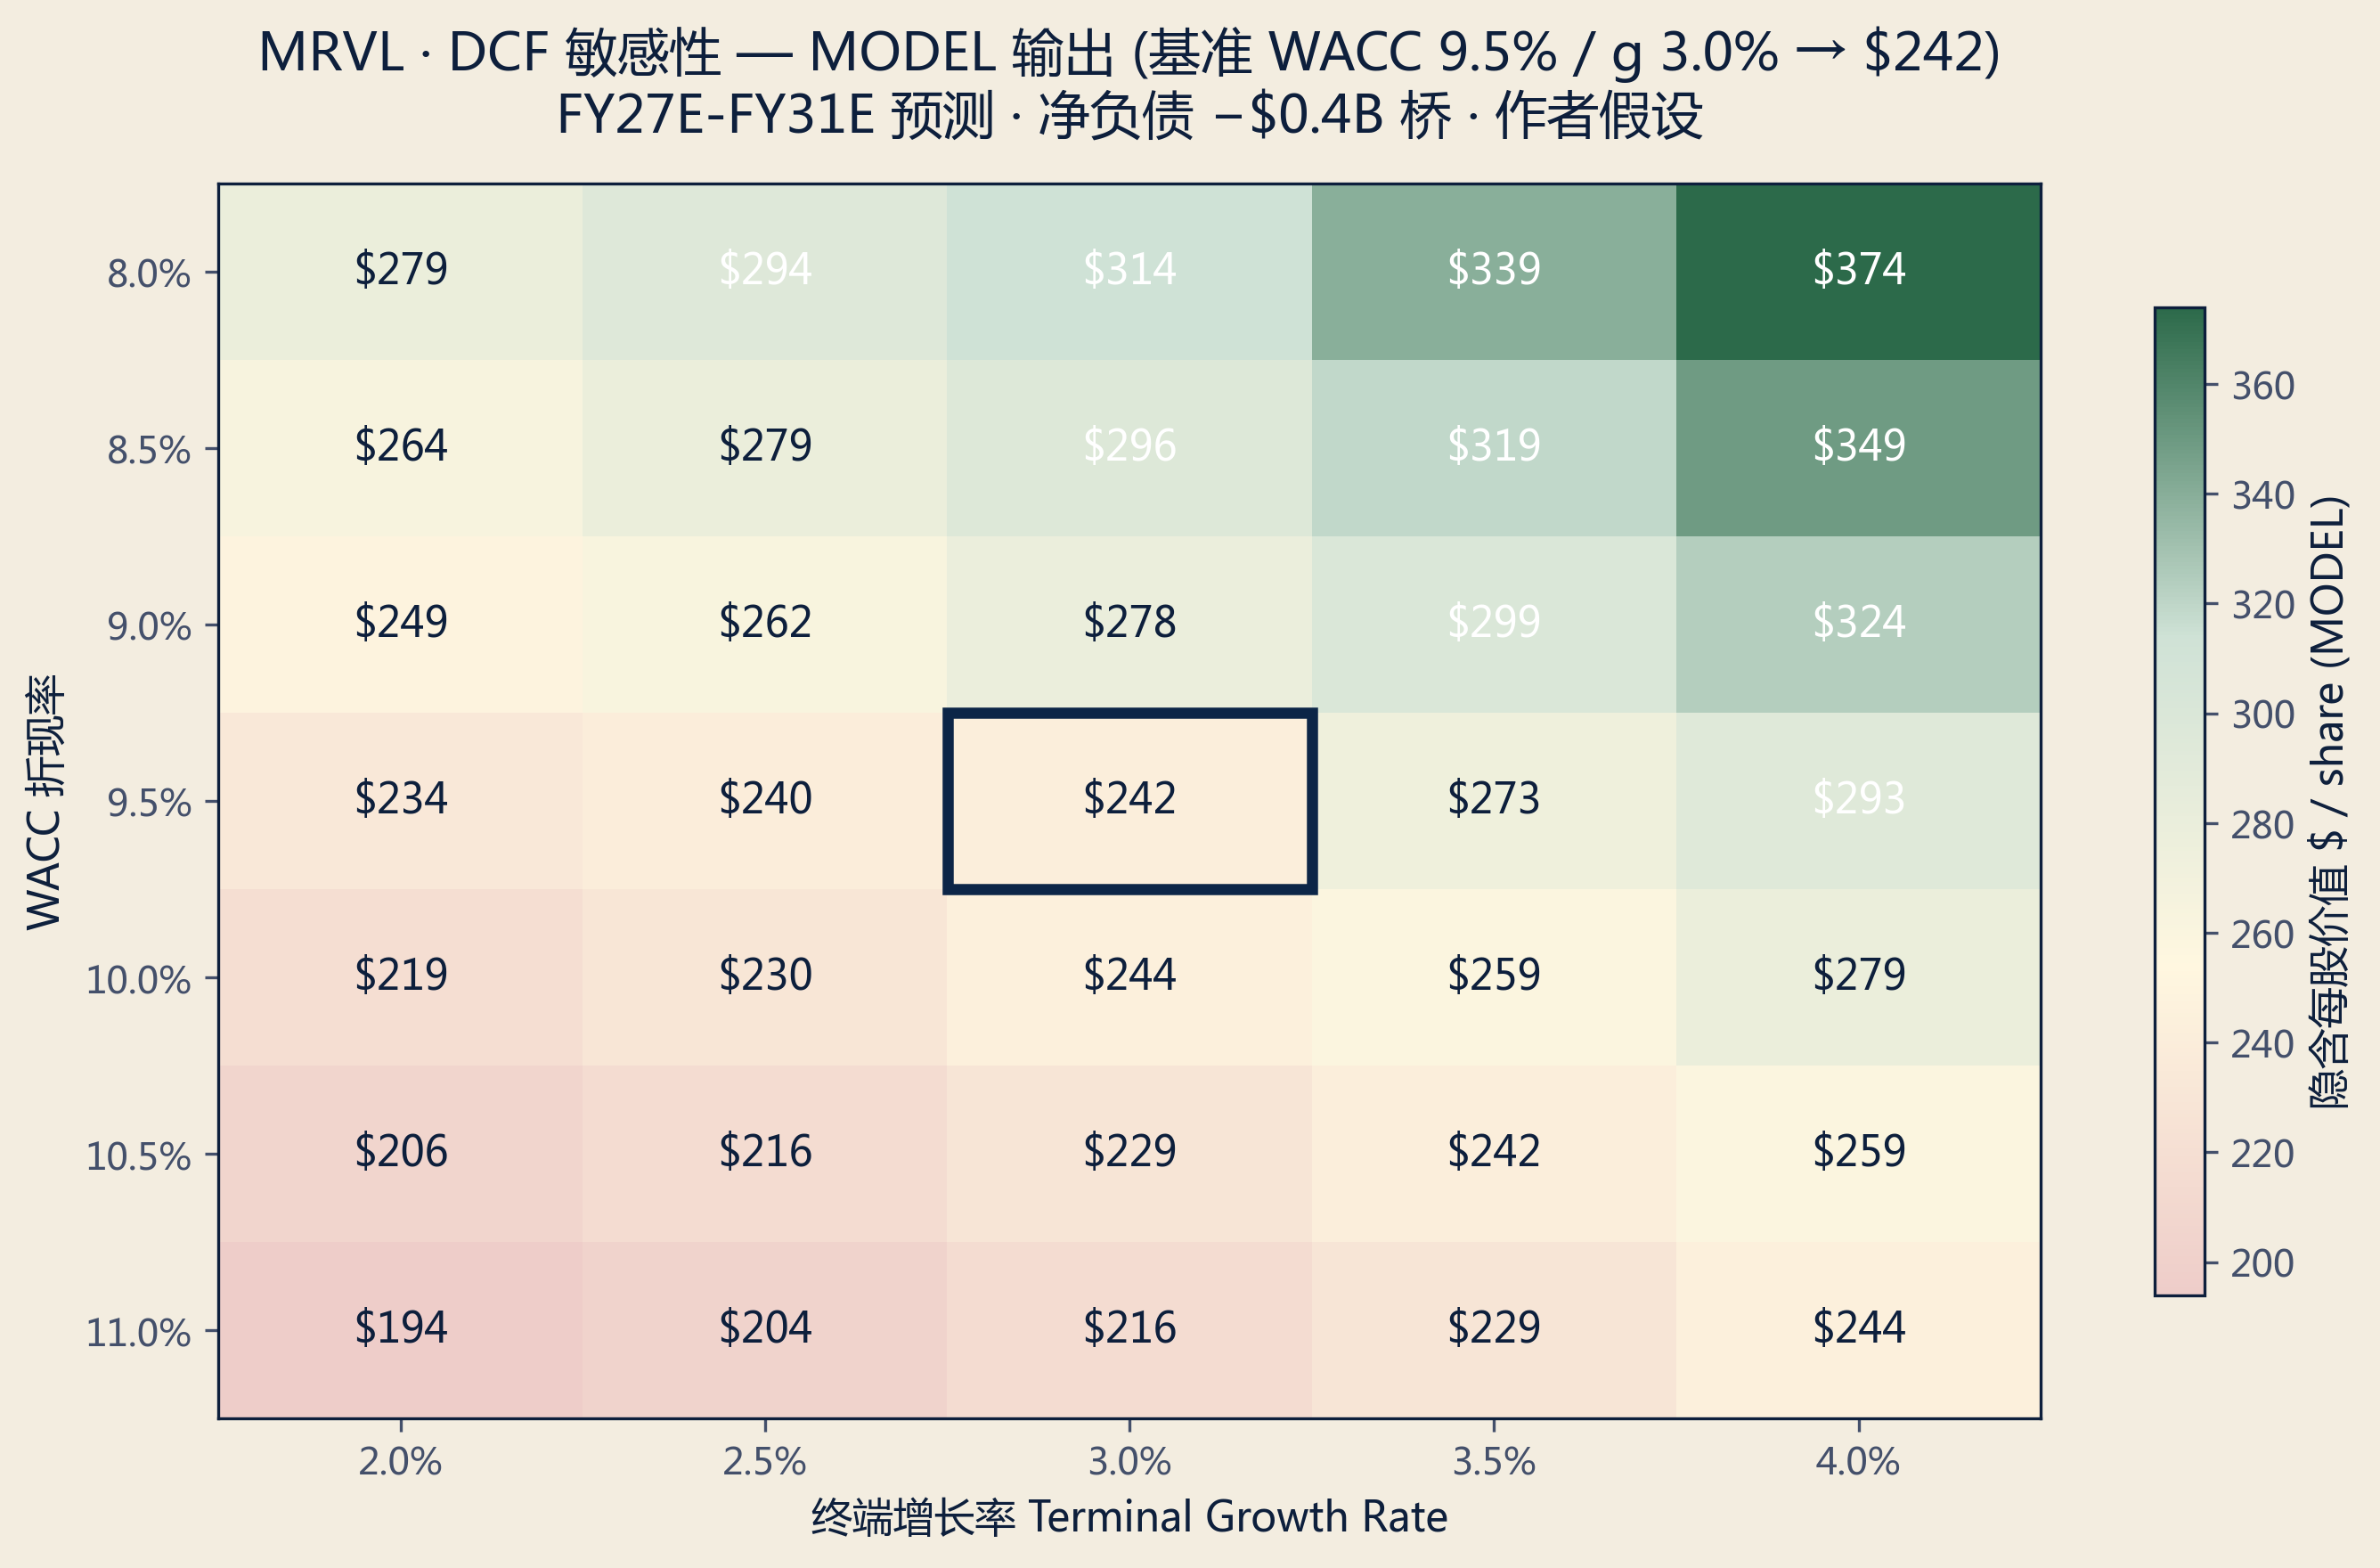
| DCF (WACC 9-10.5%) | $204 | $242 | $284 | 15% | $36 |
| Weighted Average | $193 | $224 | $256 | 100% | $224 |
| VM Genius PT (12M) | — | $250 | — | — | — |
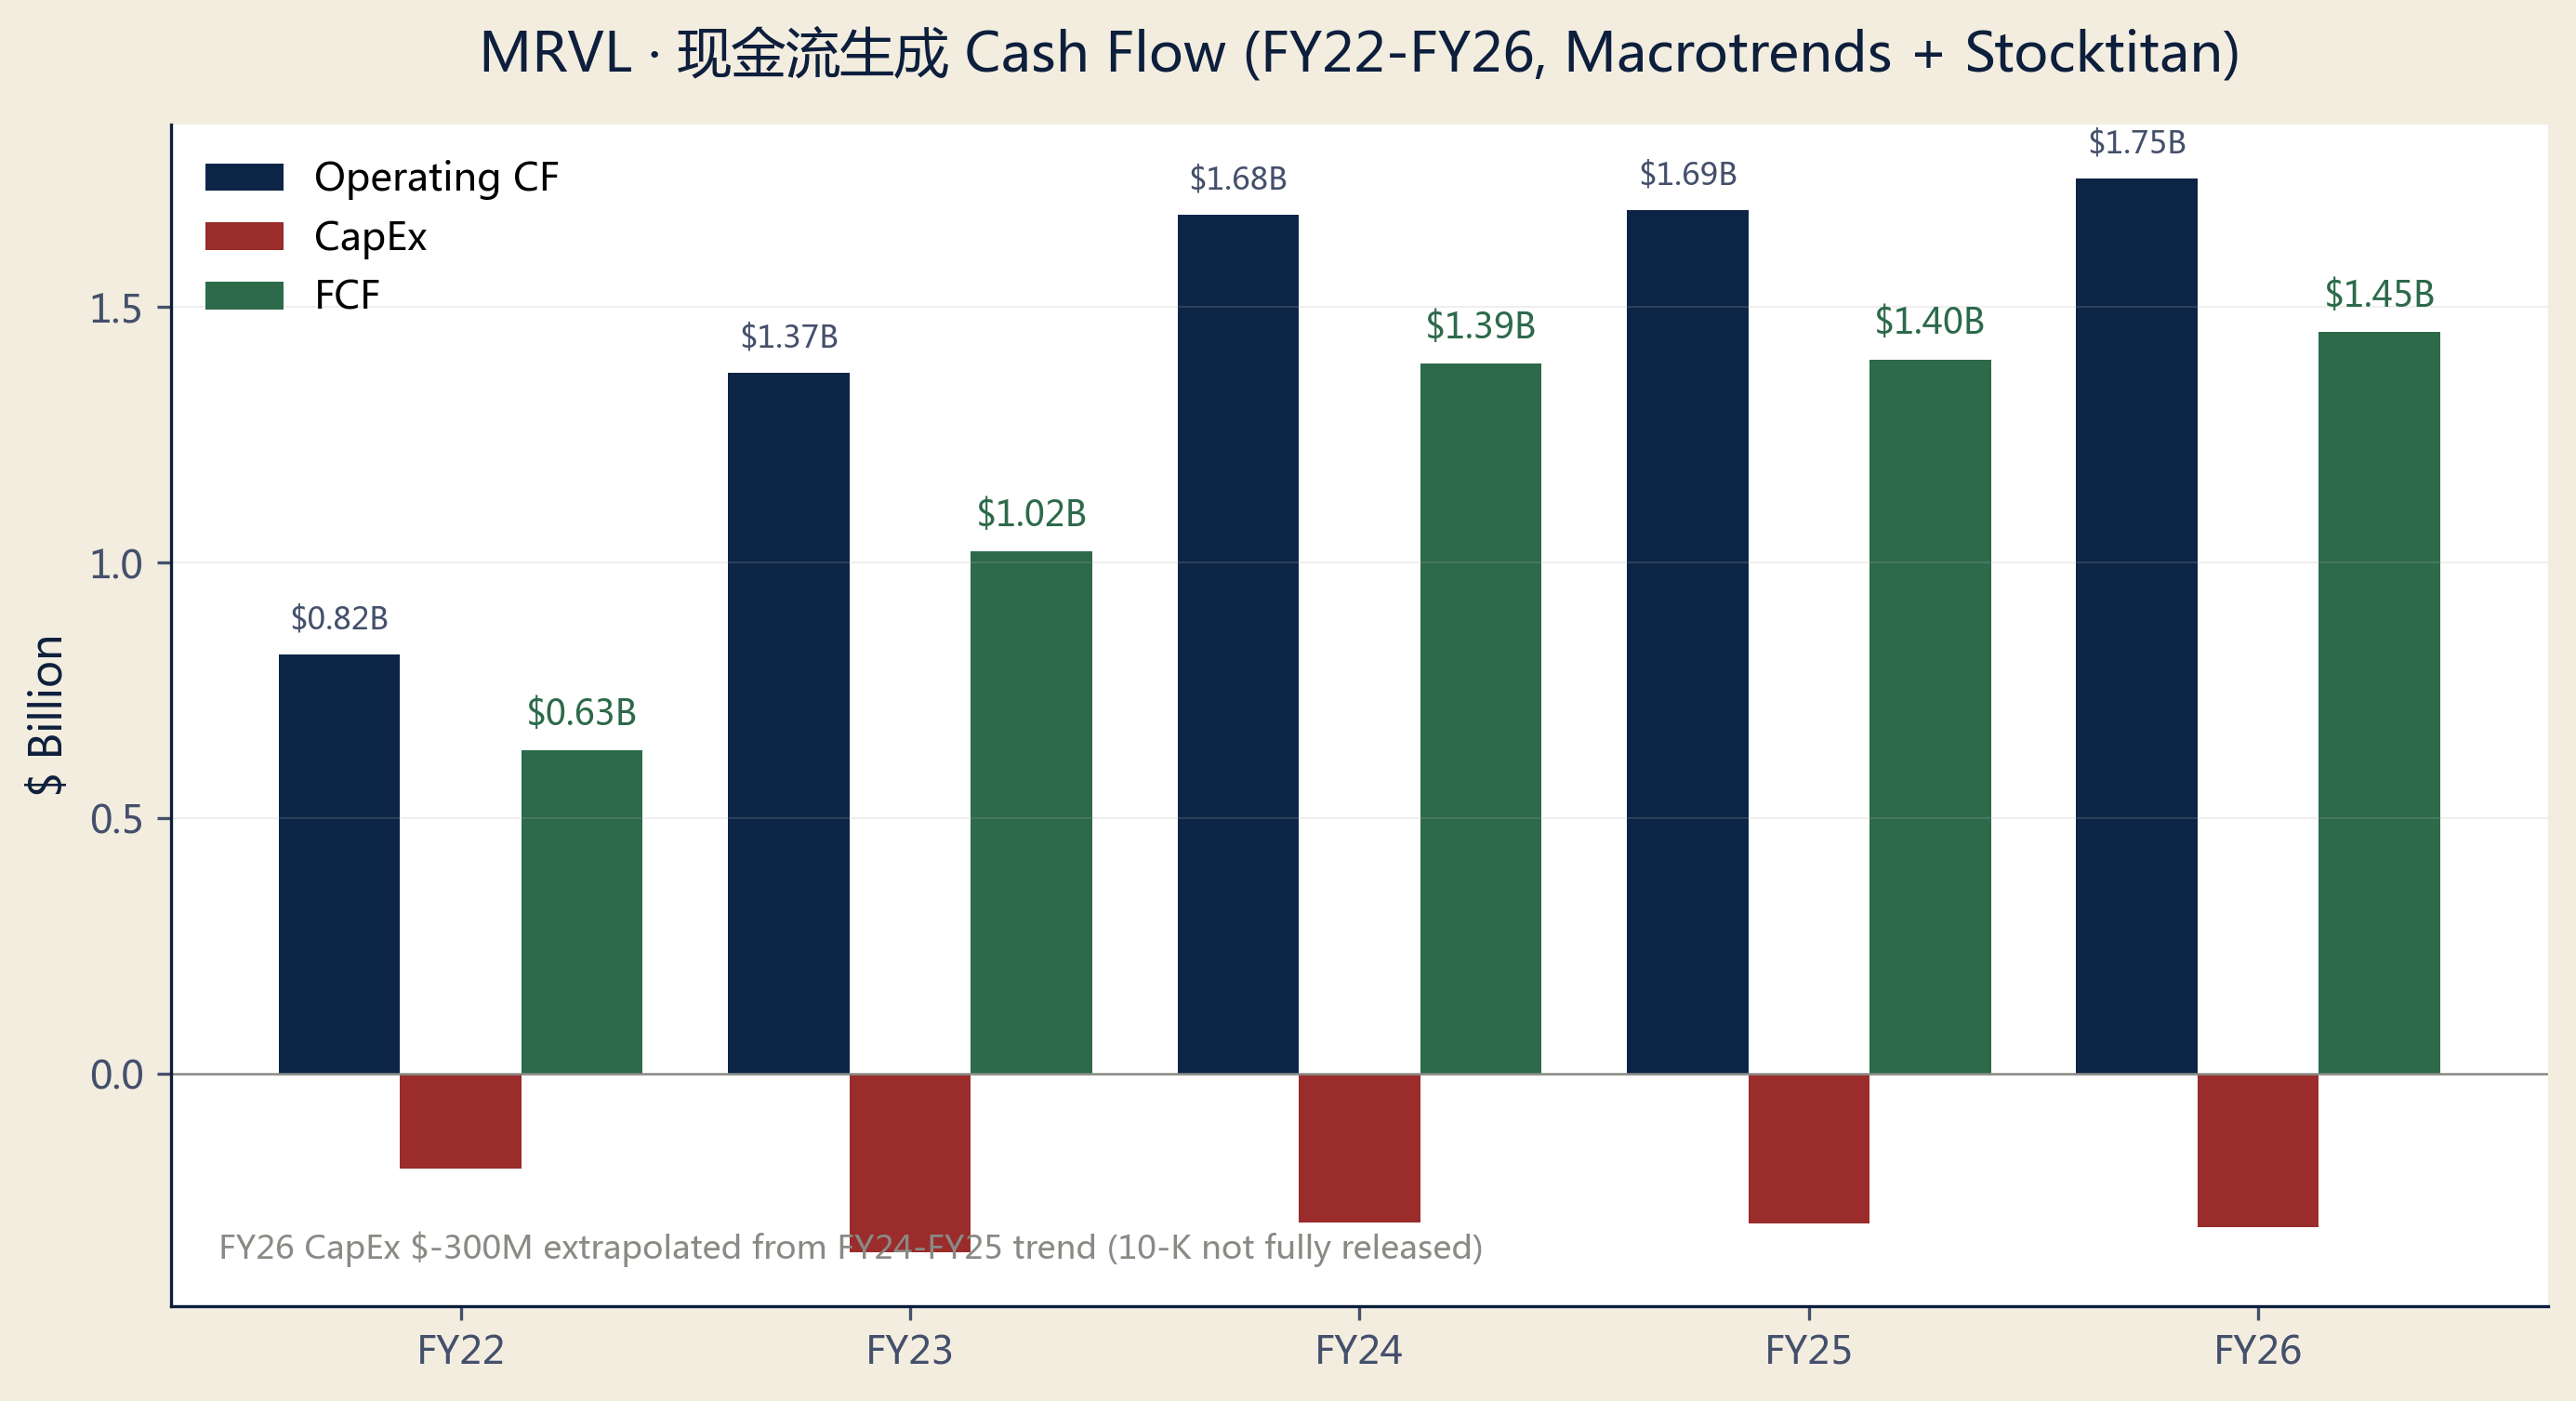
EV→equity bridge uses net debt −$0.4B (cash $2.64B − total debt ~$3.0B incl. 5 senior notes, per SEC 8-K FY26). Weighted average $224; we round up to $250 reflecting (a) recent consensus upgrade momentum (HSBC $300, Susq $230); (b) Q1 FY27 print not fully reflected; (c) Google new socket upside optionality outside base model. Probability-weighted scenario PT is also $250.
Scenario Analysis
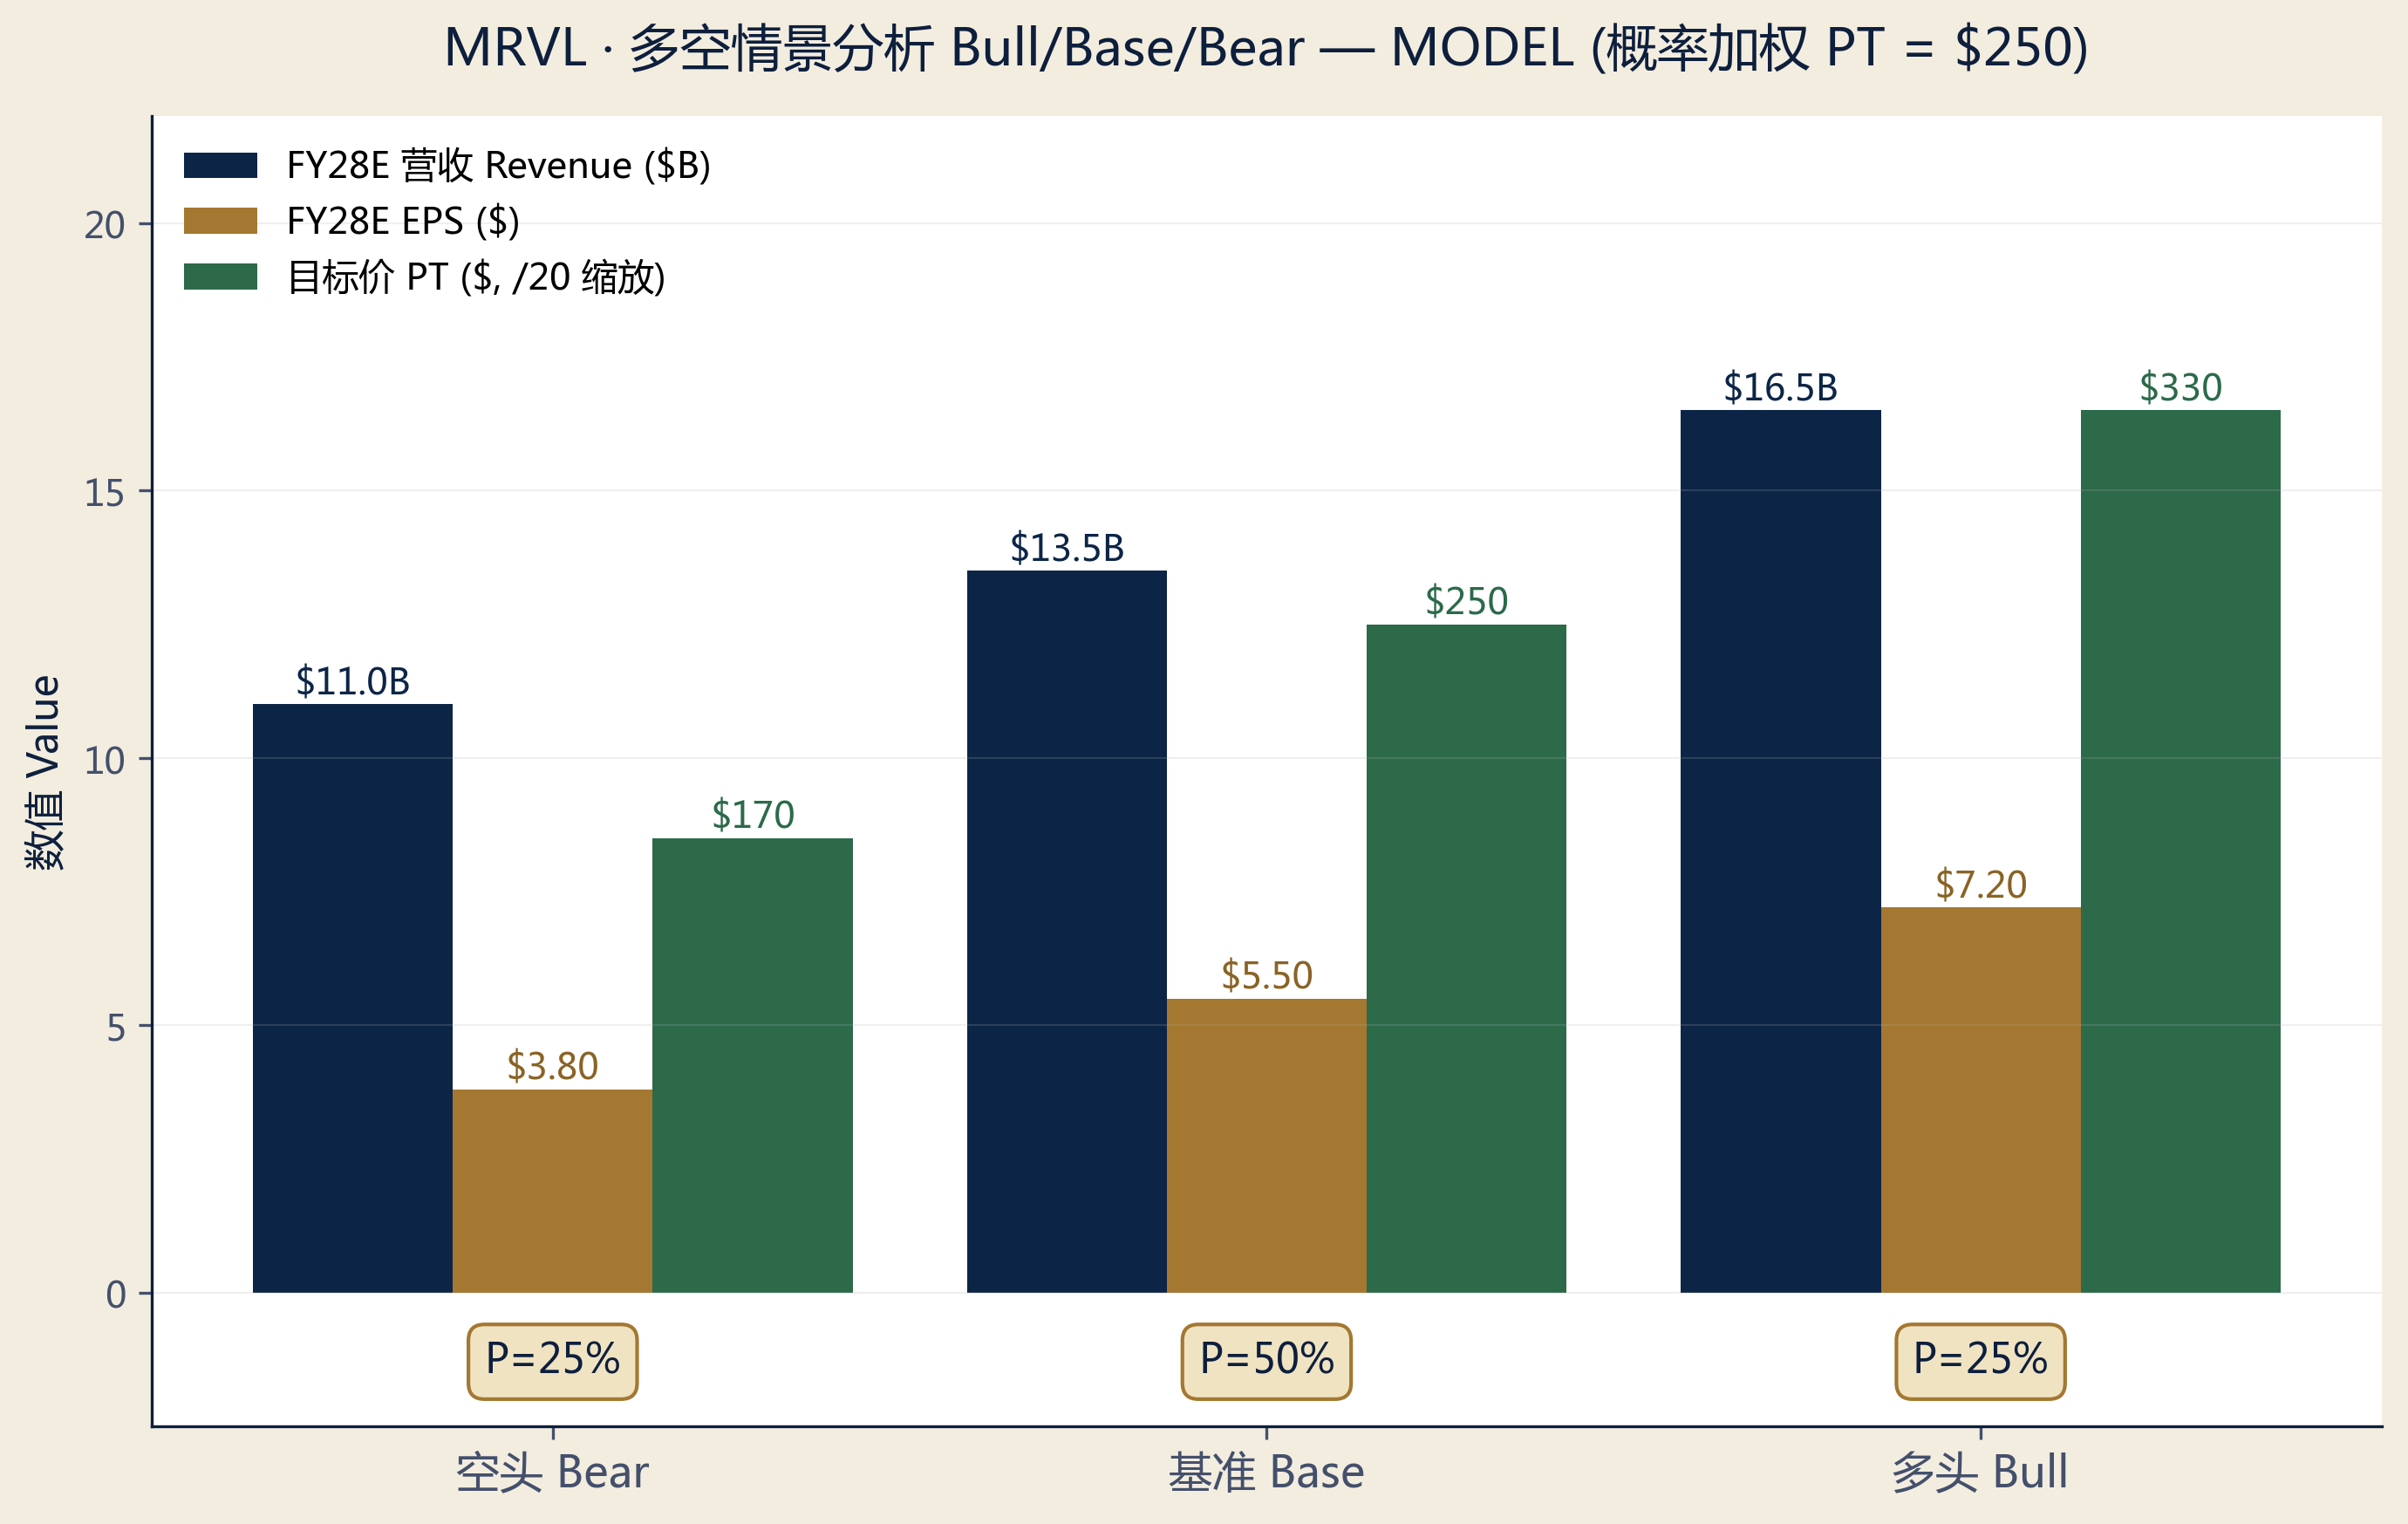
| Scenario | Probability | FY28E Rev | FY28E EPS | 12M PT | Implied Return | Trigger Conditions |
|---|---|---|---|---|---|---|
| Bull | 25% | $16.5B | $7.20 | $330 | +49.4% | Google new socket + Trainium 3 full ramp + 1.6T DSP takes AVGO share |
| Base | 50% | $13.5B | $5.50 | $250 | +13.2% | Signed design wins ramp on time, AVGO remains top competition |
| Bear | 25% | $11.0B | $3.80 | $170 | -23.0% | AWS Trainium 4 switches to AVGO, or momentum factor rotation reverses |
Probability-weighted PT = 0.25 × $330 + 0.50 × $250 + 0.25 × $170 = $250. Consistent with Base PT, reflecting symmetric upside/downside. Implies +13.2% return vs current $220.91.
§ 09Catalysts (12-Month Horizon)
| Date | Event | PT Impact | Source |
|---|---|---|---|
| 2026 Q2-Q3 | AWS Trainium 3 volume ramp · MRVL co-design large socket | +$10 / -$15 | AWS capex pace |
| 2026-08 (est) | Q2 FY27 earnings · guide $2.70B (±5%), validate or accelerate | ±$15 | Company guide |
| 2026 mid | Microsoft Maia next-gen confirmation · multi-gen roadmap | +$10 / -$5 | MSFT announcement |
| 2026 H2 | Google MPU + inference TPU design win decision · if signed = 3rd hyperscaler | +$25 / -$5 | Google negotiation |
| 2026-11 (est) | Q3 FY27 earnings · Trainium 3 ramp first material contribution | ±$15 | Company release |
| 2026 H2 | 1.6T PAM4 DSP volume · vs AVGO key share-of-socket competition | ±$8 | Company product launch |
| 2027 Q1 | FY27 full results + analyst day + FY28 long-term framework | ±$20 | — |
§ 10Limitations, Disclaimers & Disclosures
Limitations of This Report
- Q1 FY27 results just released May 27; analysis based on published prepared remarks and 8-K, but full Q&A transcript and subsequent management calls not incorporated.
- No full bottom-up product-level revenue model built; end-market commentary draws on company disclosures + sell-side consensus.
- DCF uses simplified terminal assumptions; a 10-year explicit horizon would yield a wider implied price range.
- Analyst PT and consensus differ across sources (MarketBeat / S&P / TipRanks / Public.com); we use approximate midpoints rather than point estimates.
- Peer comp data (market cap, growth) based on 2026-05-27 cross-sectional snapshot; these are floating metrics, may move 5-10% before next update. Forward P/S omitted because NTM consensus is frequently revised across analysts.
Principal Risks
- Customer Concentration: Top 5 customers ~50% of revenue; loss of single hyperscaler design socket (e.g., AWS Trainium 4 to AVGO) = 5-10% revenue hole.
- Momentum Reversal: YTD +131% / TTM +180% is statistical extremity; semi base-rate suggests elevated probability of 20-30% drawdown within 12 months.
- Valuation Compression: ~17x forward P/S has priced in sustained 30%+ revenue growth + margin hold; any miss on either dimension triggers multiple compression.
- Geographic Concentration: ~50% of revenue recognized in China, including data-center customers; US export control expansion or China retaliation creates revenue volatility.
- Gross Margin Pressure: custom silicon contracts carry lower margin than merchant chip; growing custom mix could compress GM 100-200bps.
Disclosures
This research report was prepared by the VM Genius Equity Research team based on publicly available data as of 2026-05-28. The authors have no investment positions in Marvell Technology. VM Genius has no investment banking relationship with Marvell. Data sources: MRVL FY26 10-K, Q1 FY27 8-K (filed 2026-05-27), Yahoo Finance, Fintel, MarketBeat, TipRanks, S&P Global, NextPlatform, Futurum Group, Tom's Hardware, Sherwood News. All forward-looking statements carry significant uncertainty. This report is informational only and does not constitute investment advice. Past performance does not represent future returns.