Taiwan SemiconductorNYSE:TSM
Published 2026-07-20, with market data as of the 2026-07-17 close. All operating figures are sourced from TSMC's official 2Q 2026 earnings conference materials (2026-07-16); price and consensus are from Yahoo Finance.
TSMC is the undisputed leader in advanced-node foundry and the “picks-and-shovels” supplier to AI compute. Q2 revenue of US$40.20B (+33.7% YoY) reached the top of guidance, while a 67.7% gross margin and 60.3% operating margin both beat the top of guidance and set records; HPC/AI is now 66% of revenue, and 2nm entered its first ramp quarter.
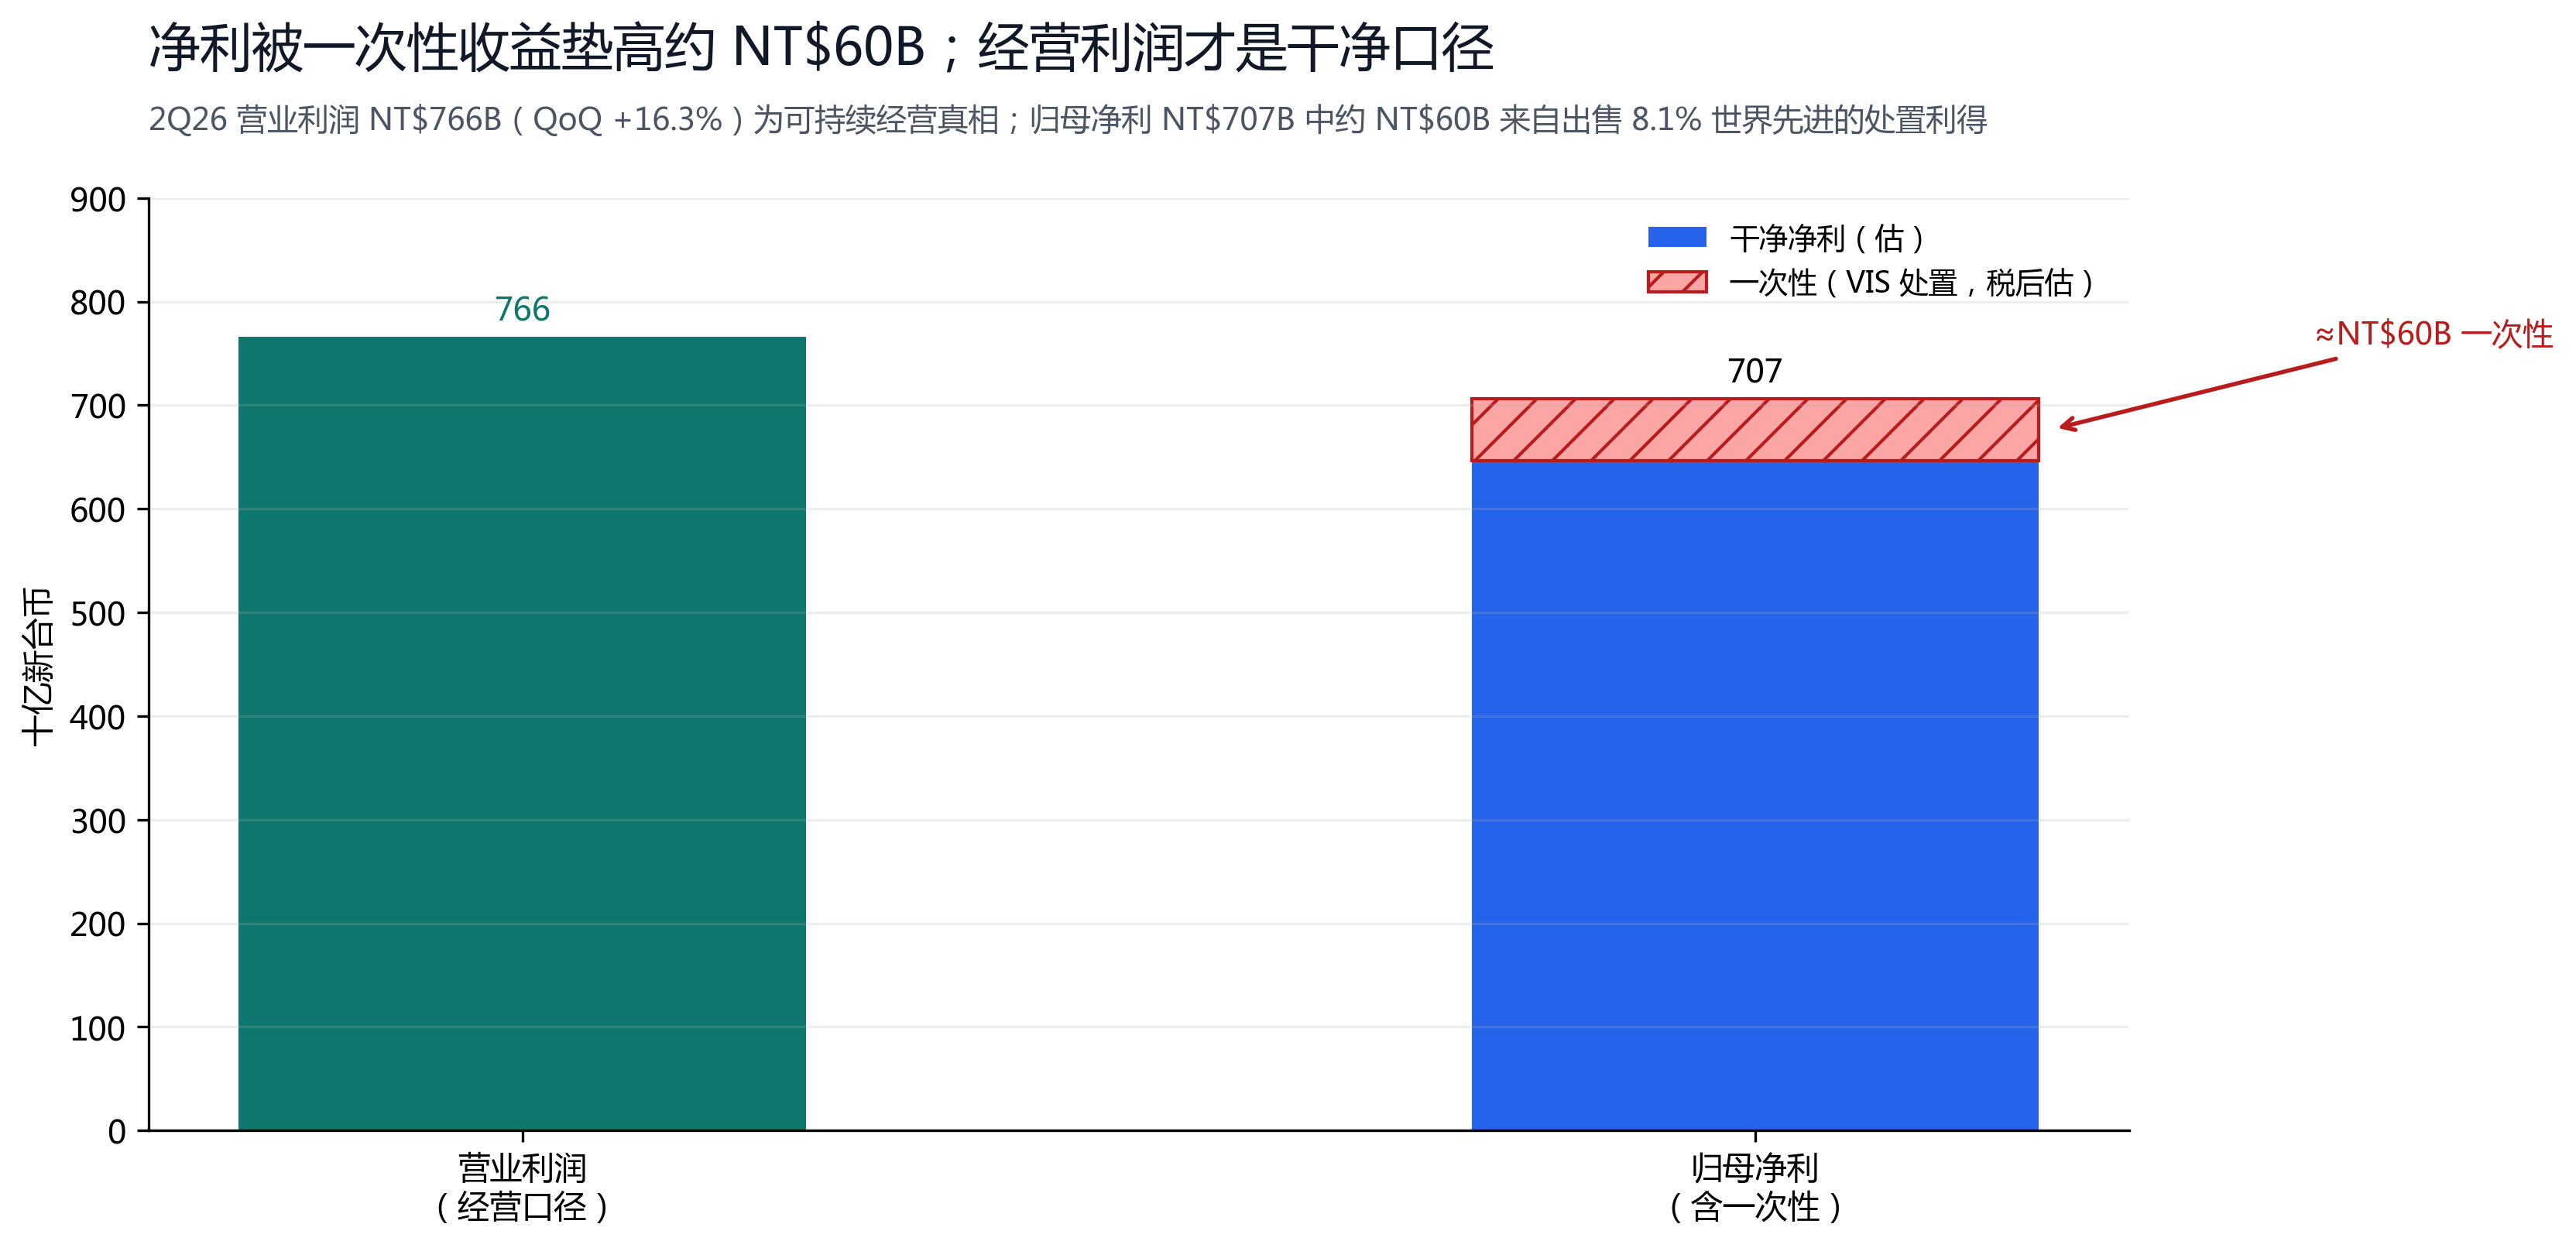
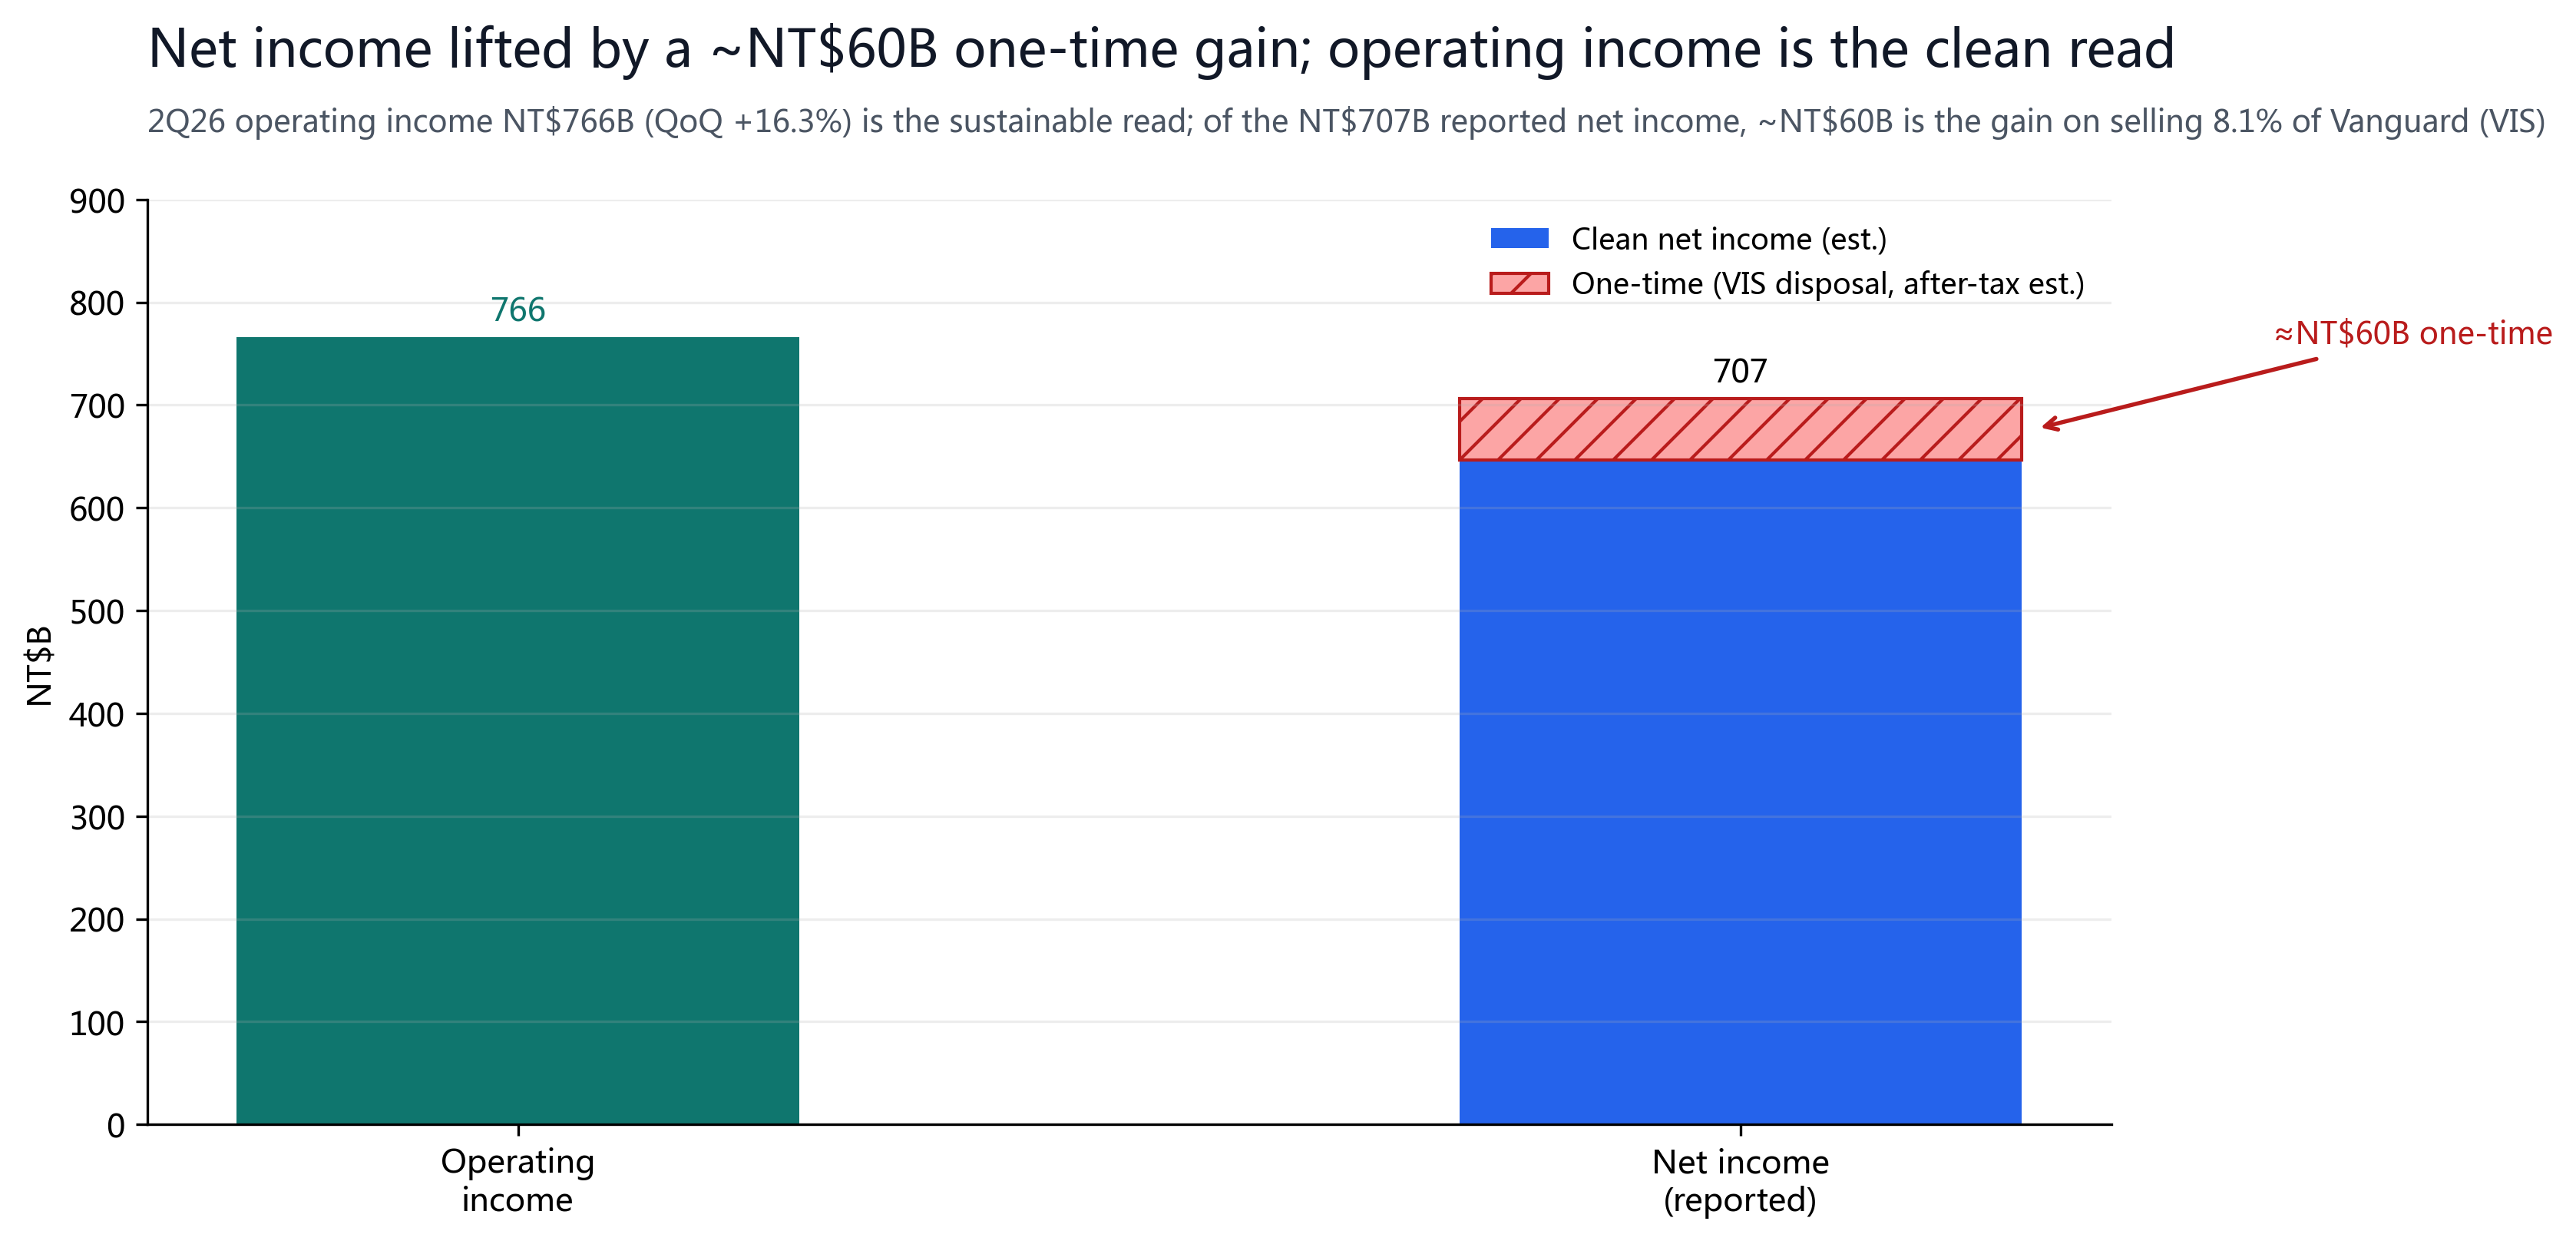
We rate TSM Overweight (Buy) with a 12-month price target of $500, about 25% above the current $398.37. One caveat: this quarter's net income and EPS were lifted by a one-time gain on the sale of Vanguard (VIS) shares — the 60.3% operating margin is the sustainable read.
§01Investment Summary
The thesis on TSMC is simple: nearly every advanced AI chip in the world — from Nvidia and AMD to Apple and Broadcom — is manufactured at this one company. It is the most certain “picks-and-shovels” play in the AI arms race, with essentially no real competitor at the leading edge. Q2 confirmed that pricing power: revenue reached the top of guidance, and both gross and operating margins beat the top of guidance and set records.
Four reasons to buy: (1) AI/HPC is now 66% of revenue, up +20% QoQ and the only strong driver this quarter; (2) a record 60.3% operating margin, with advanced nodes (≤7nm) at 77% of revenue, shows pricing power converting to profit; (3) 2nm (N2) entered its first ramp quarter, adding a fresh volume-and-price layer for 2026-2027; (4) a fortress balance sheet with ~NT$2.65T net cash and a 45.9% annualized ROE.
Key caveat: this quarter's net income/EPS were lifted by a one-time gain on the Vanguard (VIS) sale, so valuation should anchor on operating income and forward EPS, not this quarter's GAAP net income.
§02Price and Street View
| Metric | Value | Source / Note |
|---|---|---|
| Current price (TSM ADR) | $398.37 | Yahoo Finance · Jul 17 close |
| Market cap | $2.07T | 398.37 × 5,186.47M ADR-equiv |
| Local 2330.TW | NT$2,290 | ADR ~12% premium to local (spot FX 32.33) |
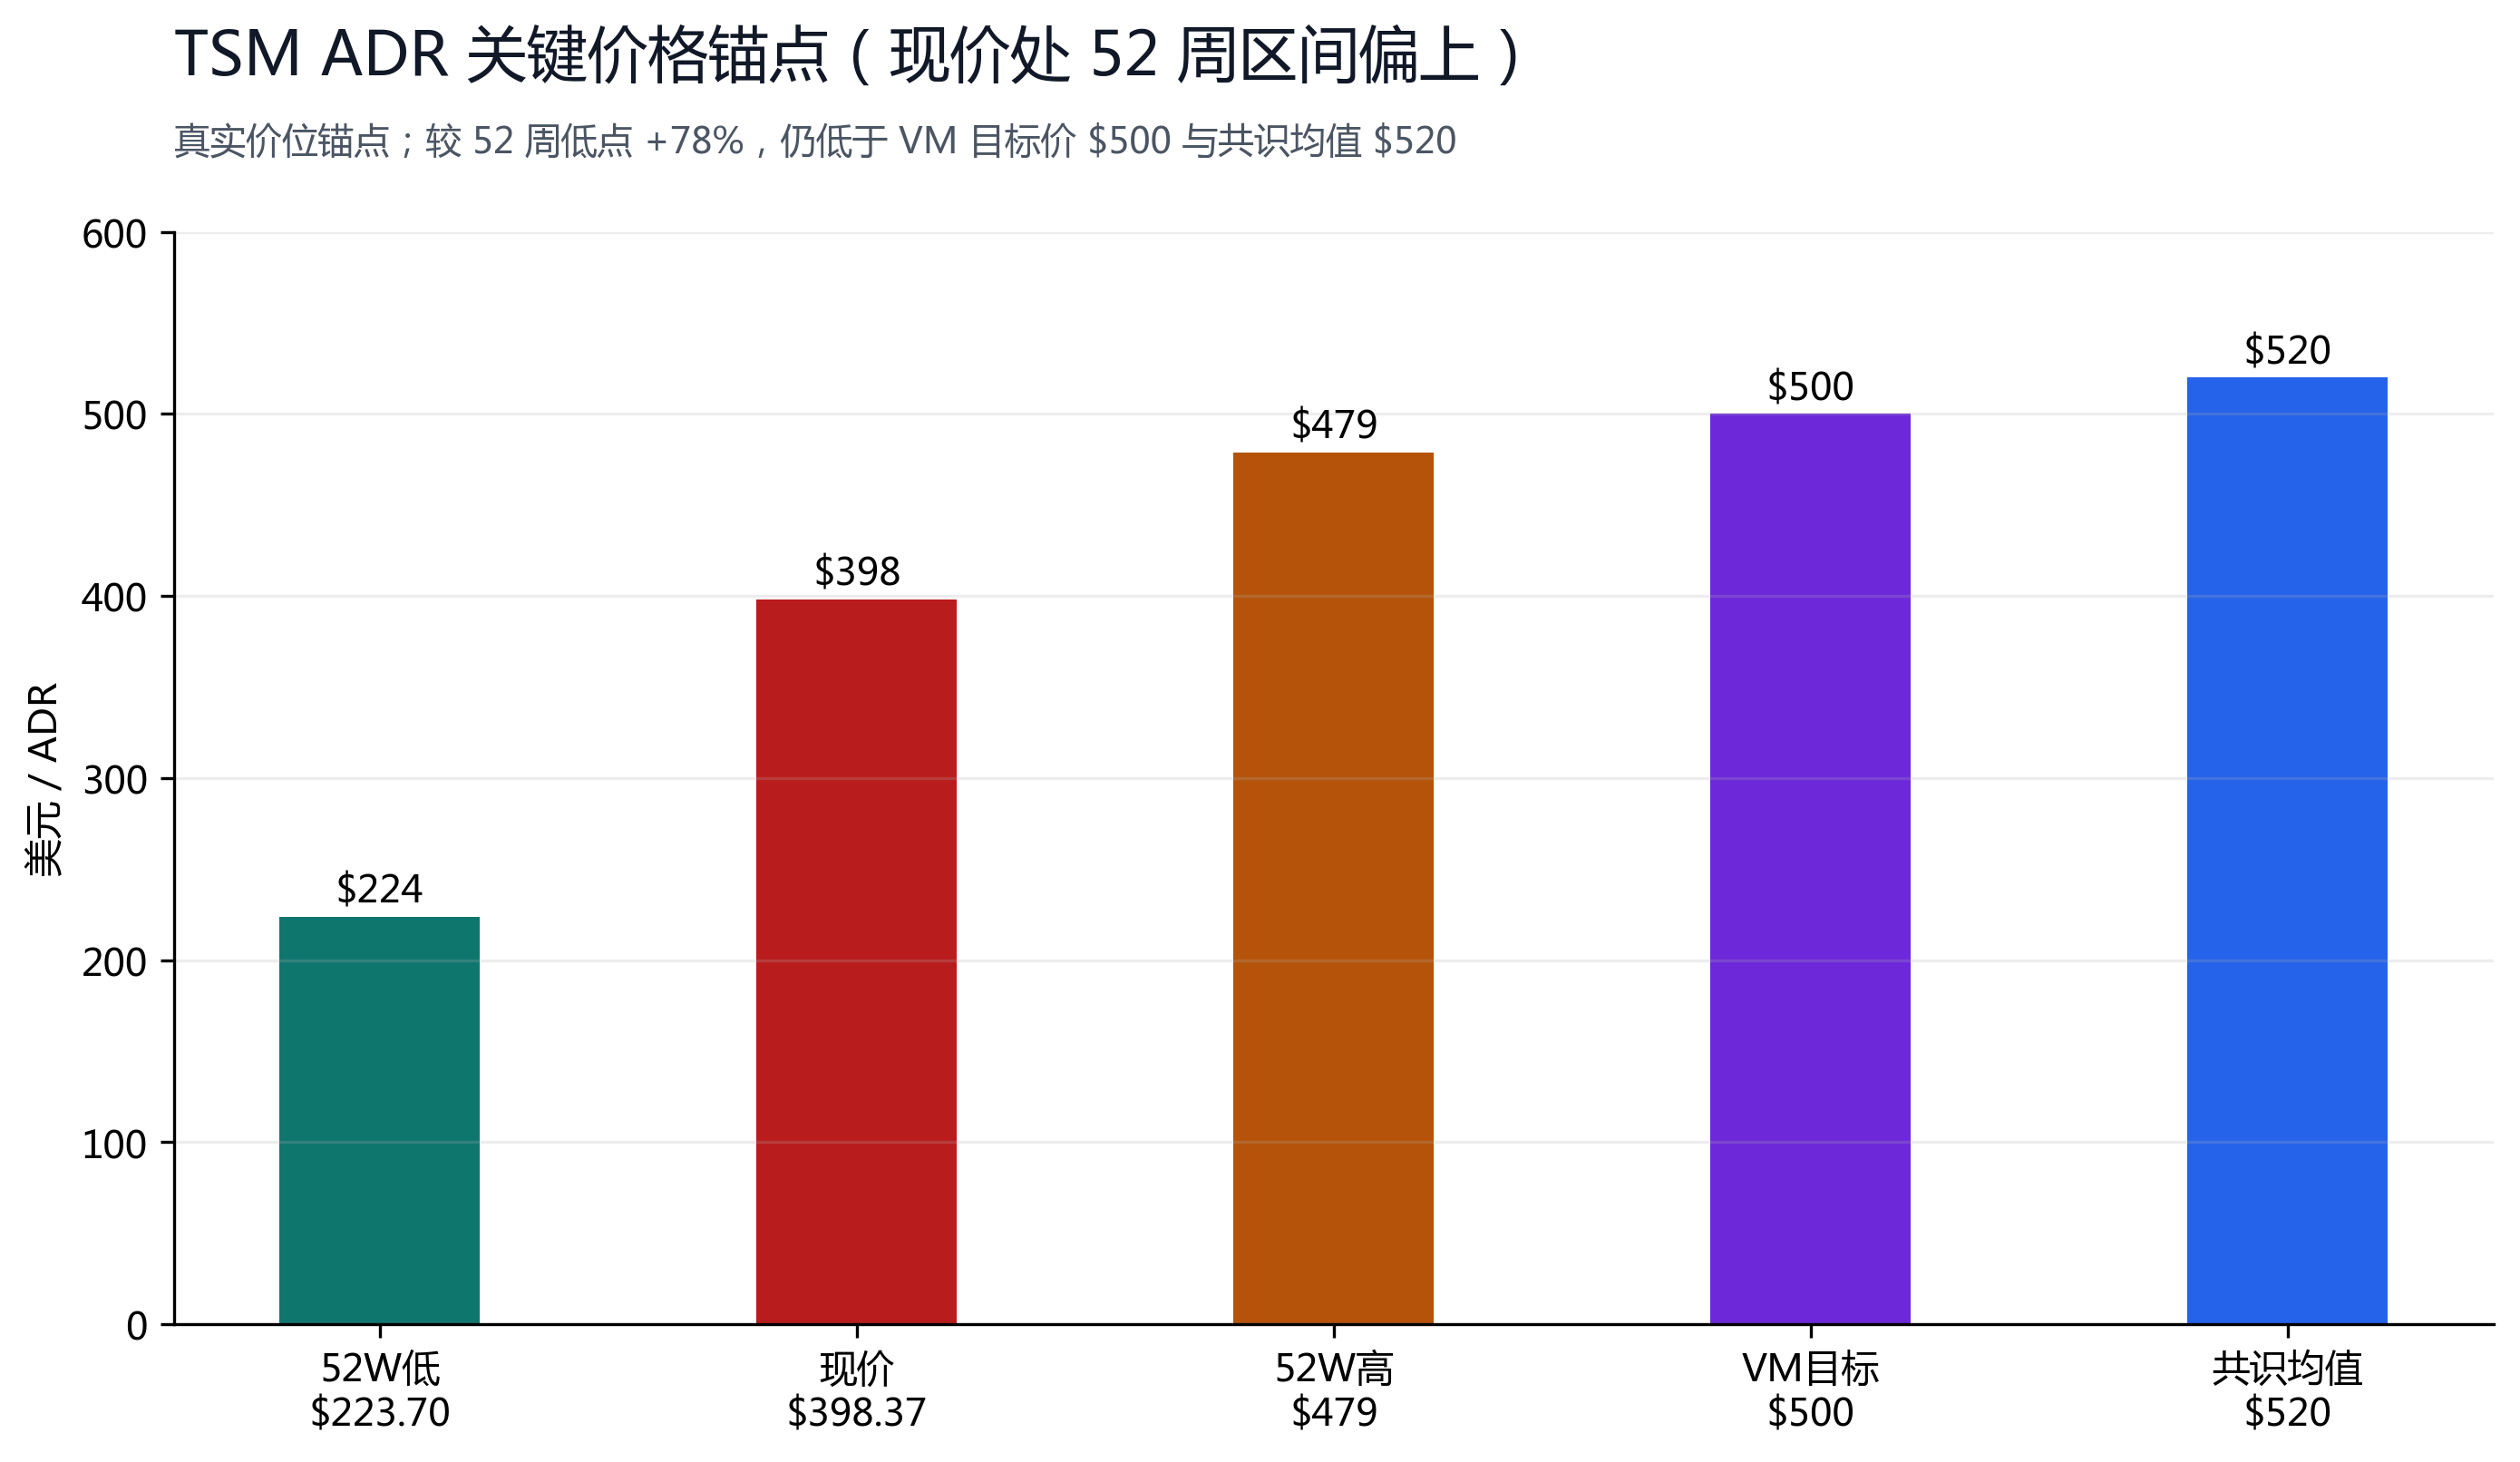
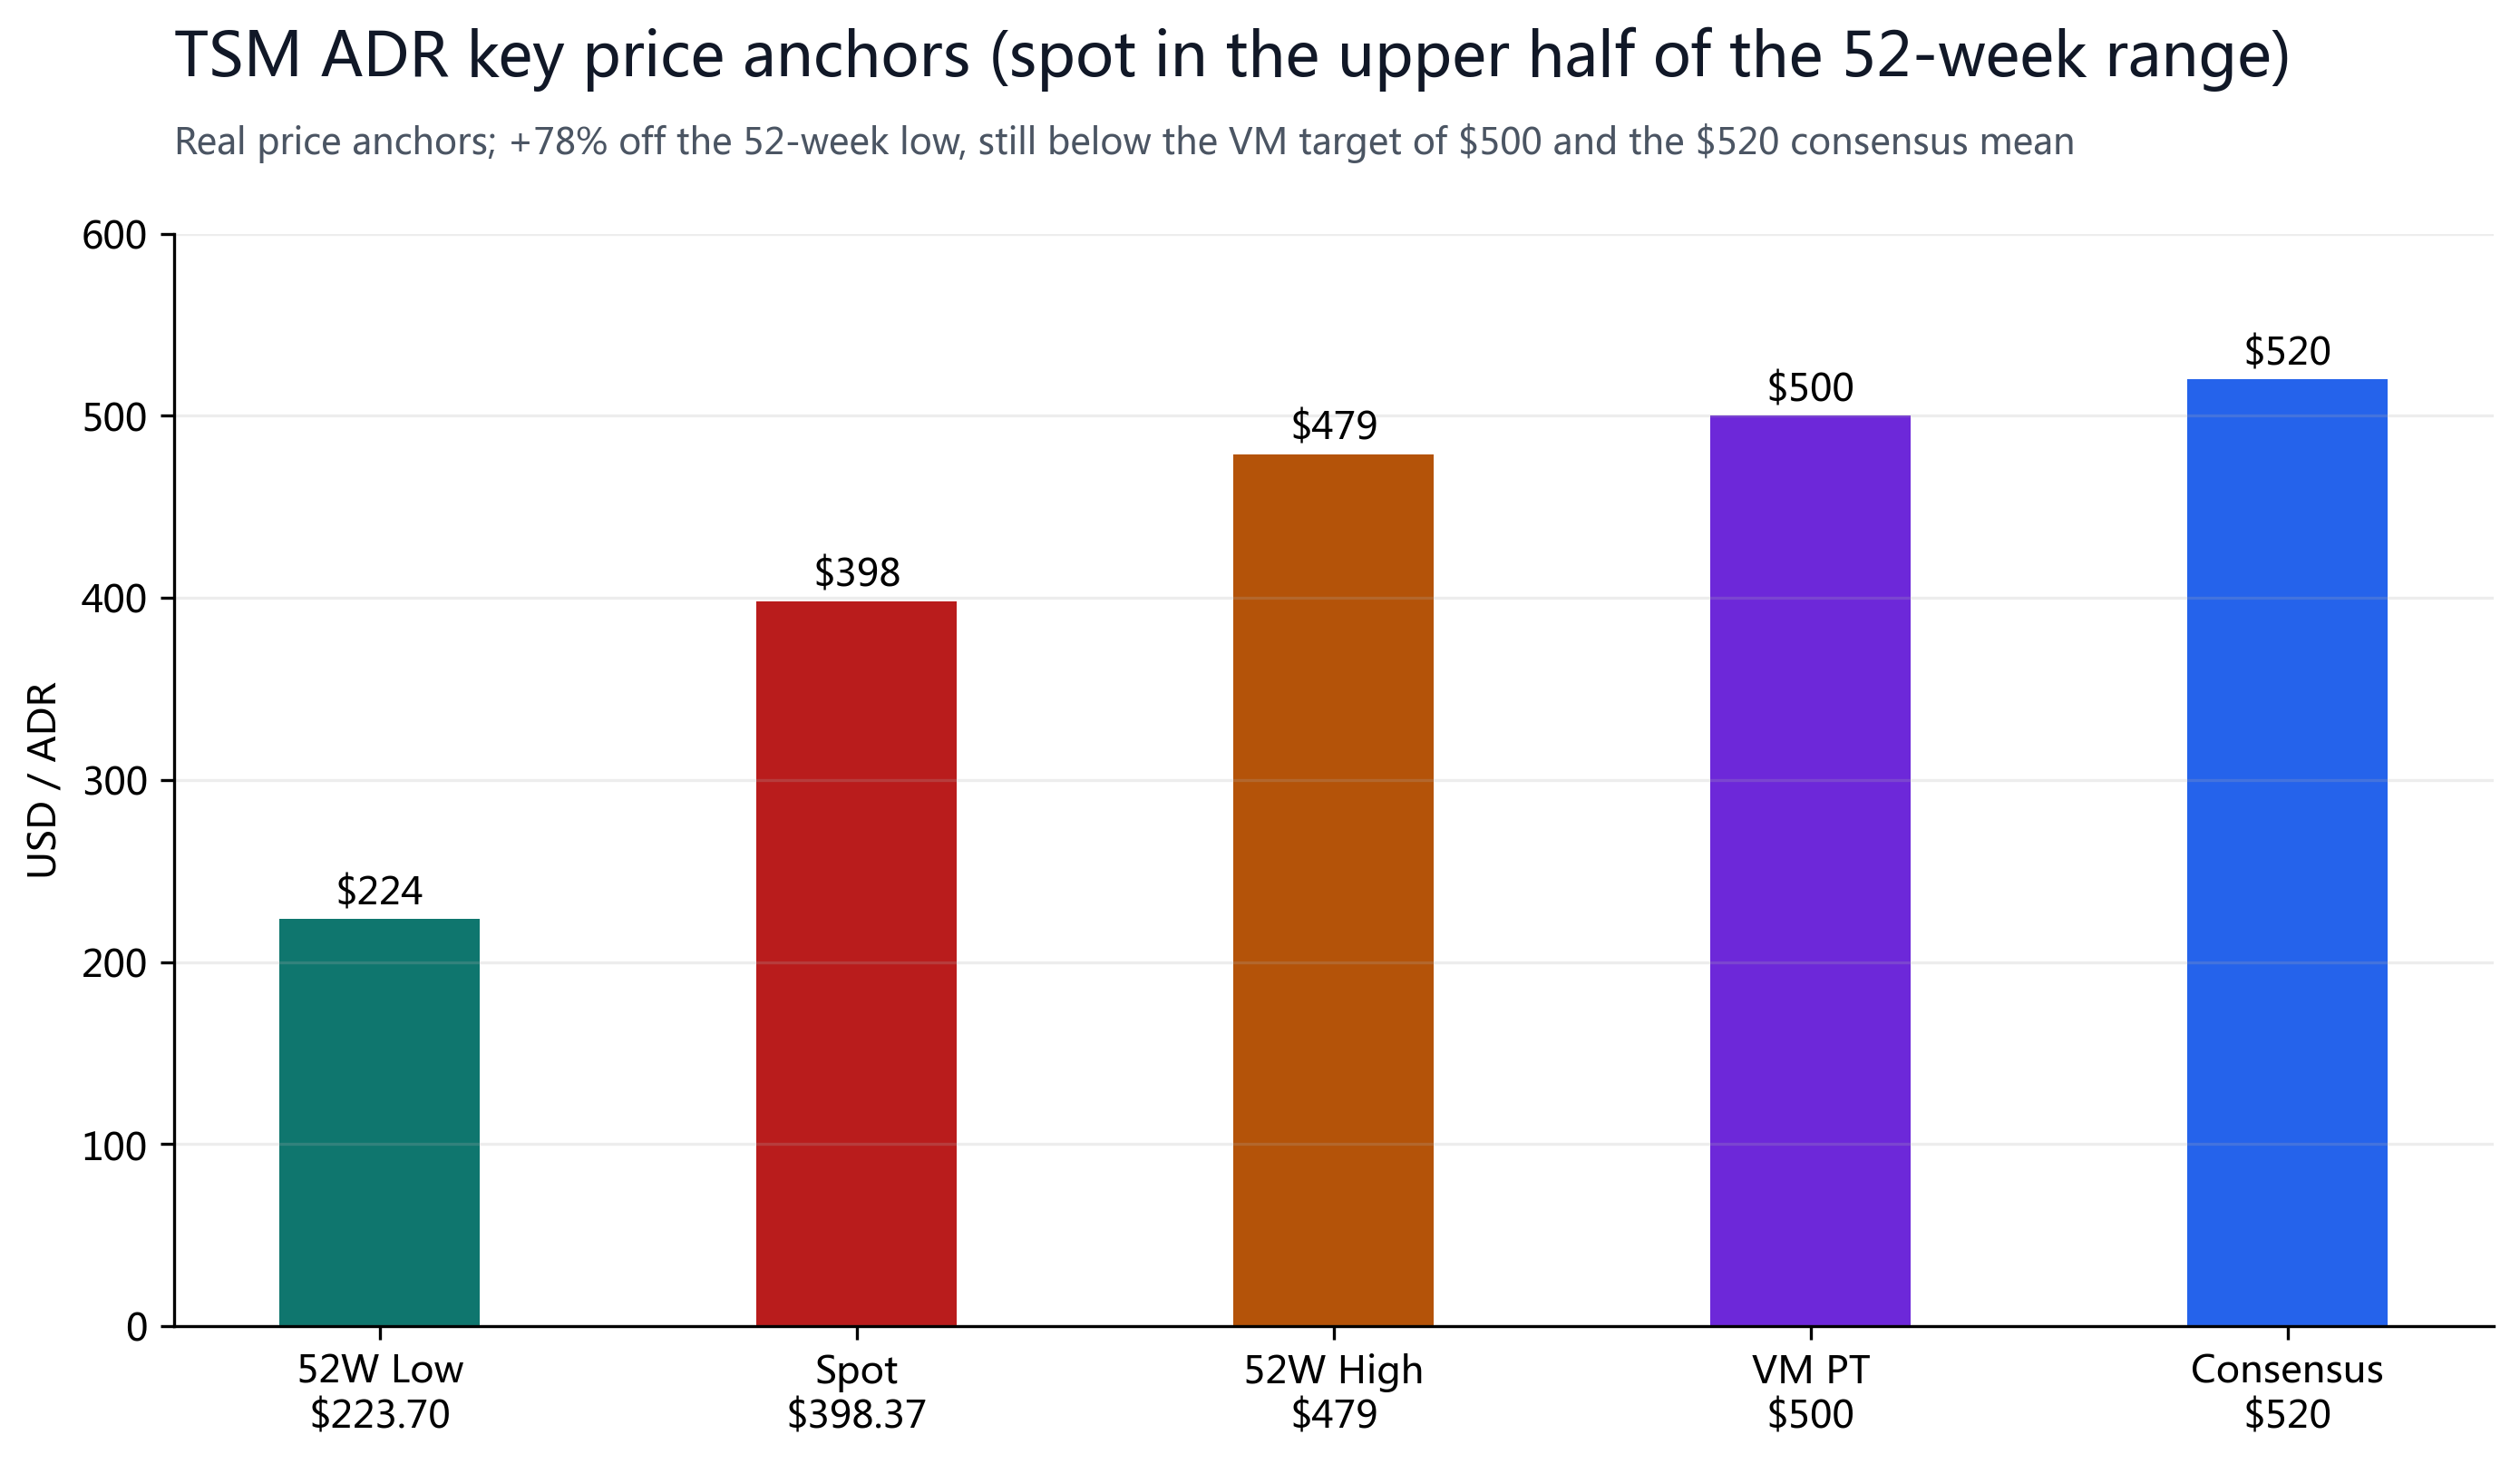
| 52W range | $223.70-$479 | spot +78% off the low, in the upper half |
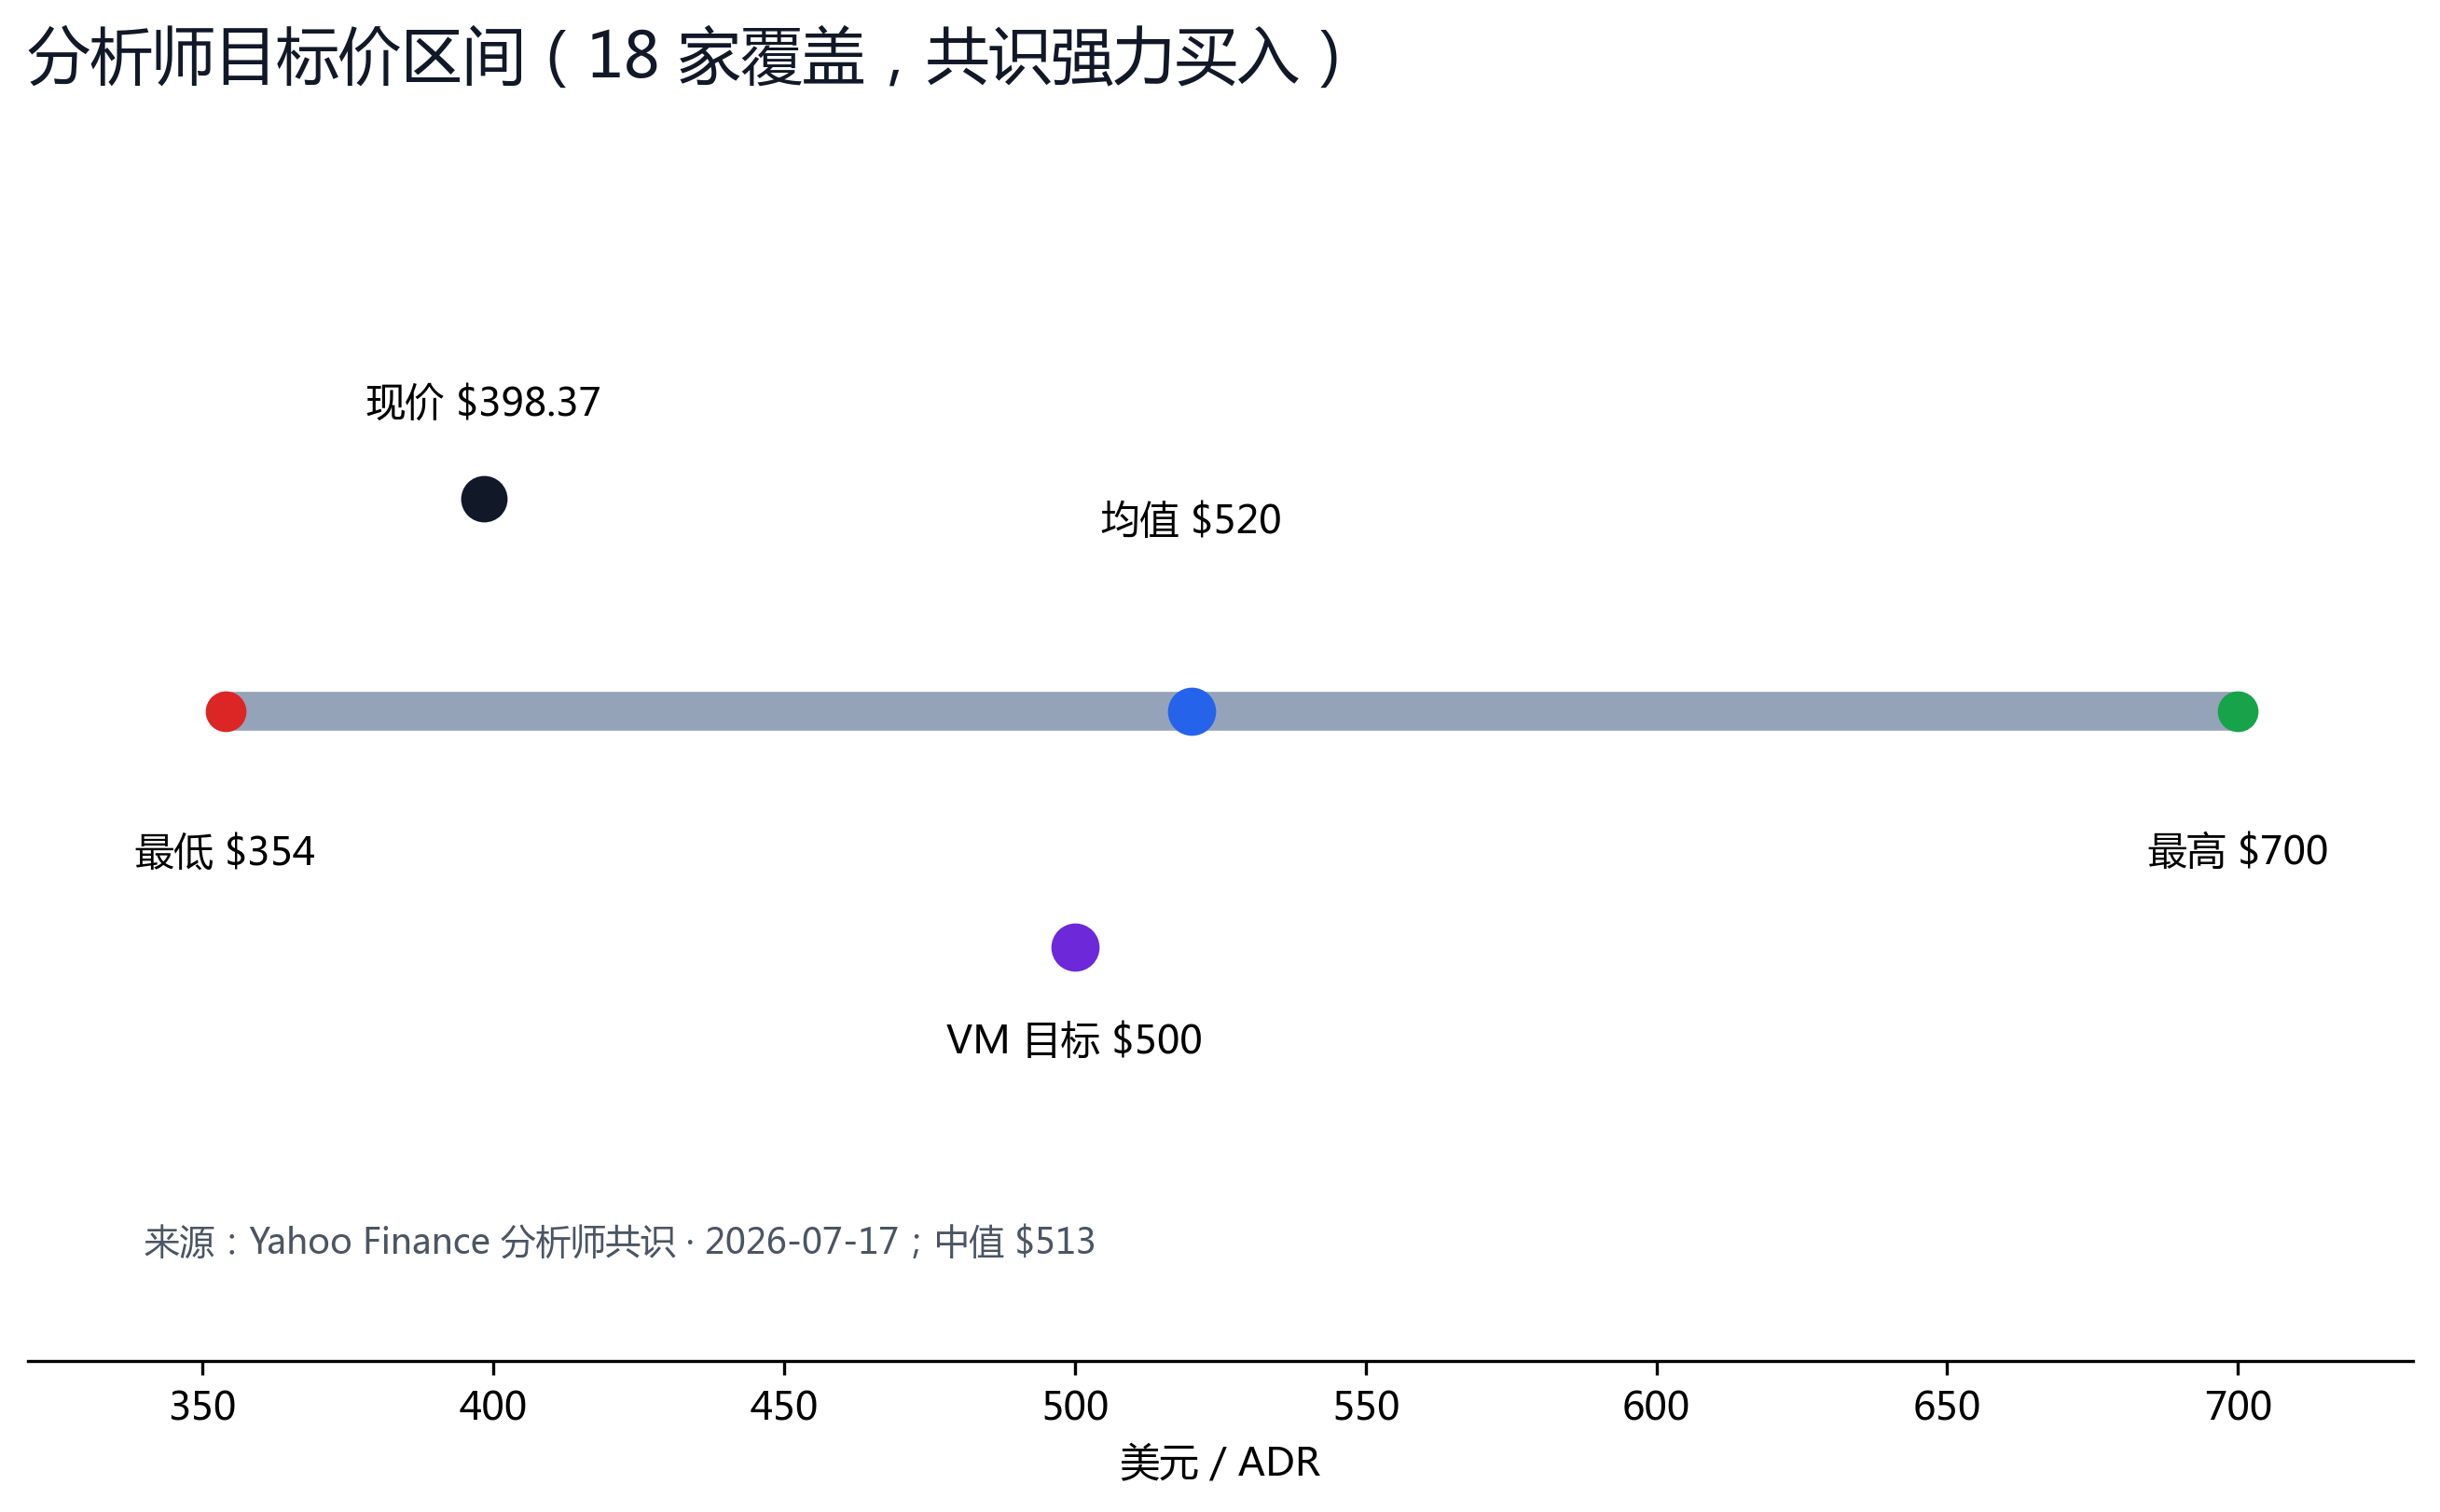
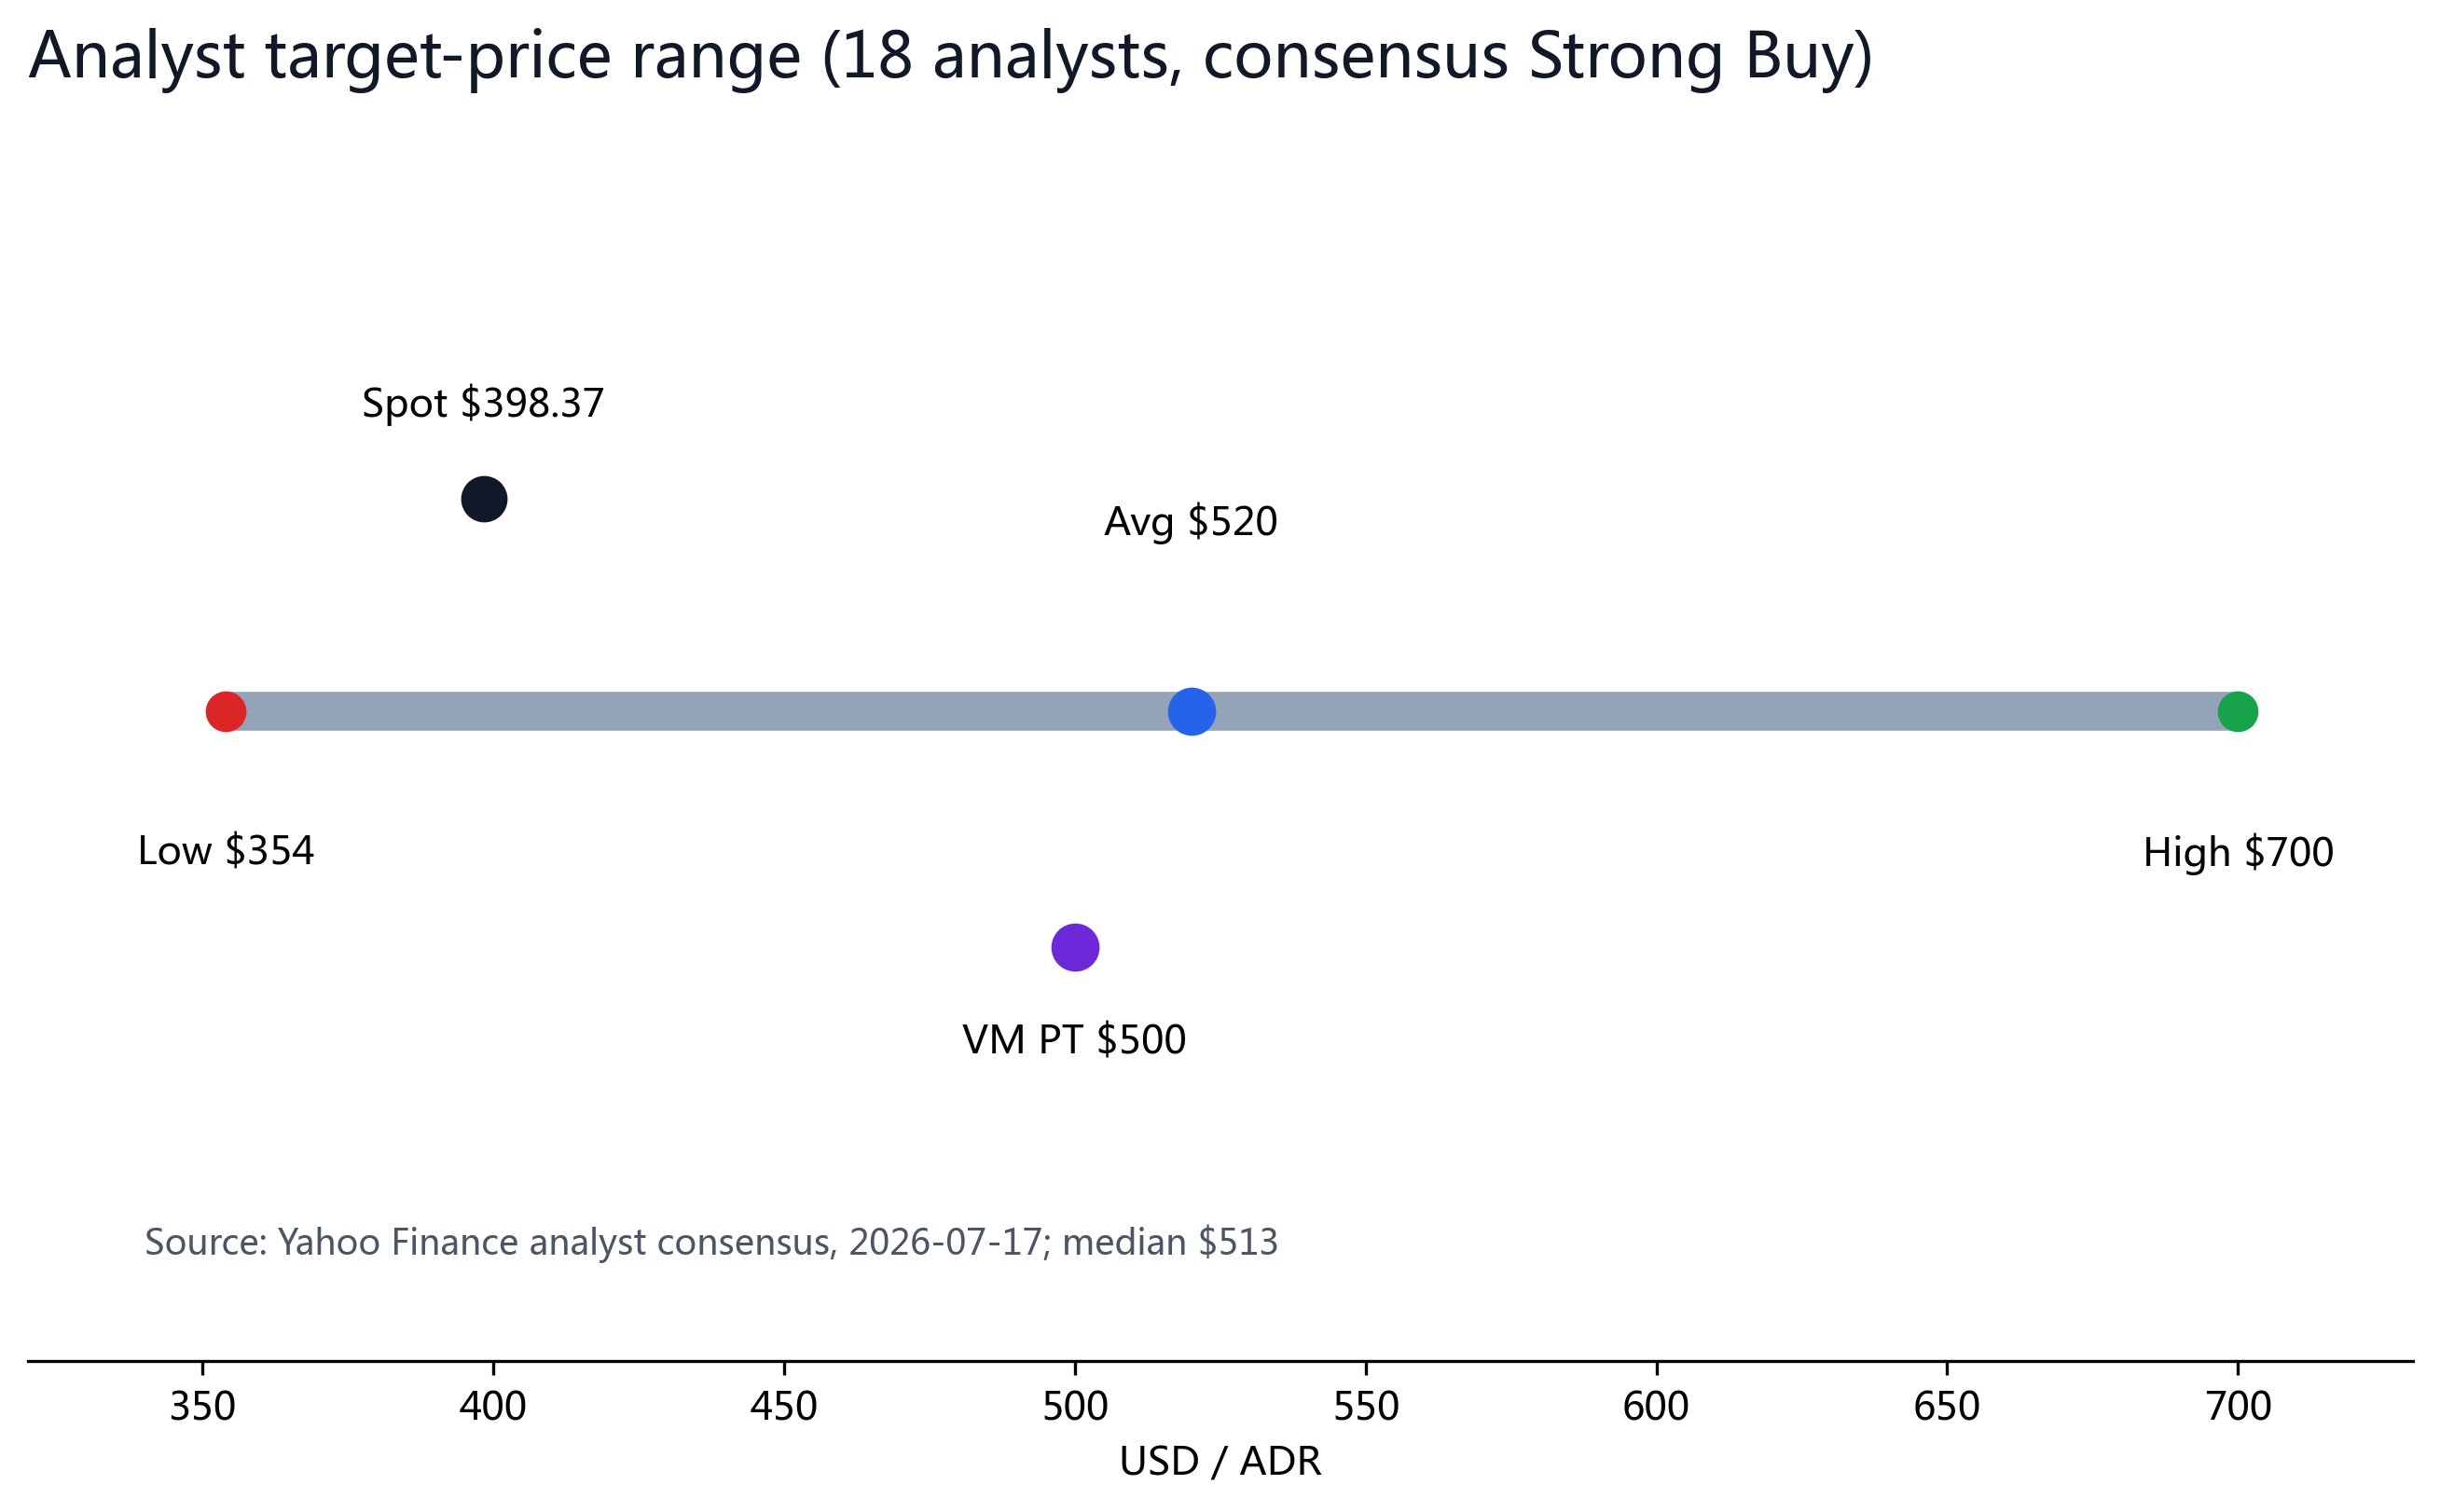
| Analyst PT | $354 / $520 / $700 | Low / Avg / High · median $513 |
| Consensus | Strong Buy | 18 analysts · rating mean 1.42 |
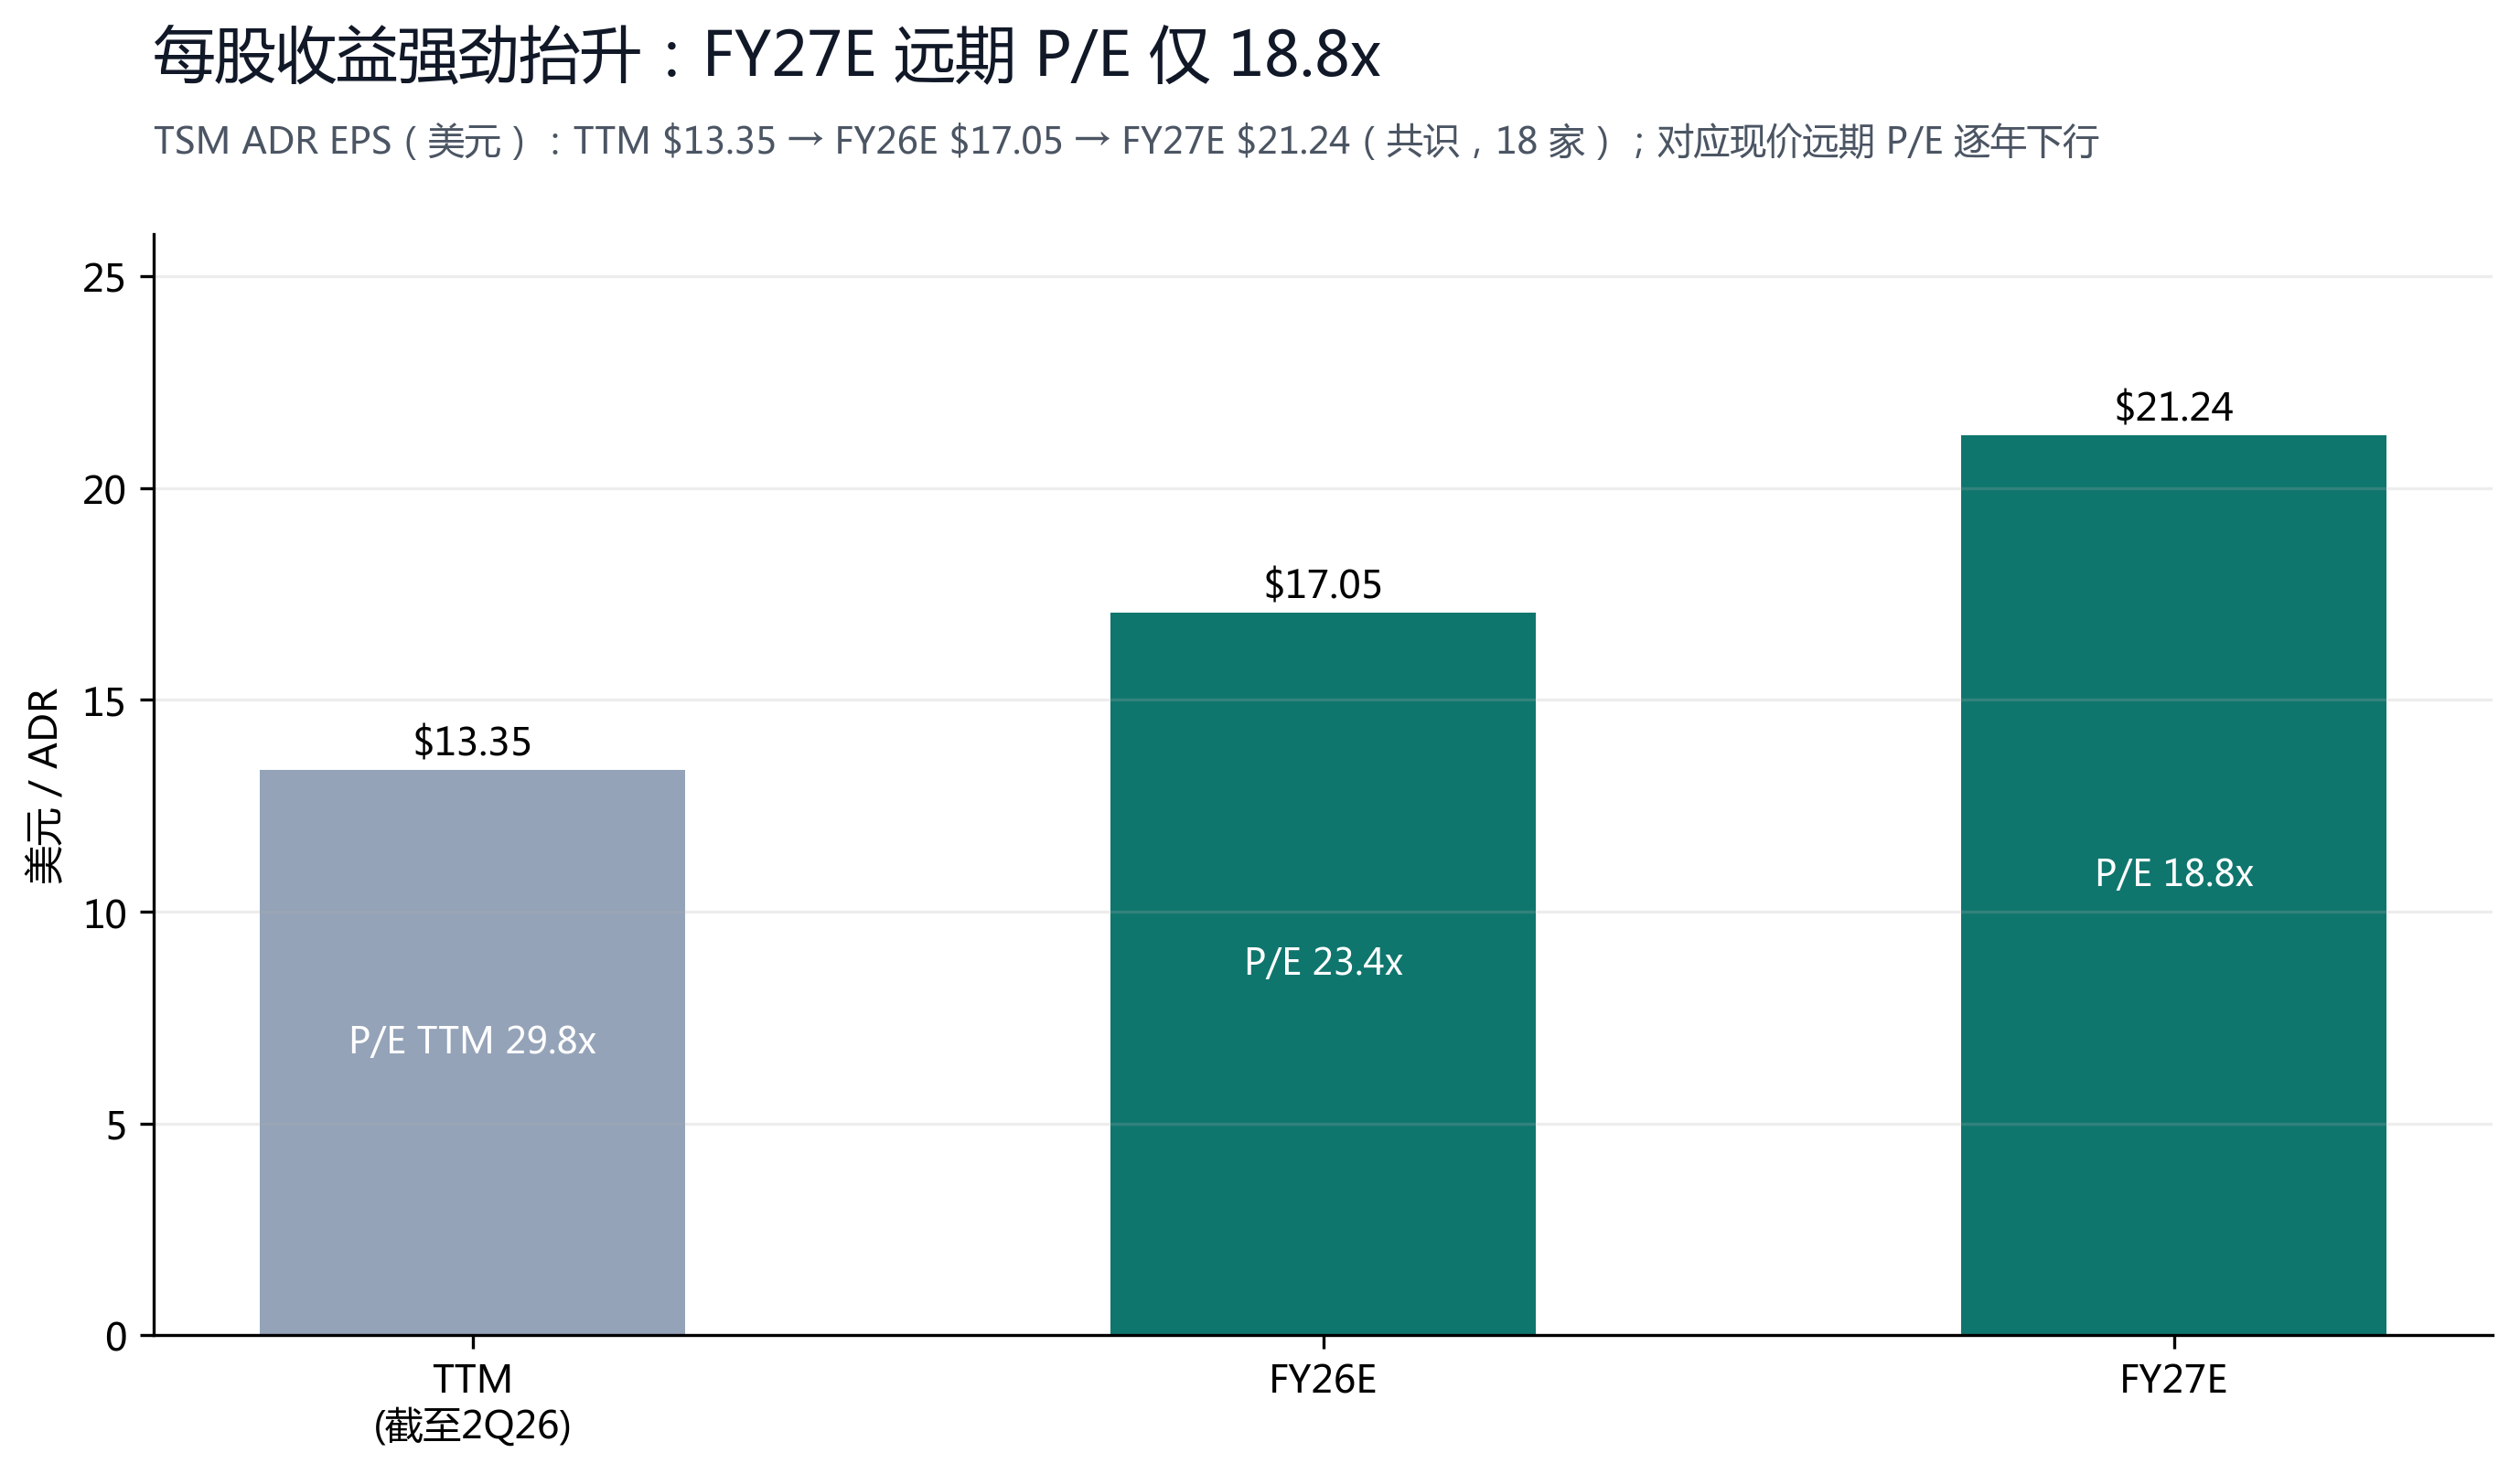
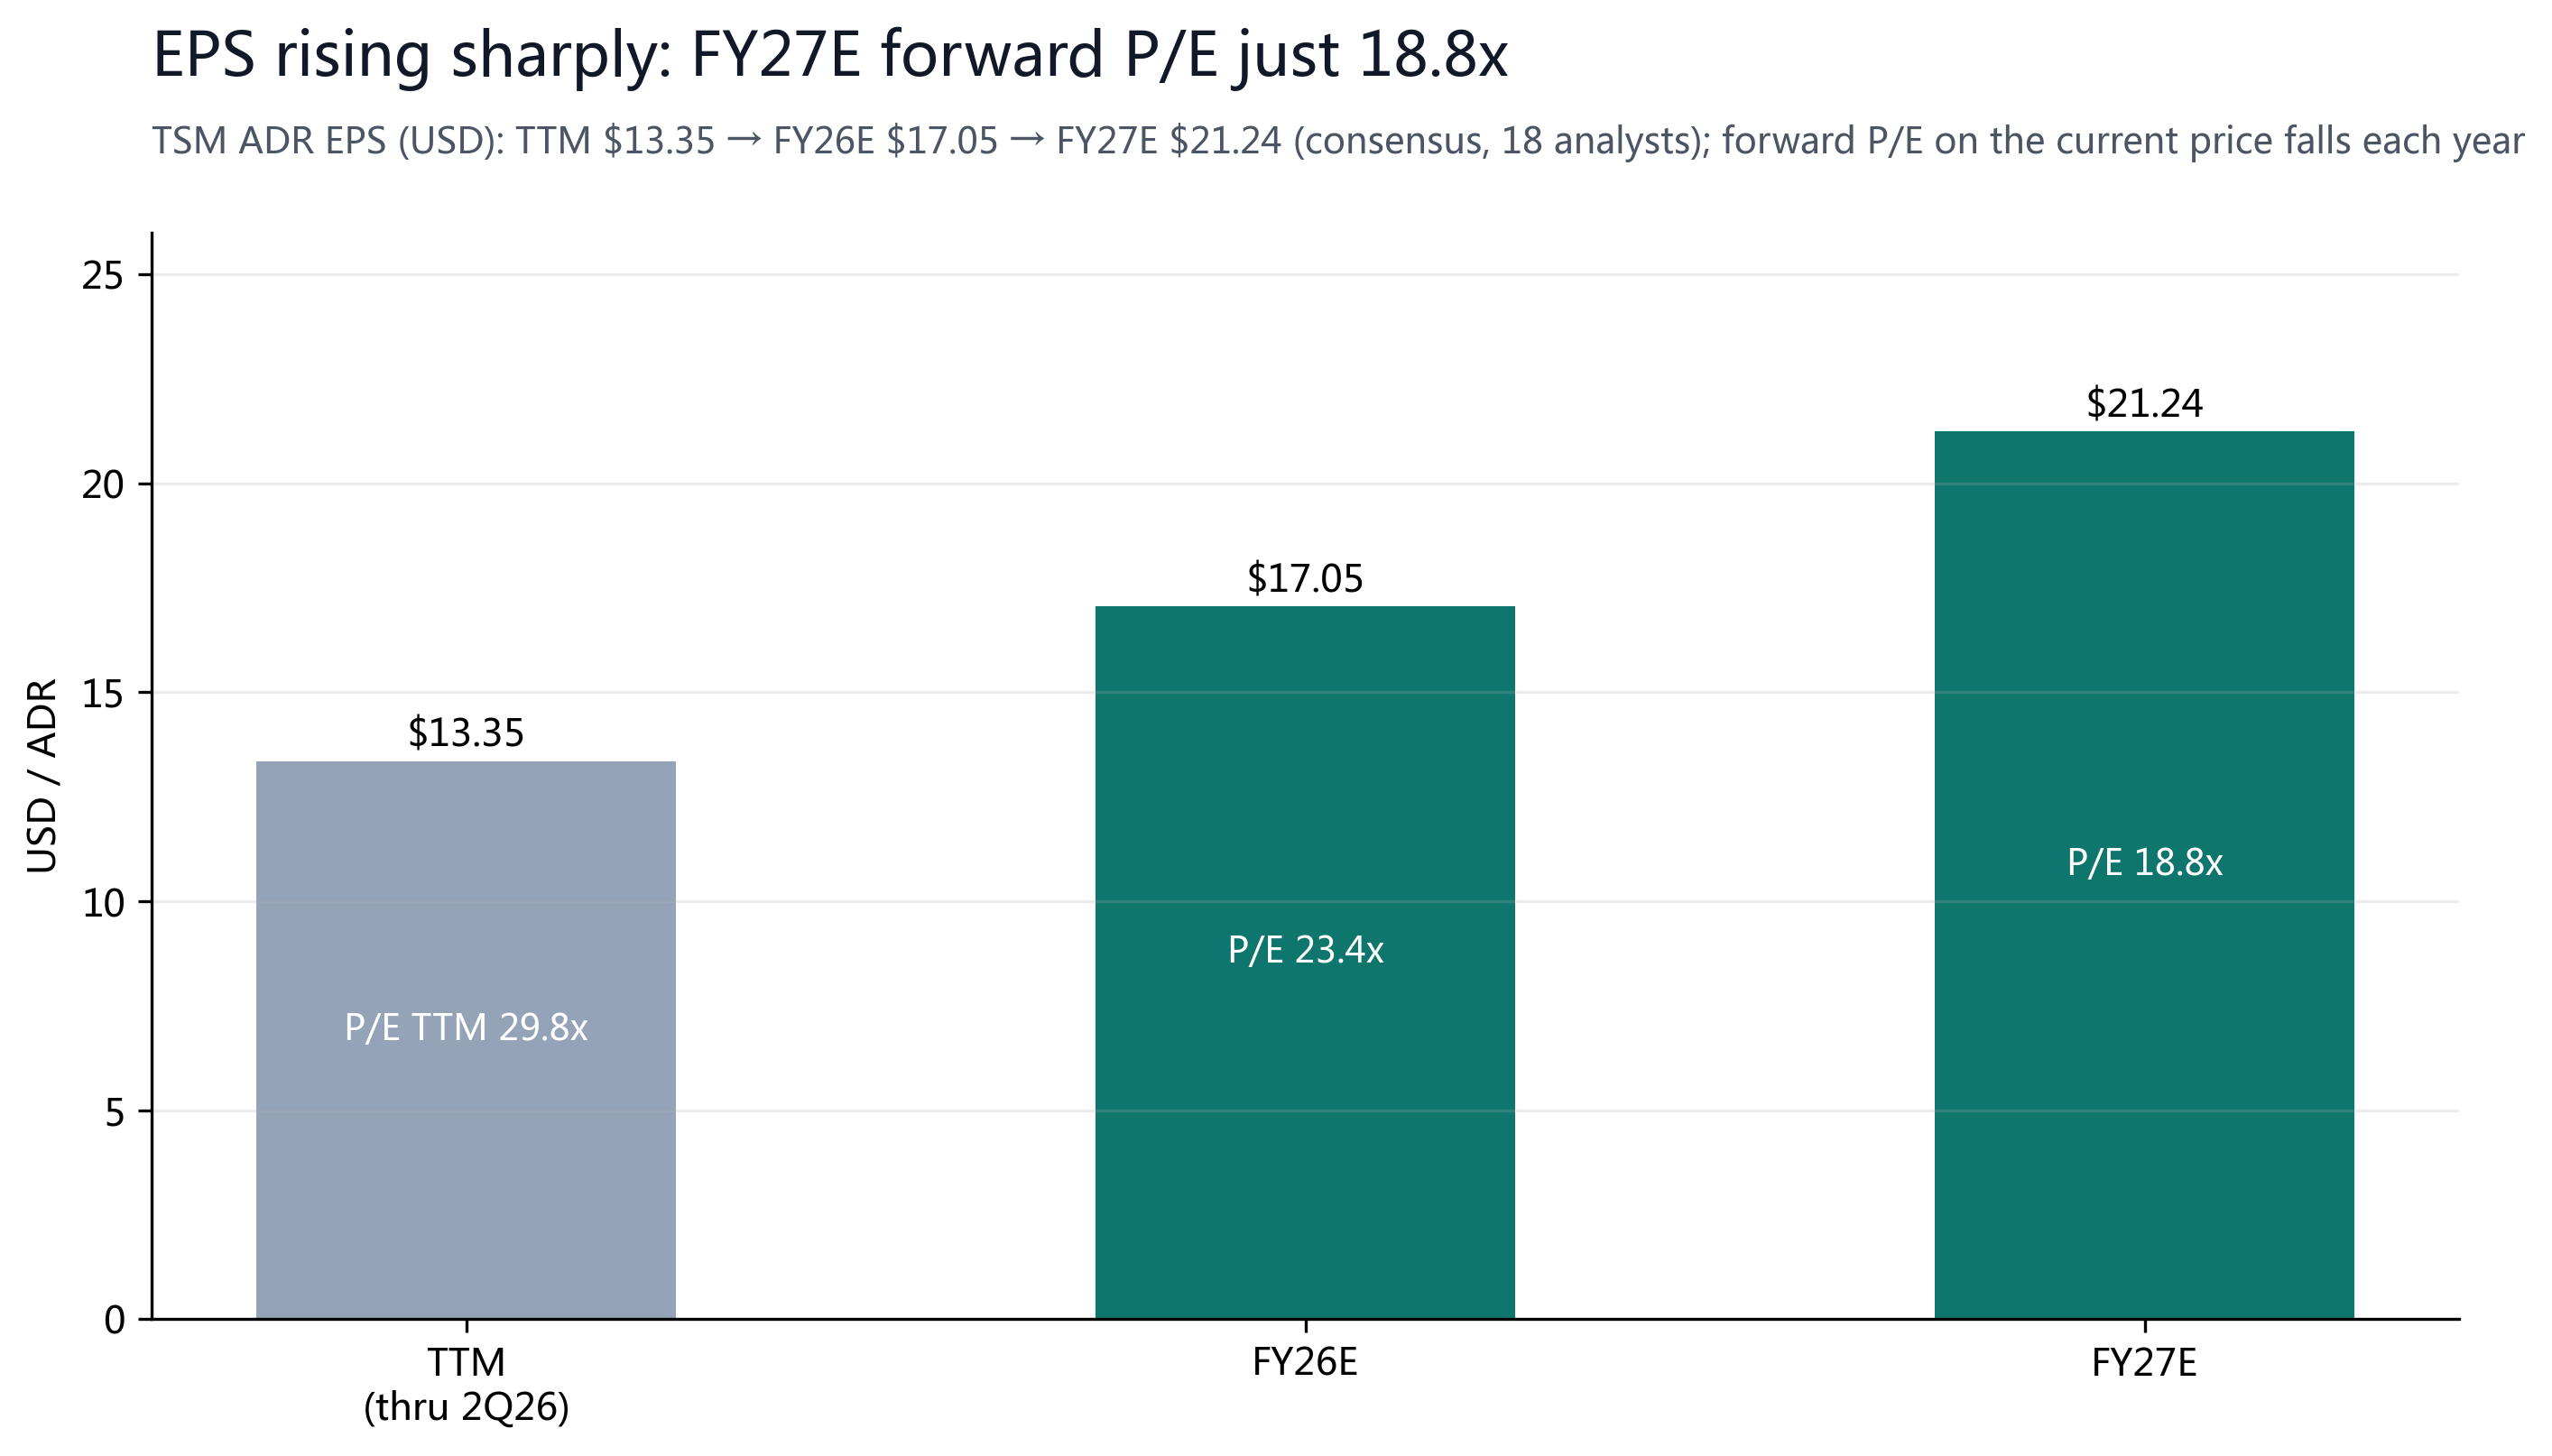
| Forward P/E | 23.4x / 18.8x | FY26E $17.05 / FY27E $21.24 (consensus EPS) |
TSMC has two prices: it lists in the U.S. as an ADR (NYSE:TSM, one ADR = five local shares) and in Taiwan as a local share (2330.TW). The ADR usually trades at a premium to the local shares — about 12% currently — reflecting U.S. investors' appetite for the AI theme and the convenience of USD access. This report's rating and target are in ADR (USD) terms, while operating financials follow the company's official NT$ reporting. The stock is up 78% off its 52-week low and in the upper half of the range, yet still below the $520 average target of all 18 analysts, and below our $500.
§03Bull/Bear View
Bull: the sole foundry for AI compute, with pricing power converting to margin
TSMC holds a near-monopoly on the most advanced nodes (5nm/3nm/2nm), manufacturing the high-end chips of Nvidia, AMD, Apple, Broadcom, and Google, with no second source able to match its yield and capacity. That exclusivity shows up directly in margins: this quarter's 60.3% operating margin set a record, the 67.7% gross margin beat the top of guidance, and advanced nodes (≤7nm) are 77% of revenue. The AI/HPC platform grew +20% QoQ to 66% of revenue and was the only strong driver — evidence that AI demand is still accelerating, not peaking. With 2nm ramping, the A13 node unveiled, and a Sony image-sensor partnership, the volume-and-price runway extends for years.
Bear: not cheap, and surging CapEx, geopolitics, and FX are hard constraints
The stock is up 78% off its 52-week low and in the upper half of its range, so the valuation is no longer cheap. Capital spending is the most direct pressure: CapEx jumped to NT$496B this quarter (+41% QoQ), pulling free cash flow down from NT$348B to NT$287B — the AI arms race requires TSMC to keep expanding capacity at huge cost, squeezing near-term FCF. A more structural risk is geopolitical: cross-strait tensions, U.S. chip-export controls on China, and potential tariffs could all disturb supply-demand and capacity footprint; meanwhile a stronger Taiwan dollar erodes the USD translation of revenue. In addition, A/R days rose to 29 and inventory days to 87 — a mild lengthening of working capital worth tracking.
§04Financial Truth
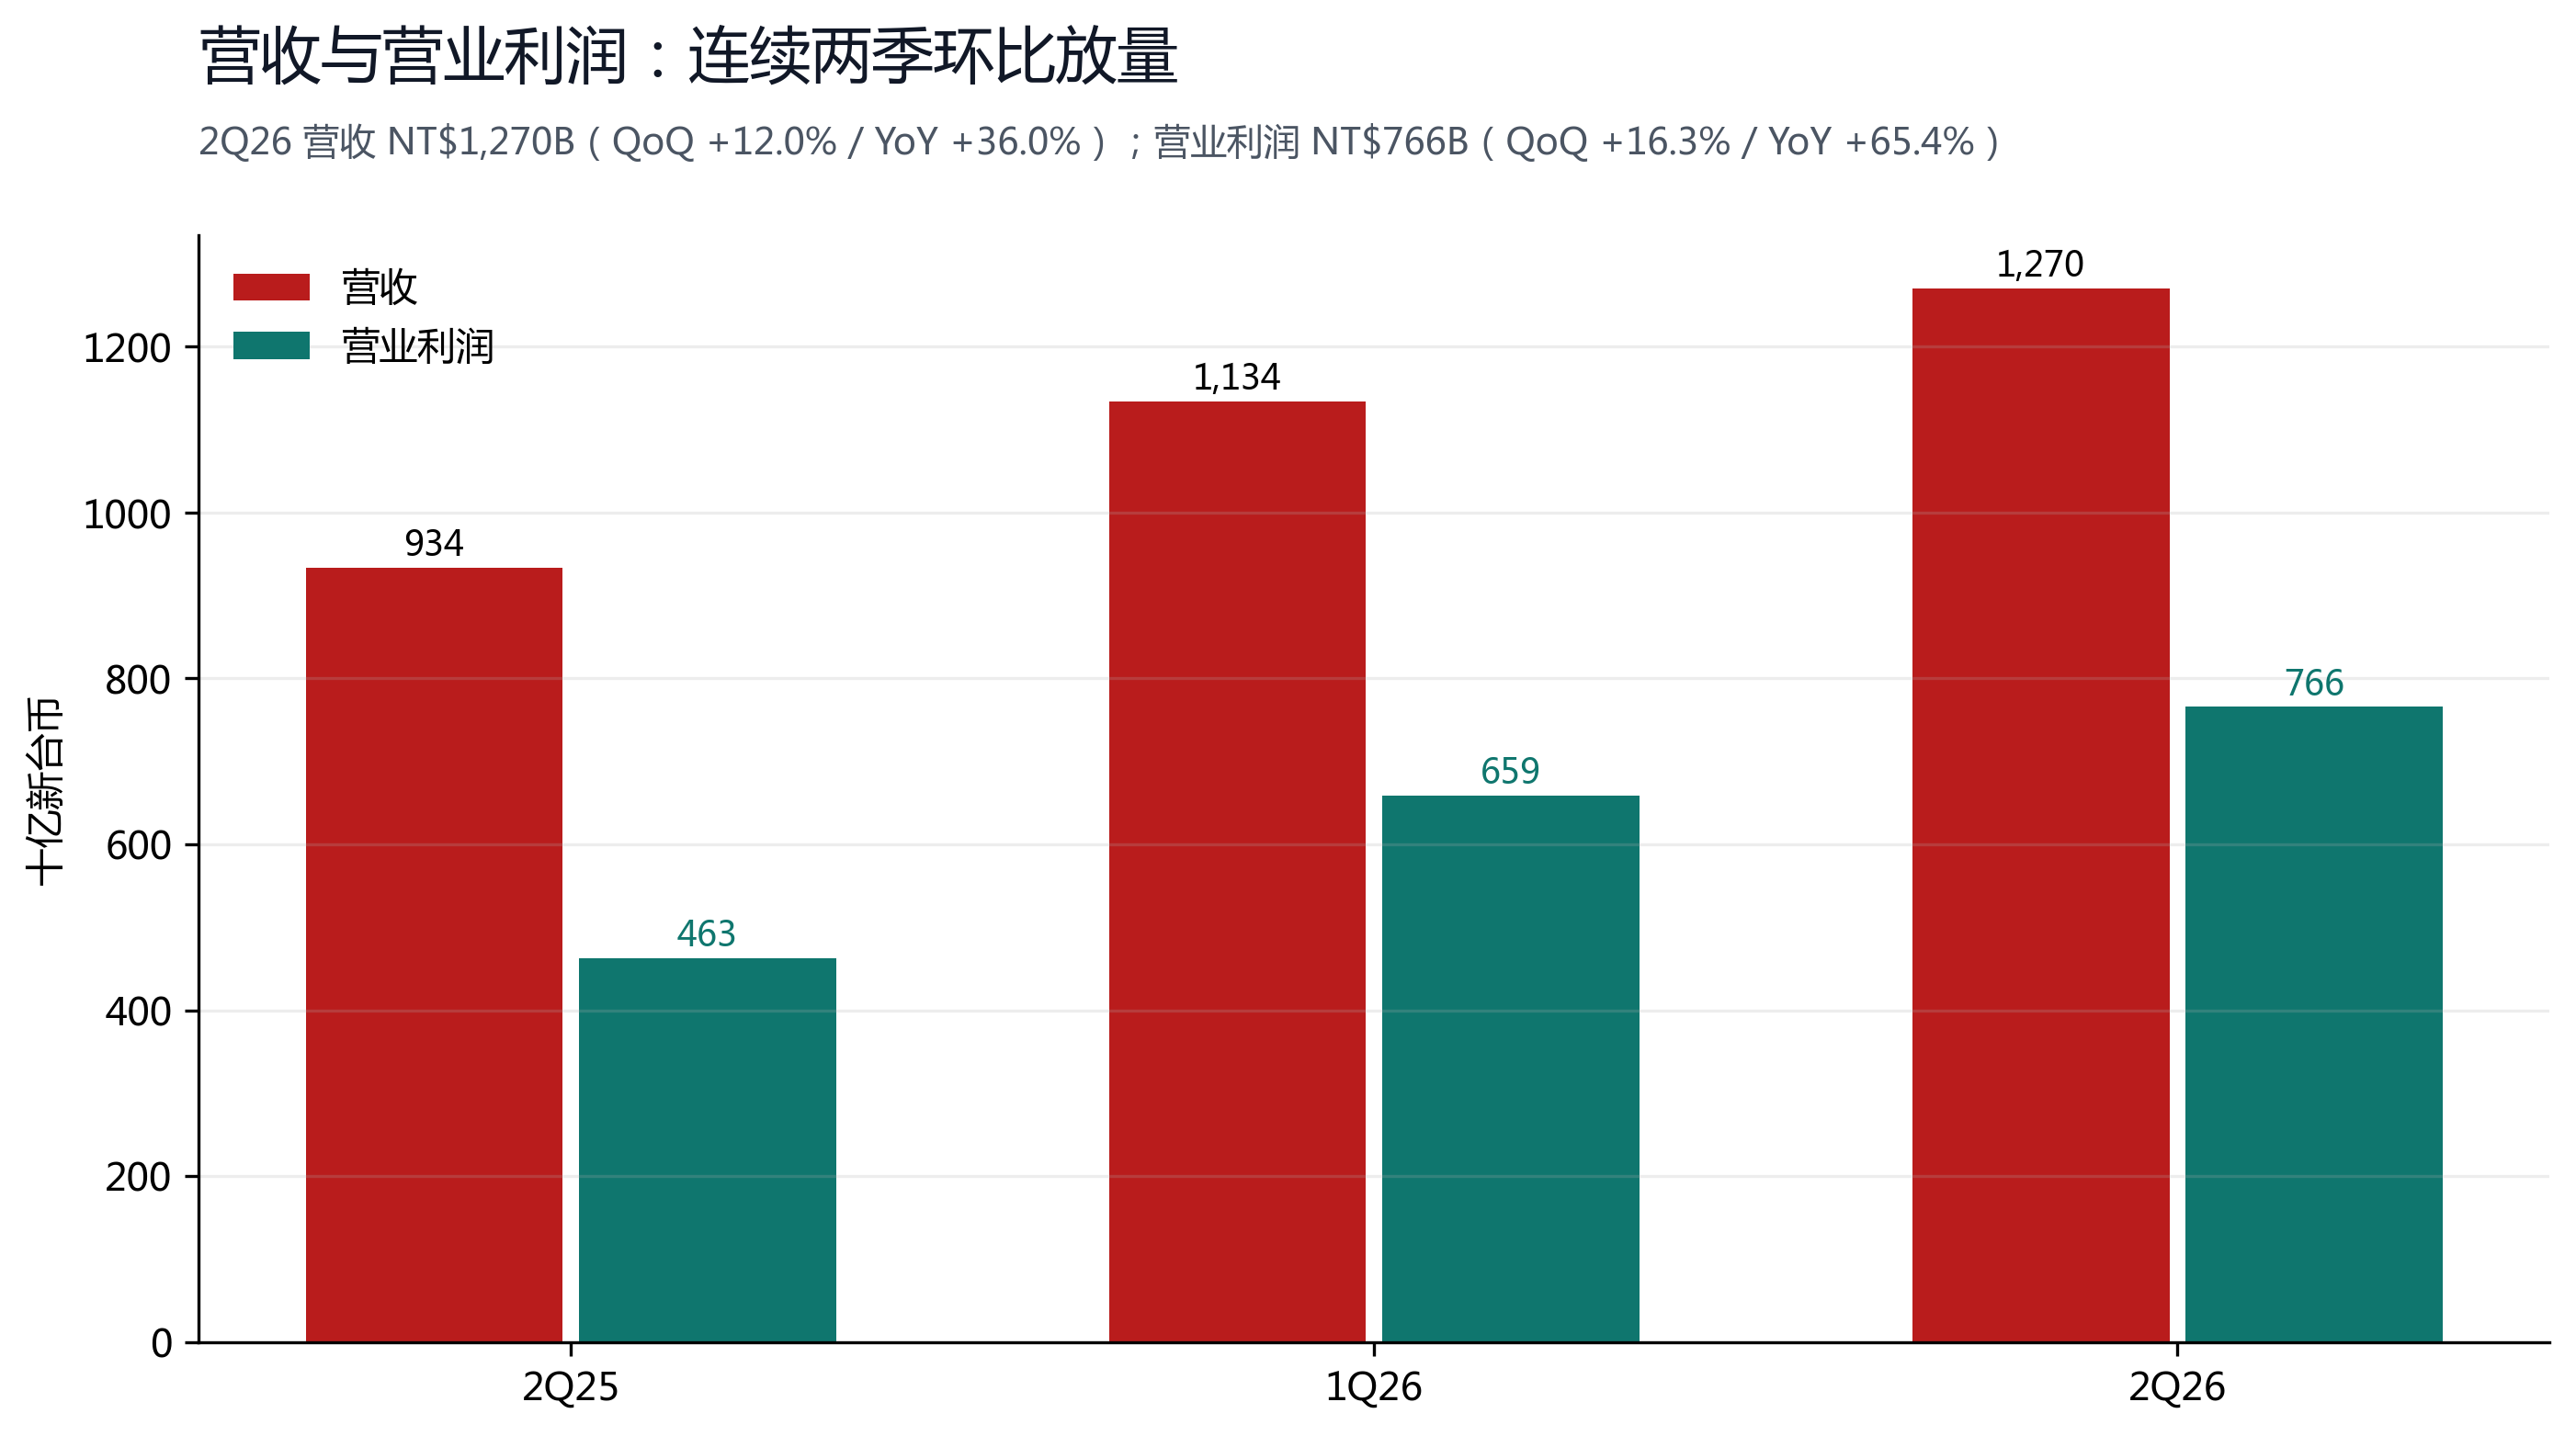
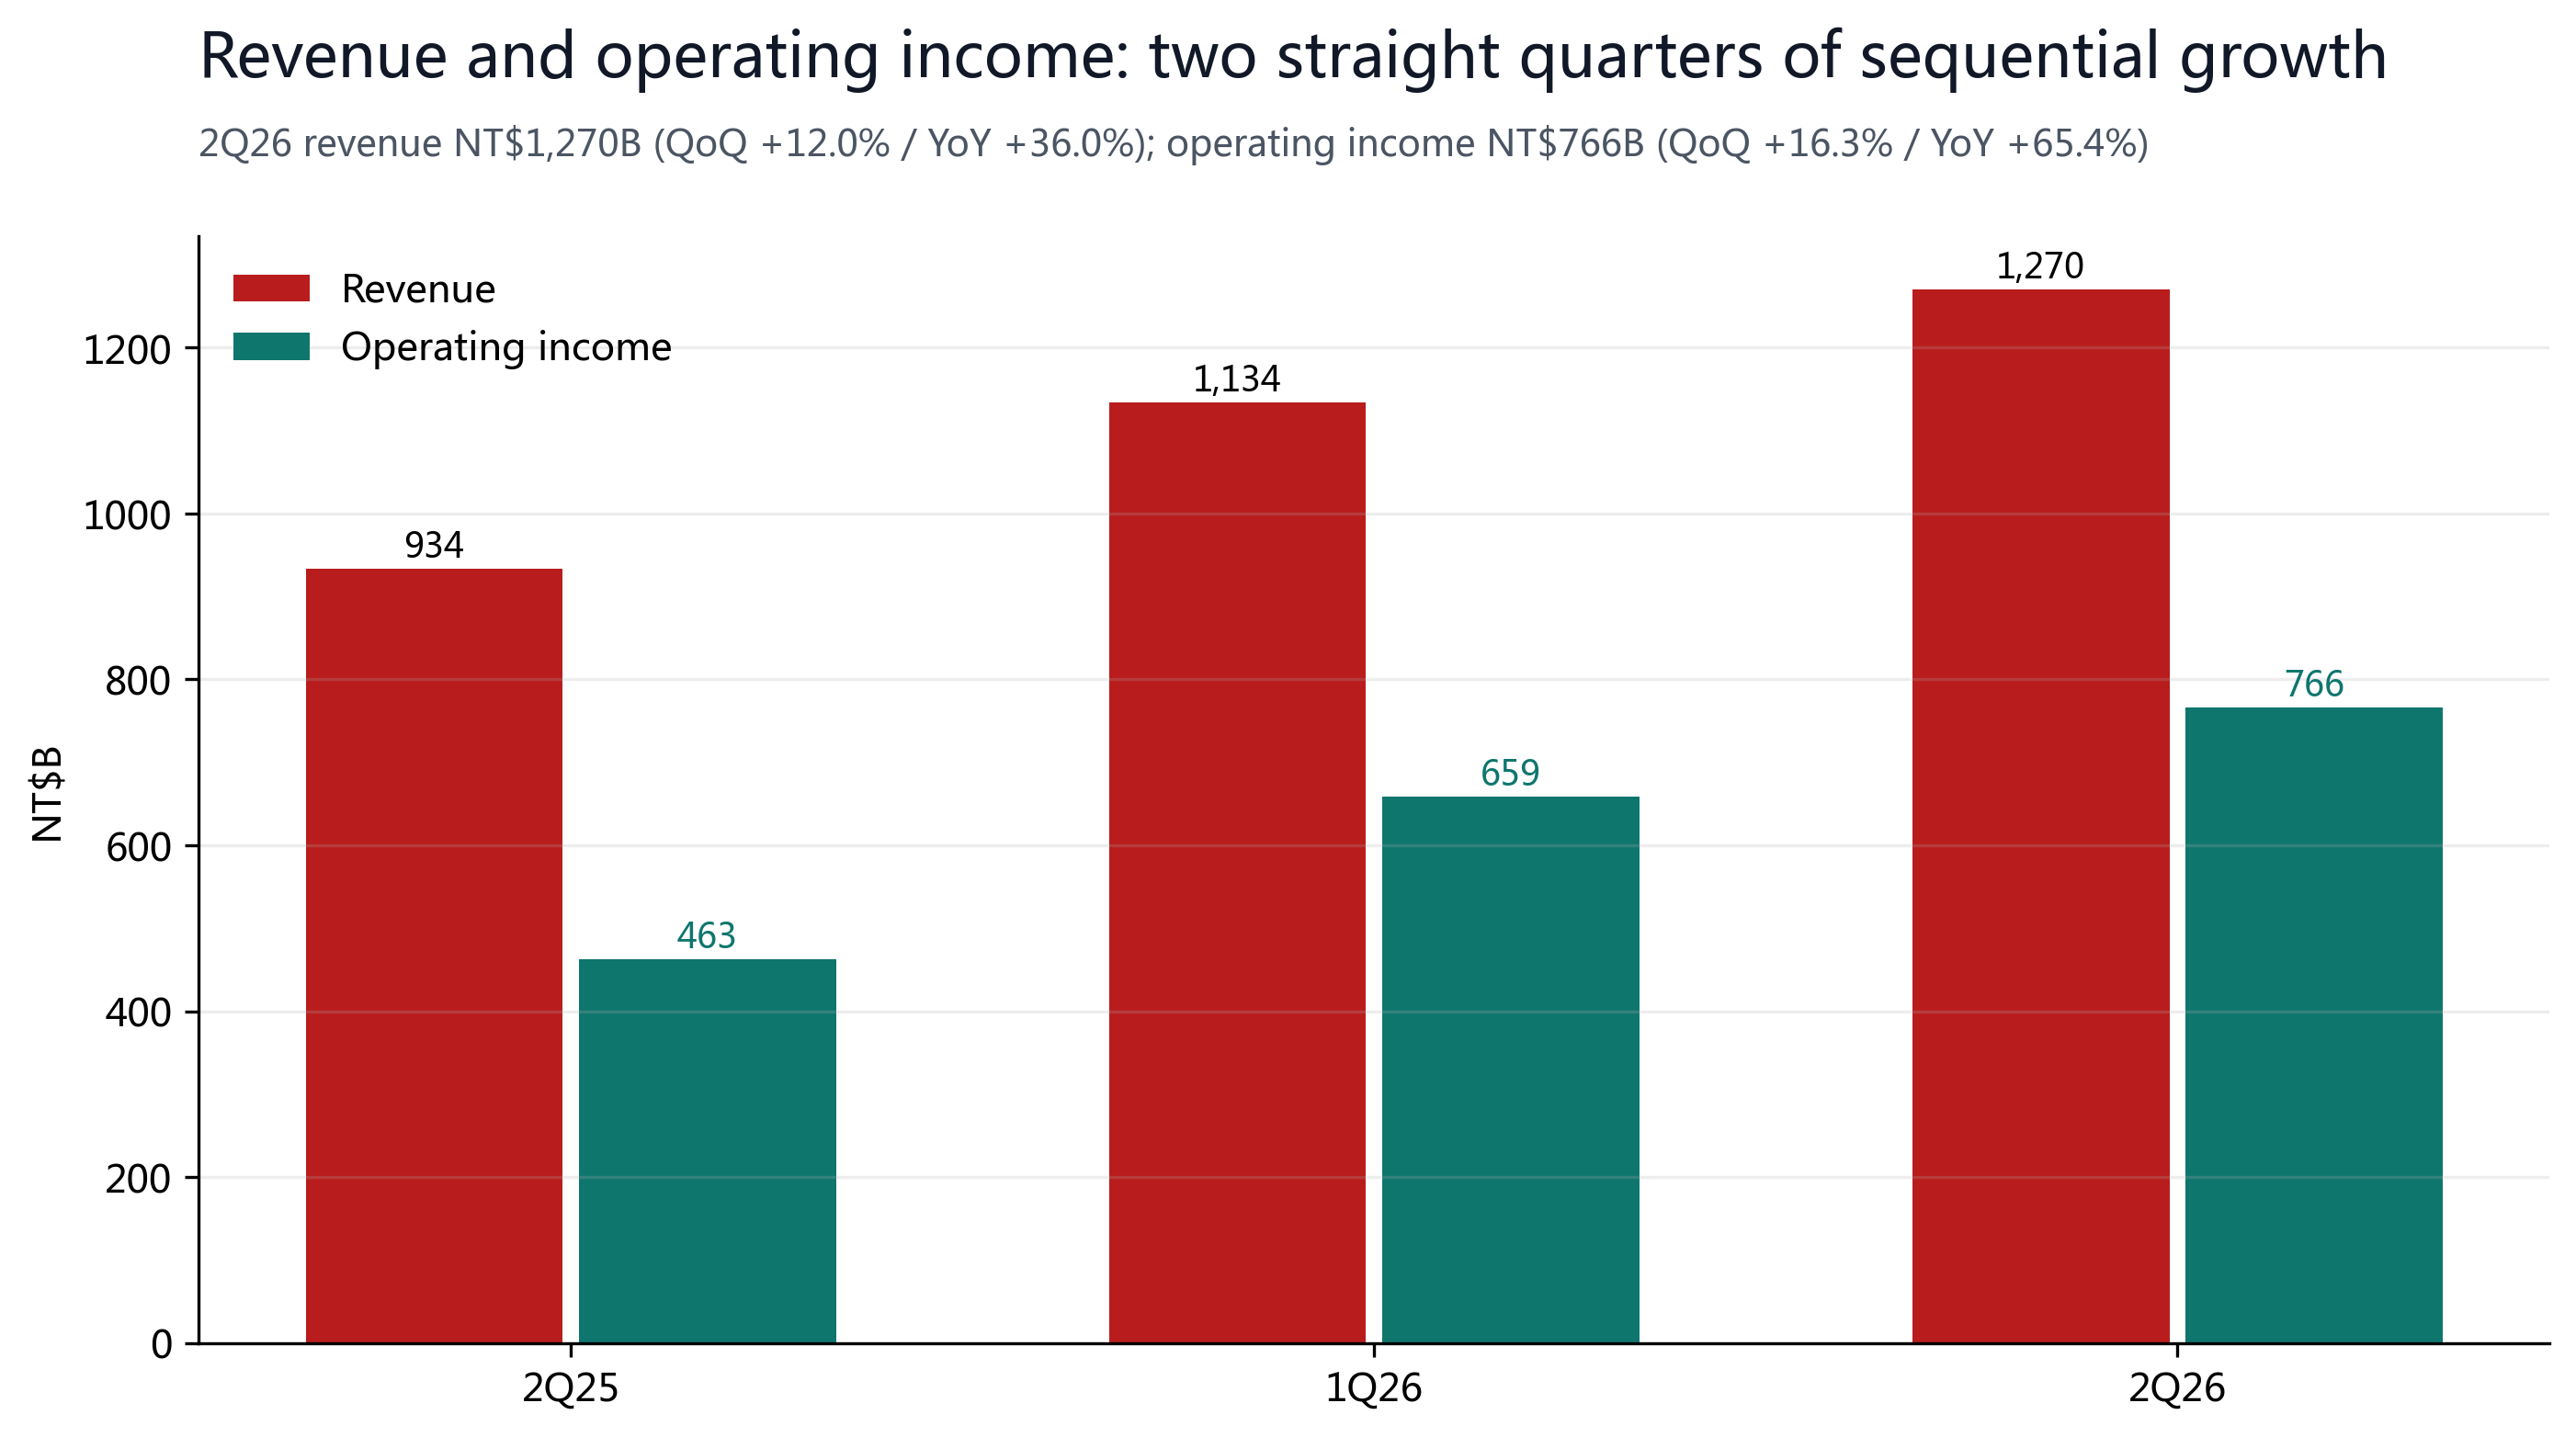
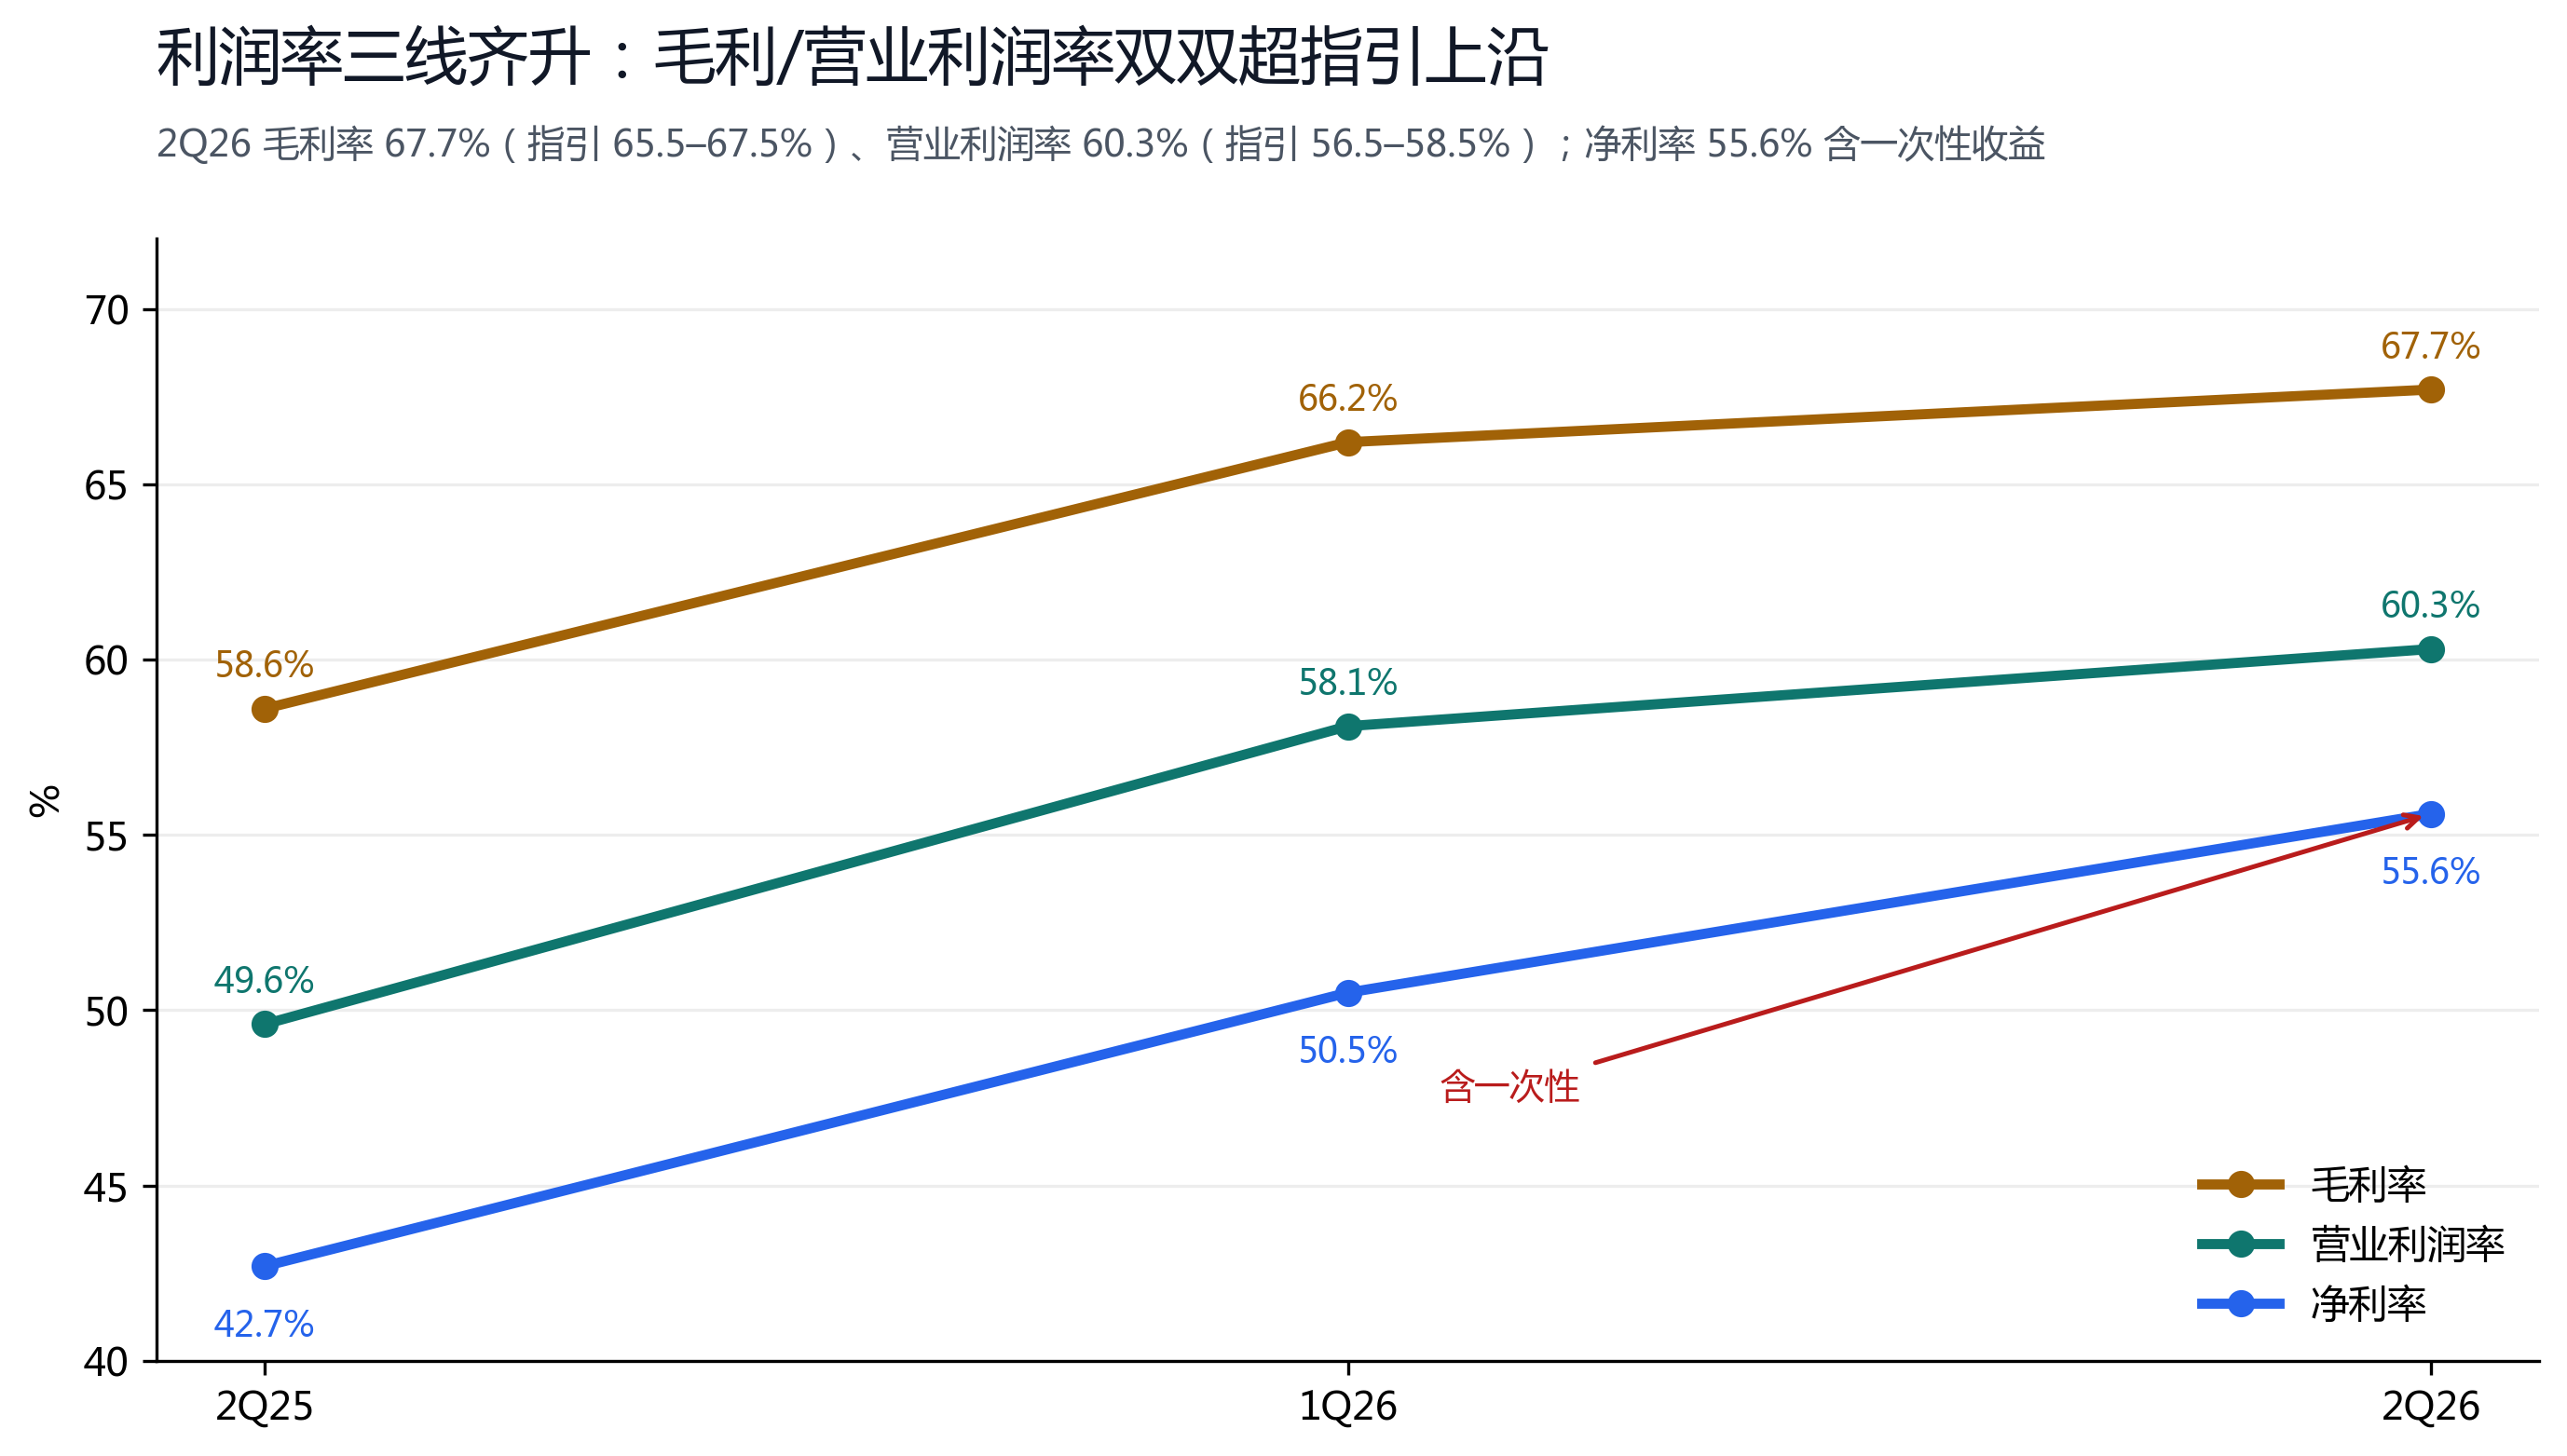
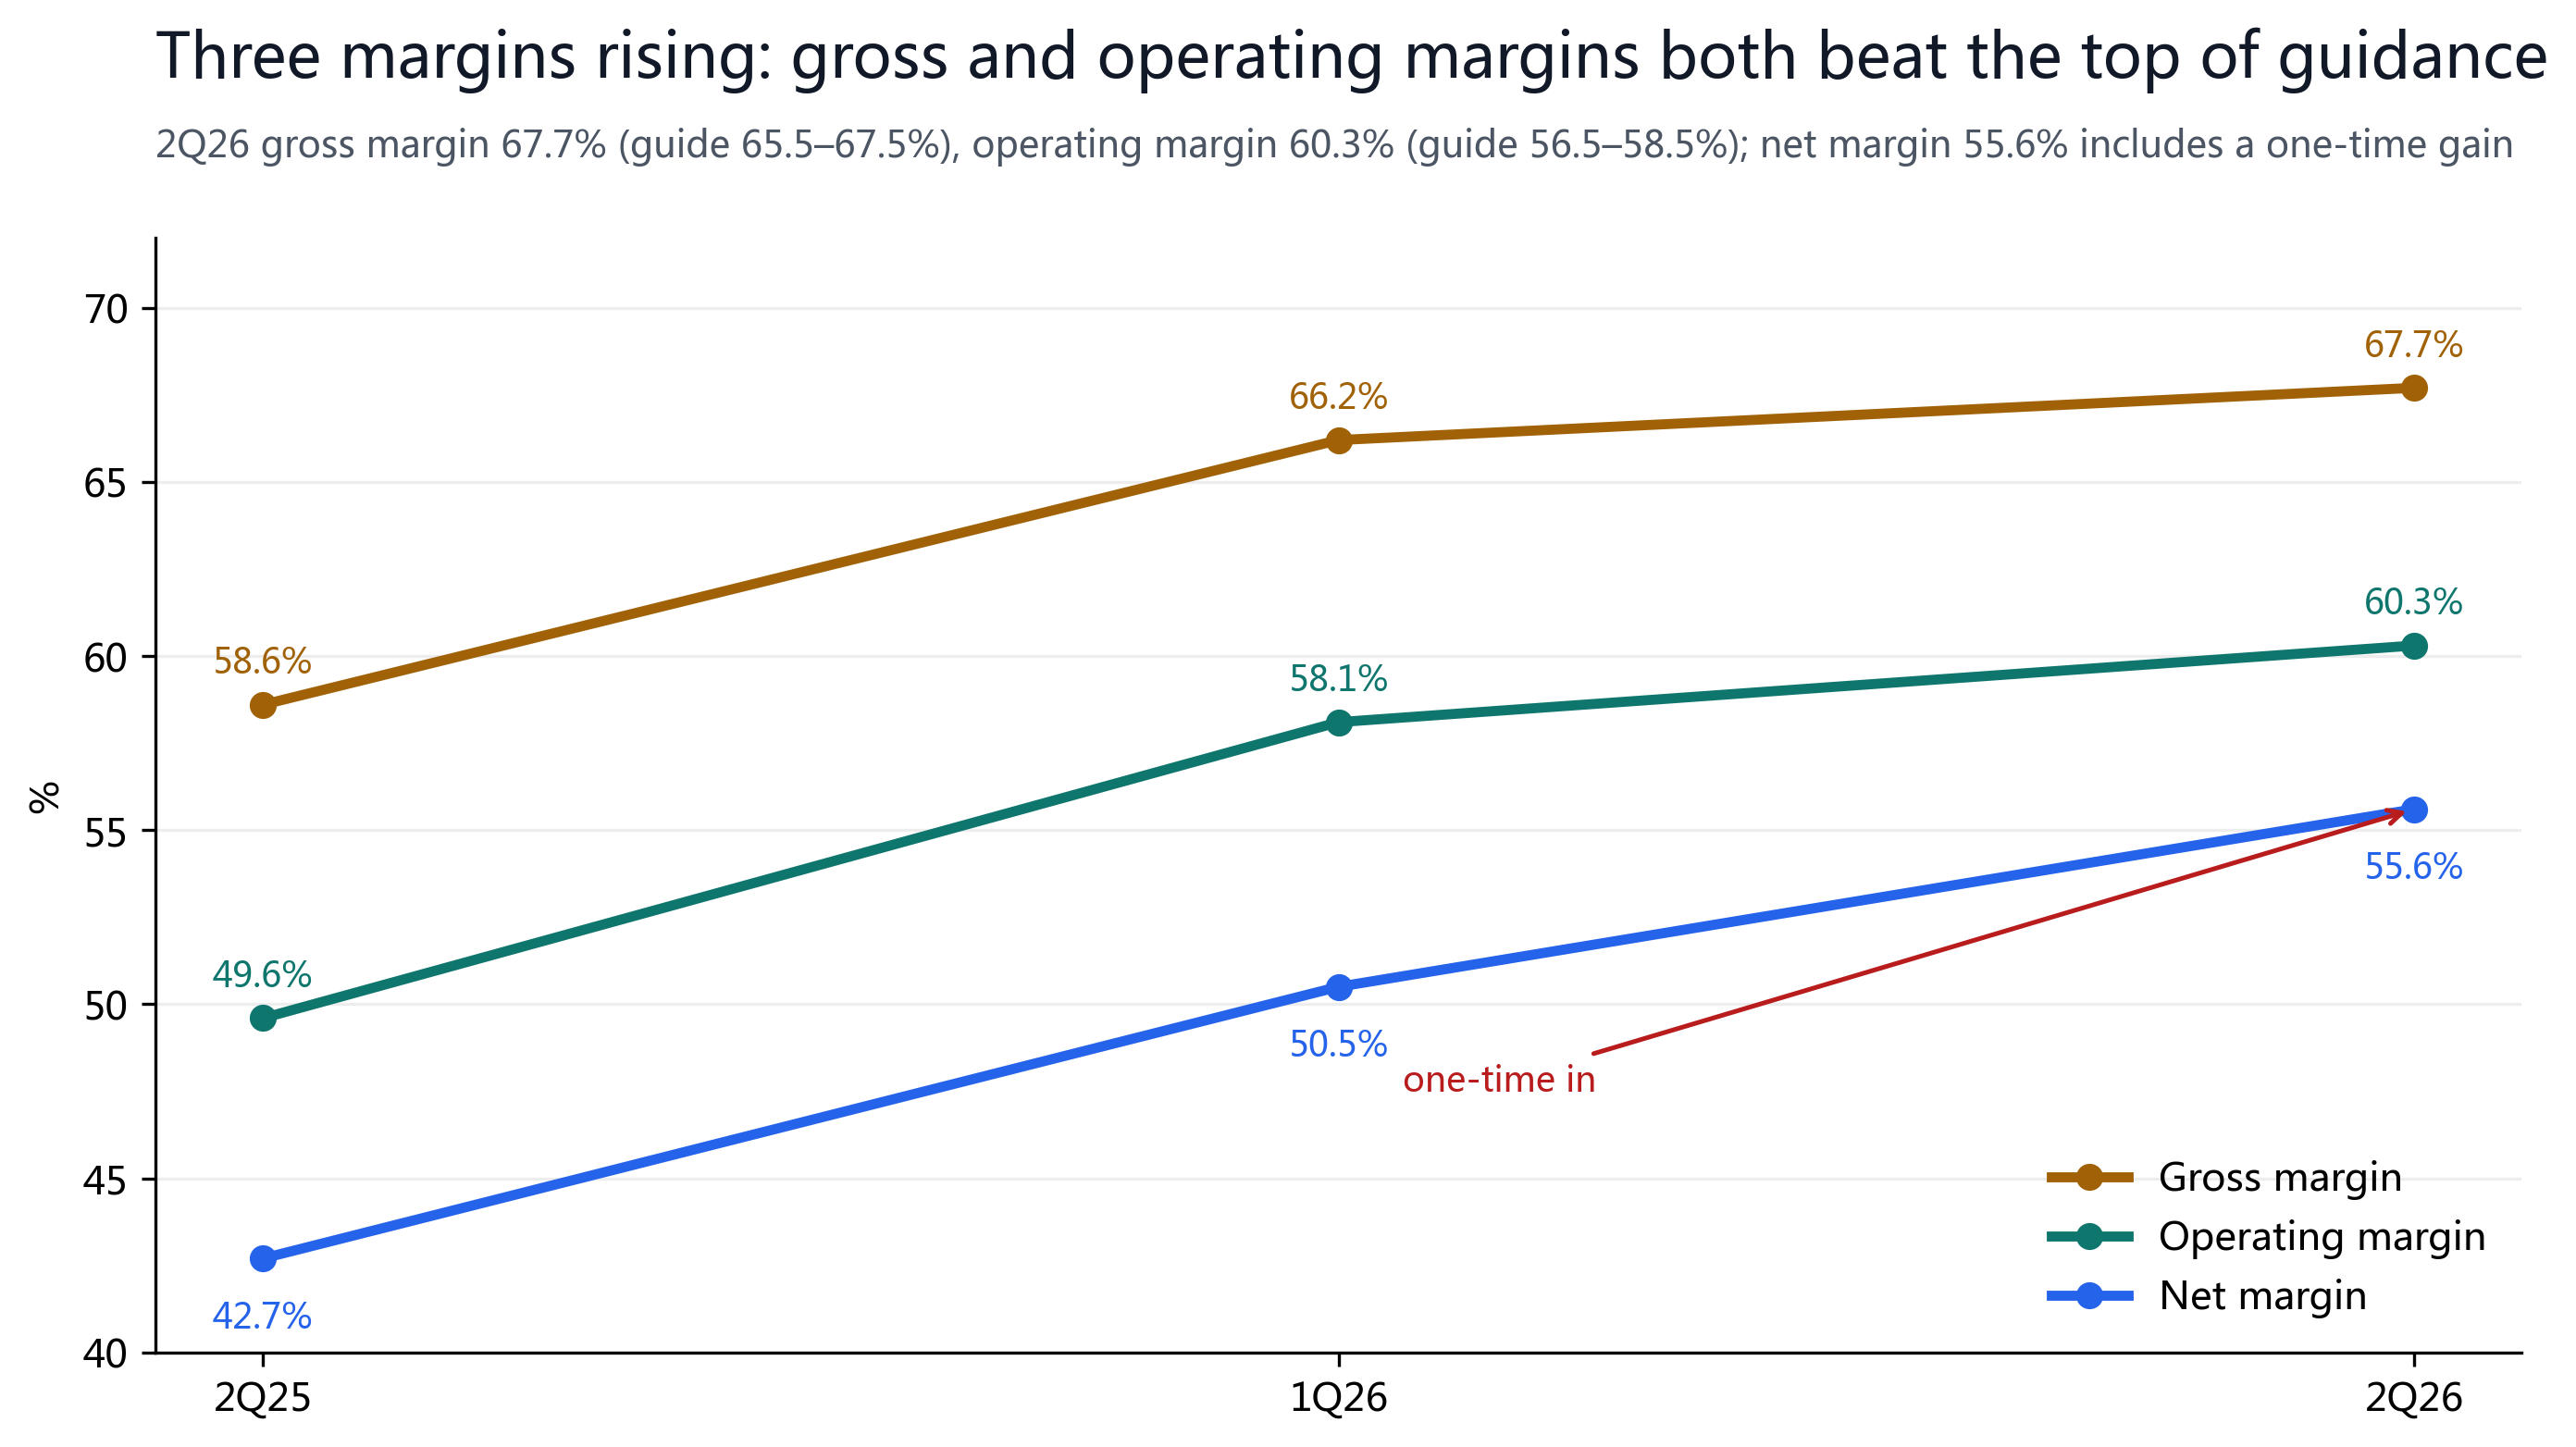
Q2 revenue was NT$1,270.38B (US$40.20B; +36.0%/+33.7% YoY, +12.0% QoQ), at the top of guidance. Gross margin 67.7% (guide 65.5-67.5%) and operating margin 60.3% (guide 56.5-58.5%) both beat the top of guidance and set records; operating income was about NT$766B, +16.3% QoQ and +65.4% YoY. Wafer shipments were 4,336K (12-inch equivalent), +3.9% QoQ.
| Income statement (official) | 2Q25 | 1Q26 | 2Q26 | QoQ |
|---|---|---|---|---|
| Revenue (US$B) | 30.07 | 35.90 | 40.20 | +12.0% |
| Revenue (NT$B) | 933.79 | 1,134.10 | 1,270.38 | +12.0% |
| Gross margin | 58.6% | 66.2% | 67.7% | +1.5pp |
| Operating margin | 49.6% | 58.1% | 60.3% | +2.2pp |
| Net income (NT$B) | 398.27 | 572.48 | 706.56 | +23.4% |
| Net margin | 42.7% | 50.5% | 55.6%* | +5.1pp |
| EPS (NT$) | 15.36 | 22.08 | 27.25* | +23.4% |
| ROE (ann.) | 34.8% | 40.5% | 45.9% | +5.4pp |
* 2Q26 net margin and EPS include the one-time VIS gain; clean net margin is about 50.9% and clean EPS about NT$24.9 (author estimate).
§05Business Mix: Advanced Nodes and the AI Platform
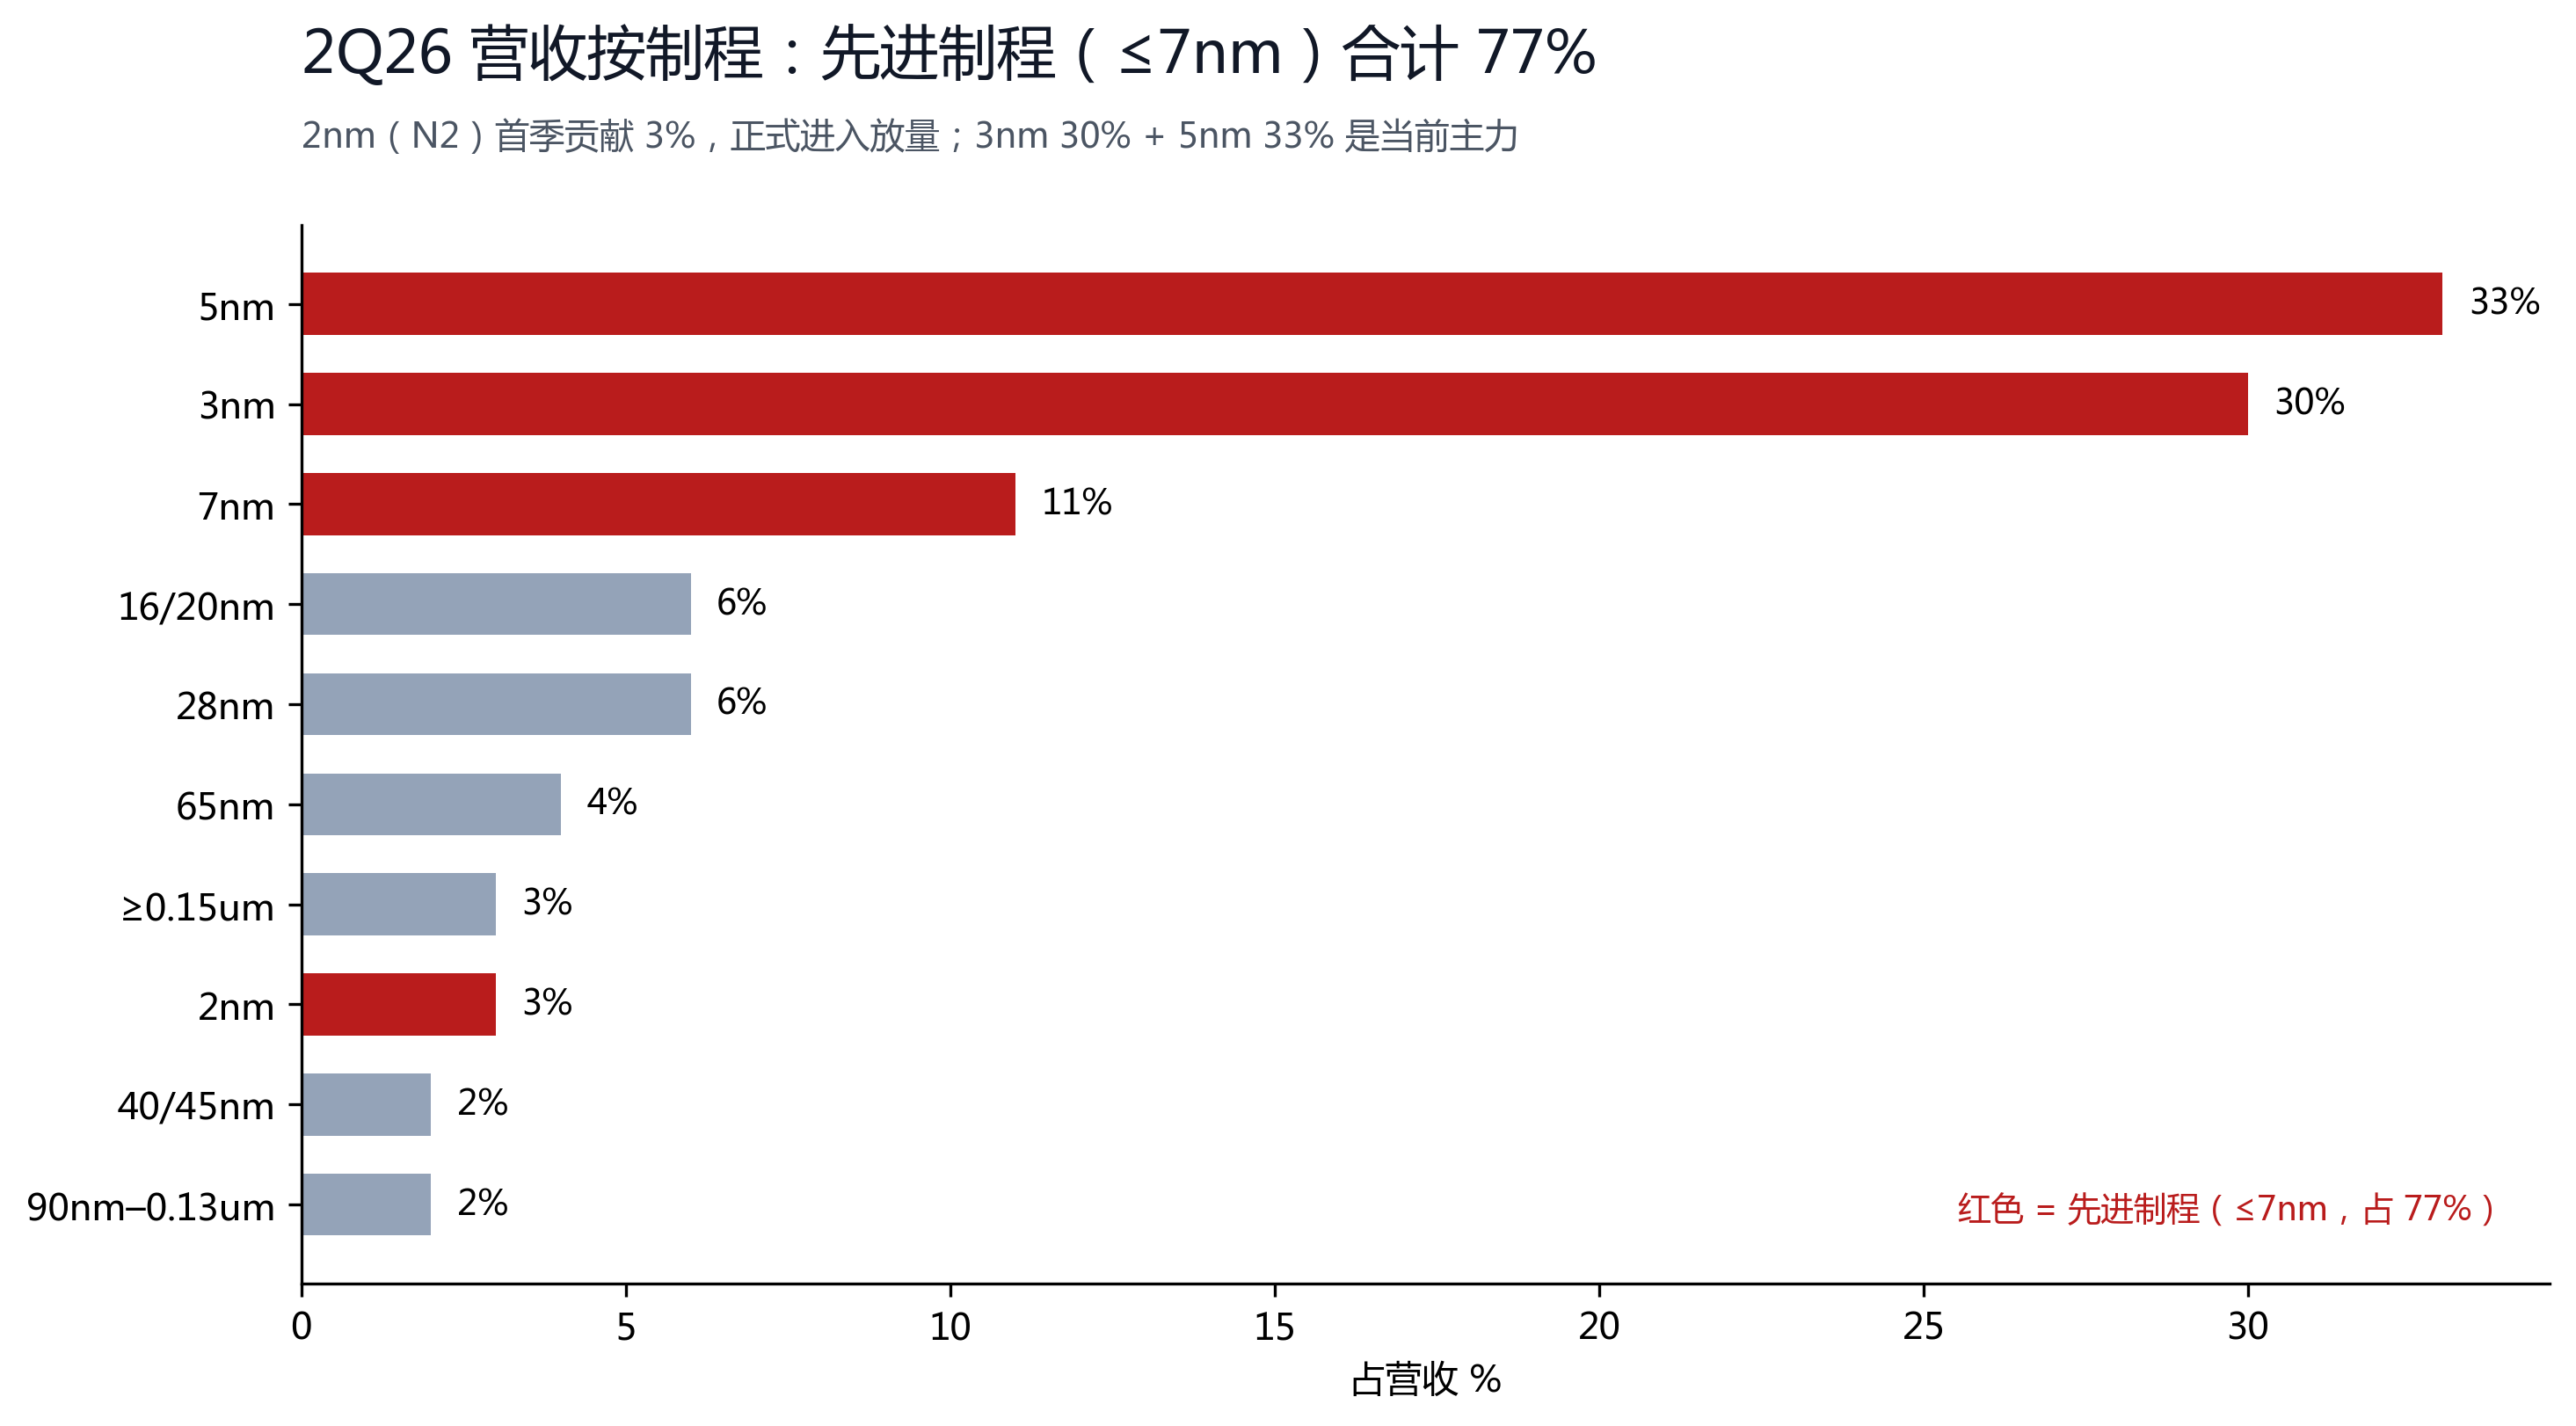
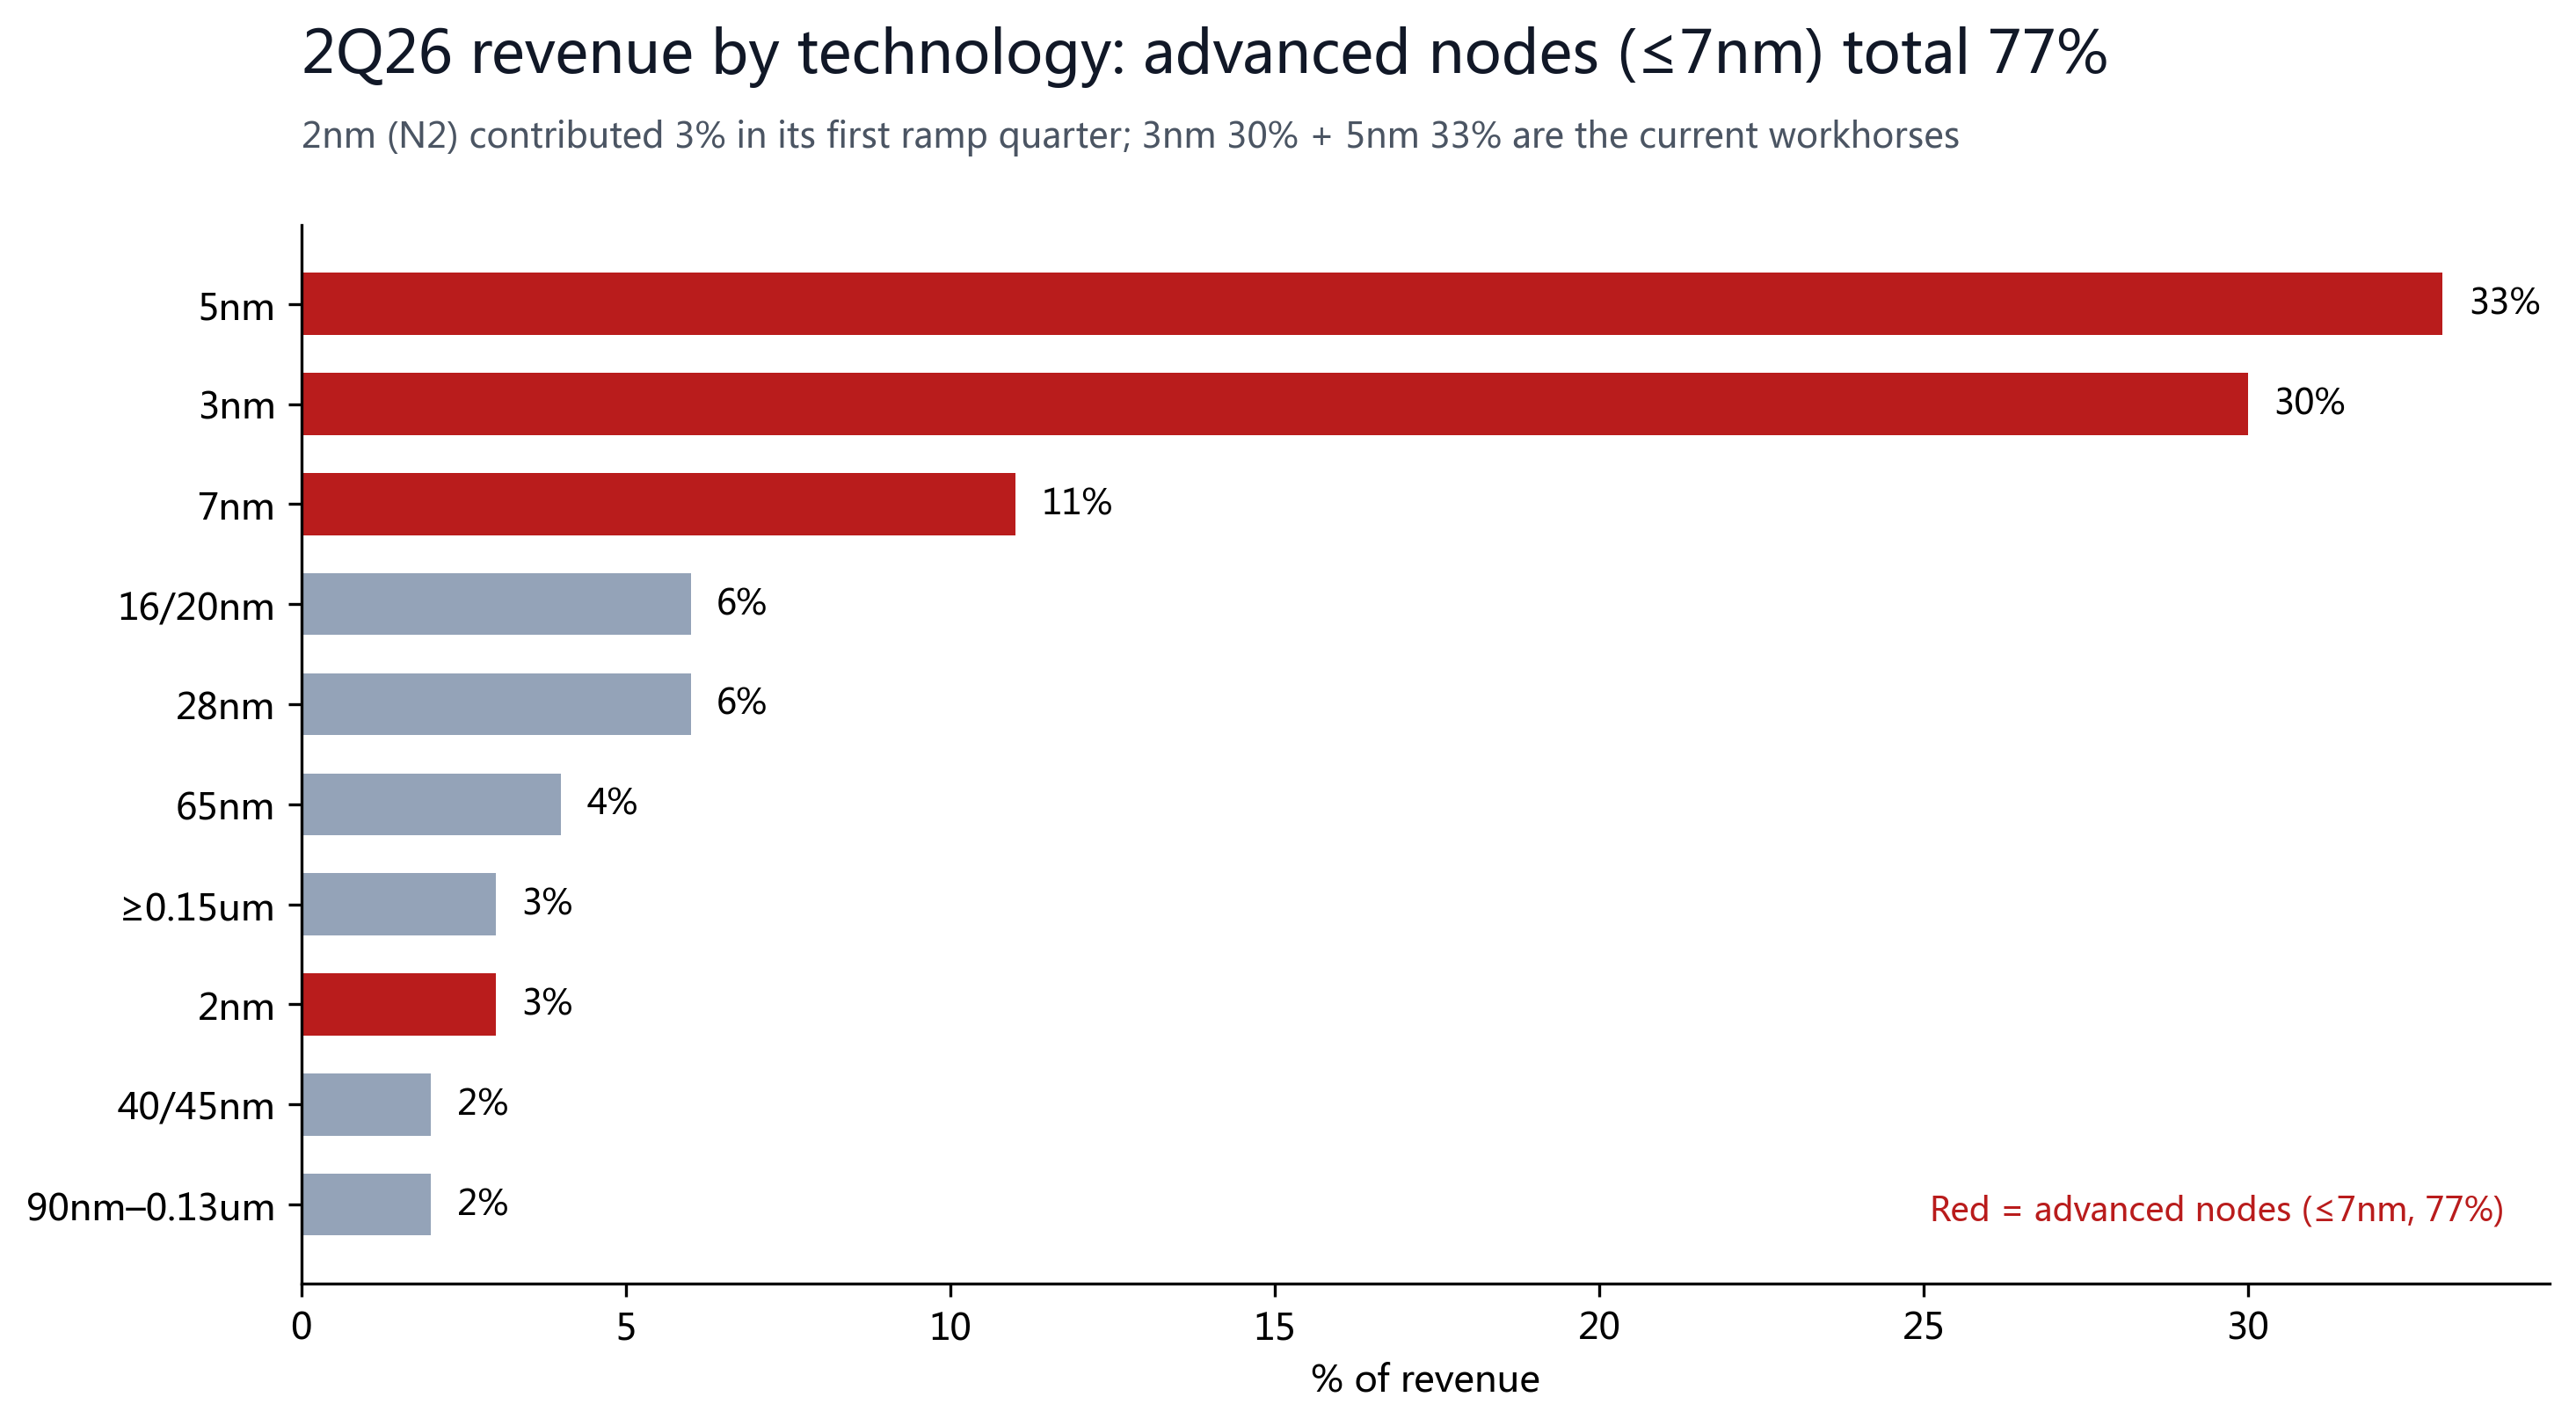
By process node, TSMC's revenue is heavily concentrated in the most advanced nodes: 5nm 33%, 3nm 30%, 7nm 11%, with advanced nodes (≤7nm) totaling 77%; 2nm (N2) contributed 3% for the first time this quarter, formally entering its ramp. The more advanced the node, the higher the price and the fewer the competitors — the root reason TSMC's gross margin holds in the 60s.
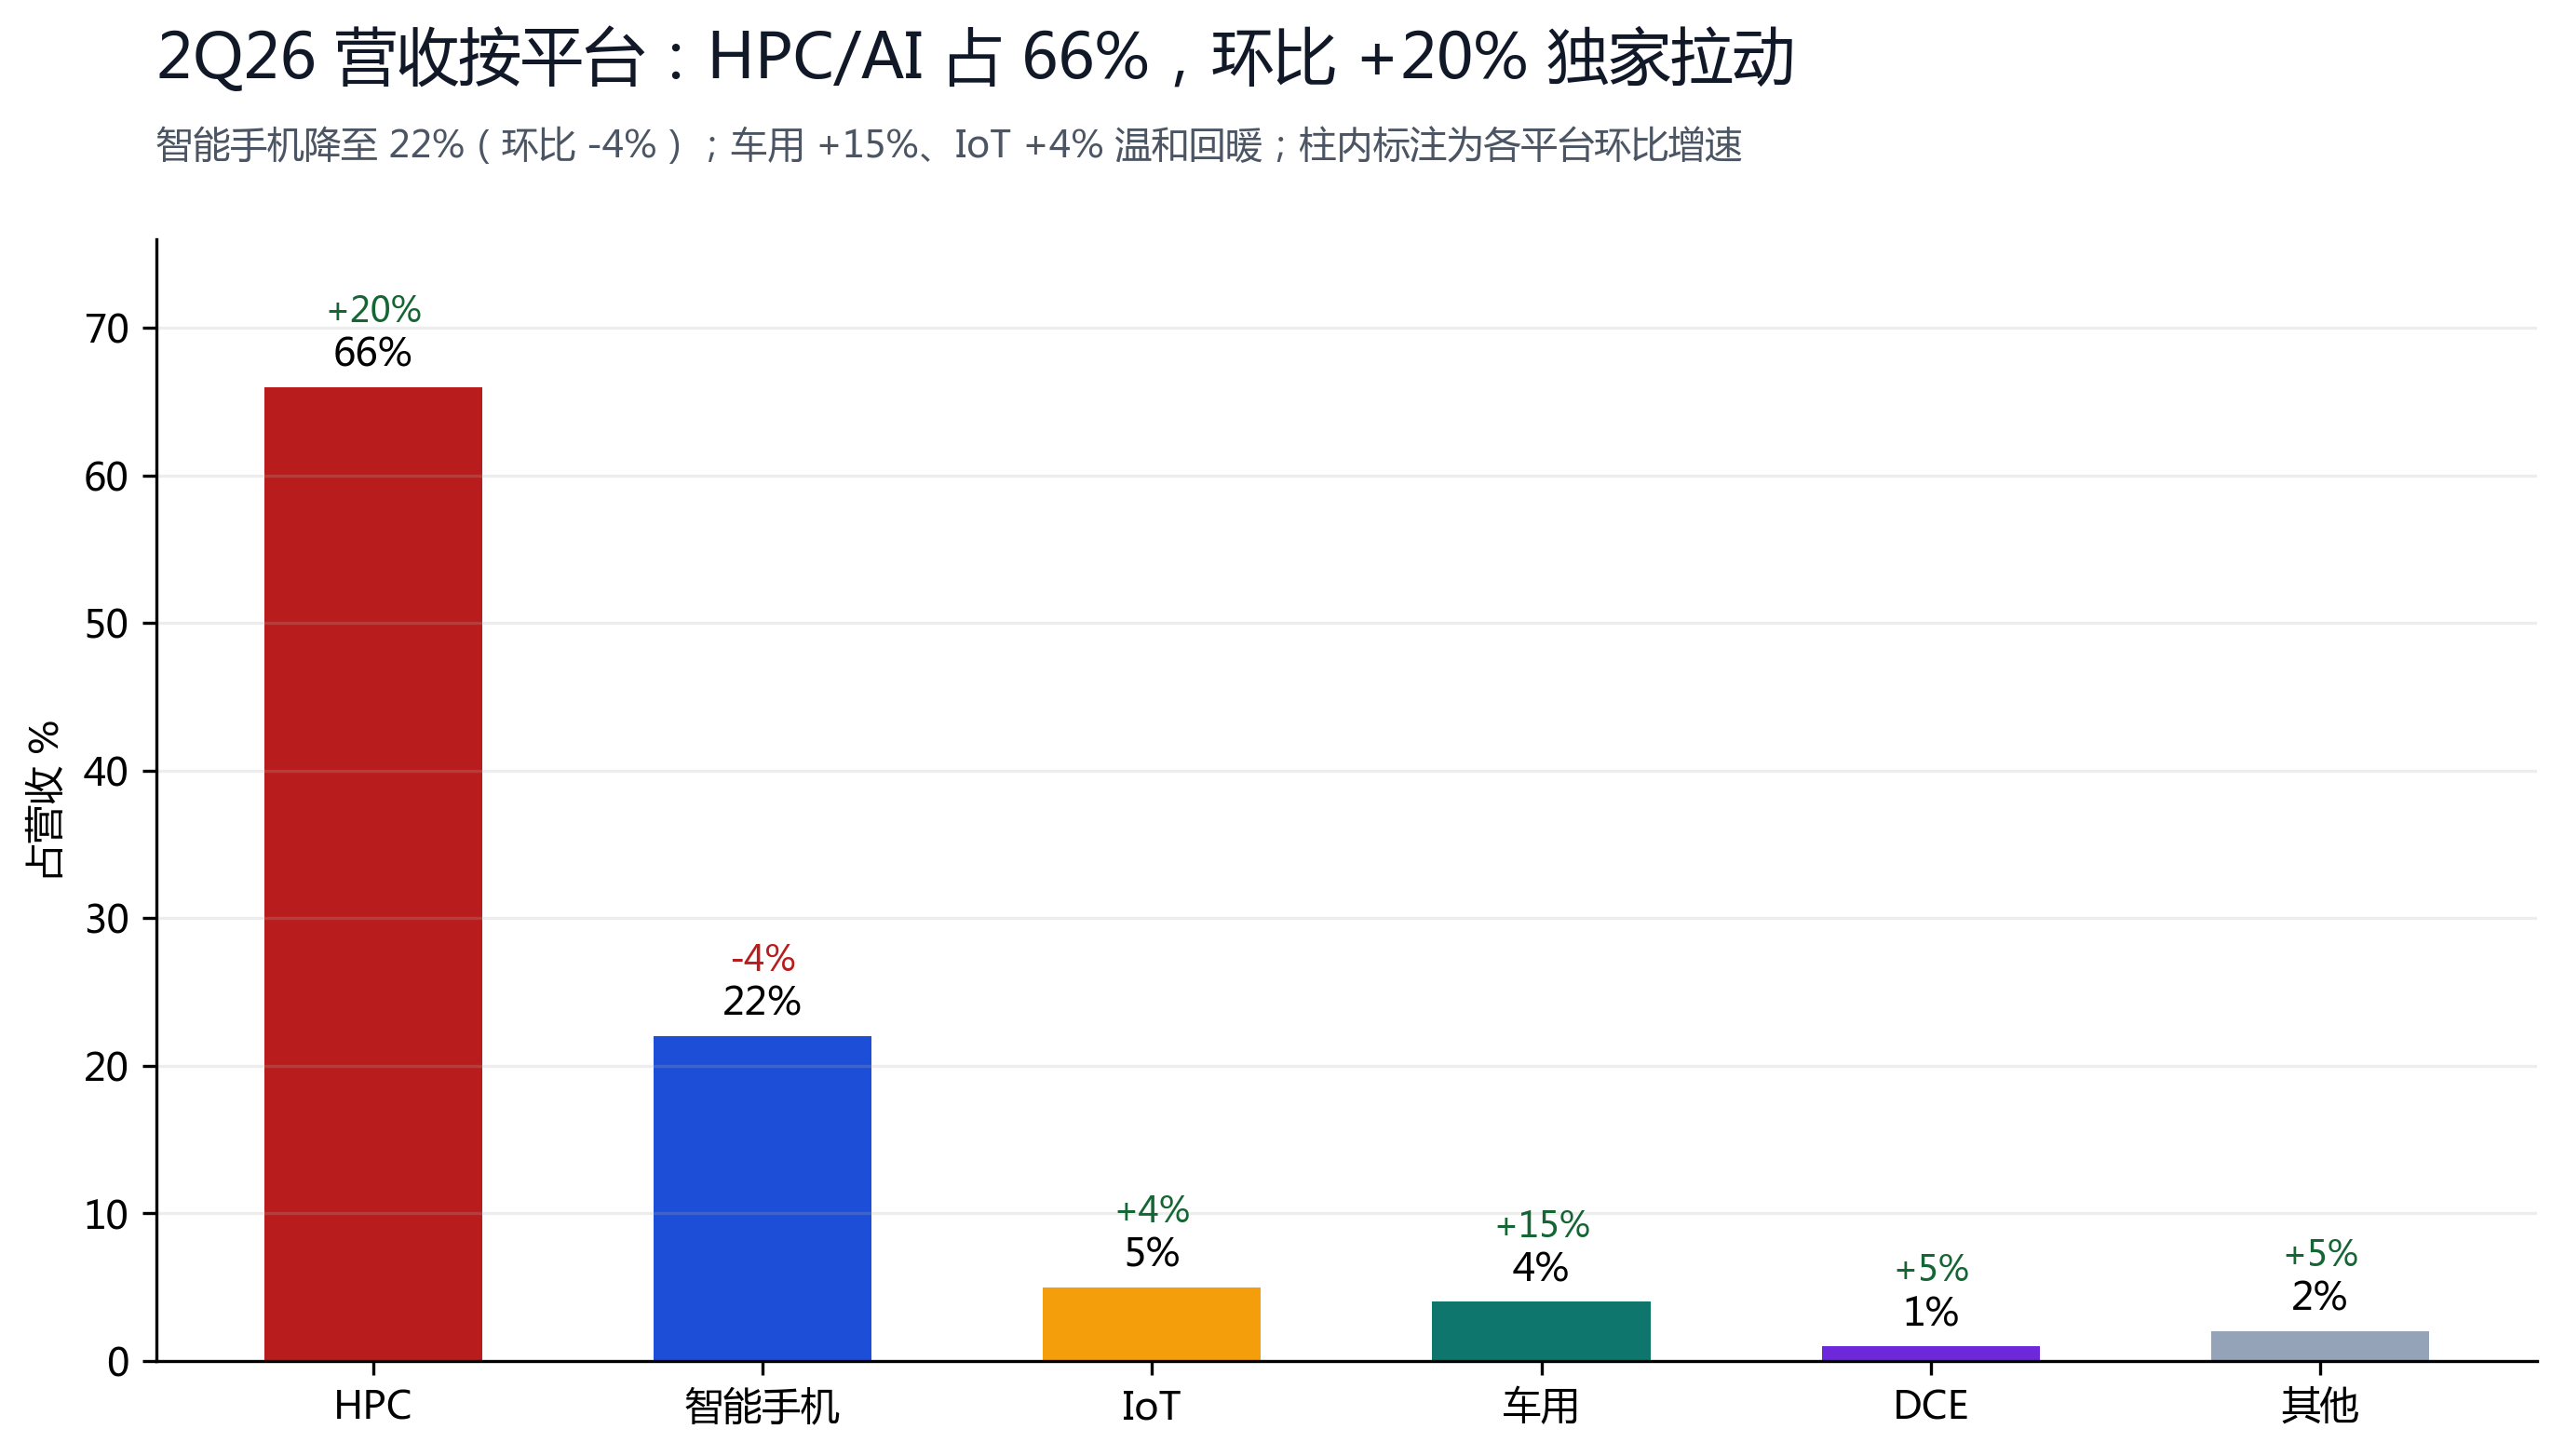
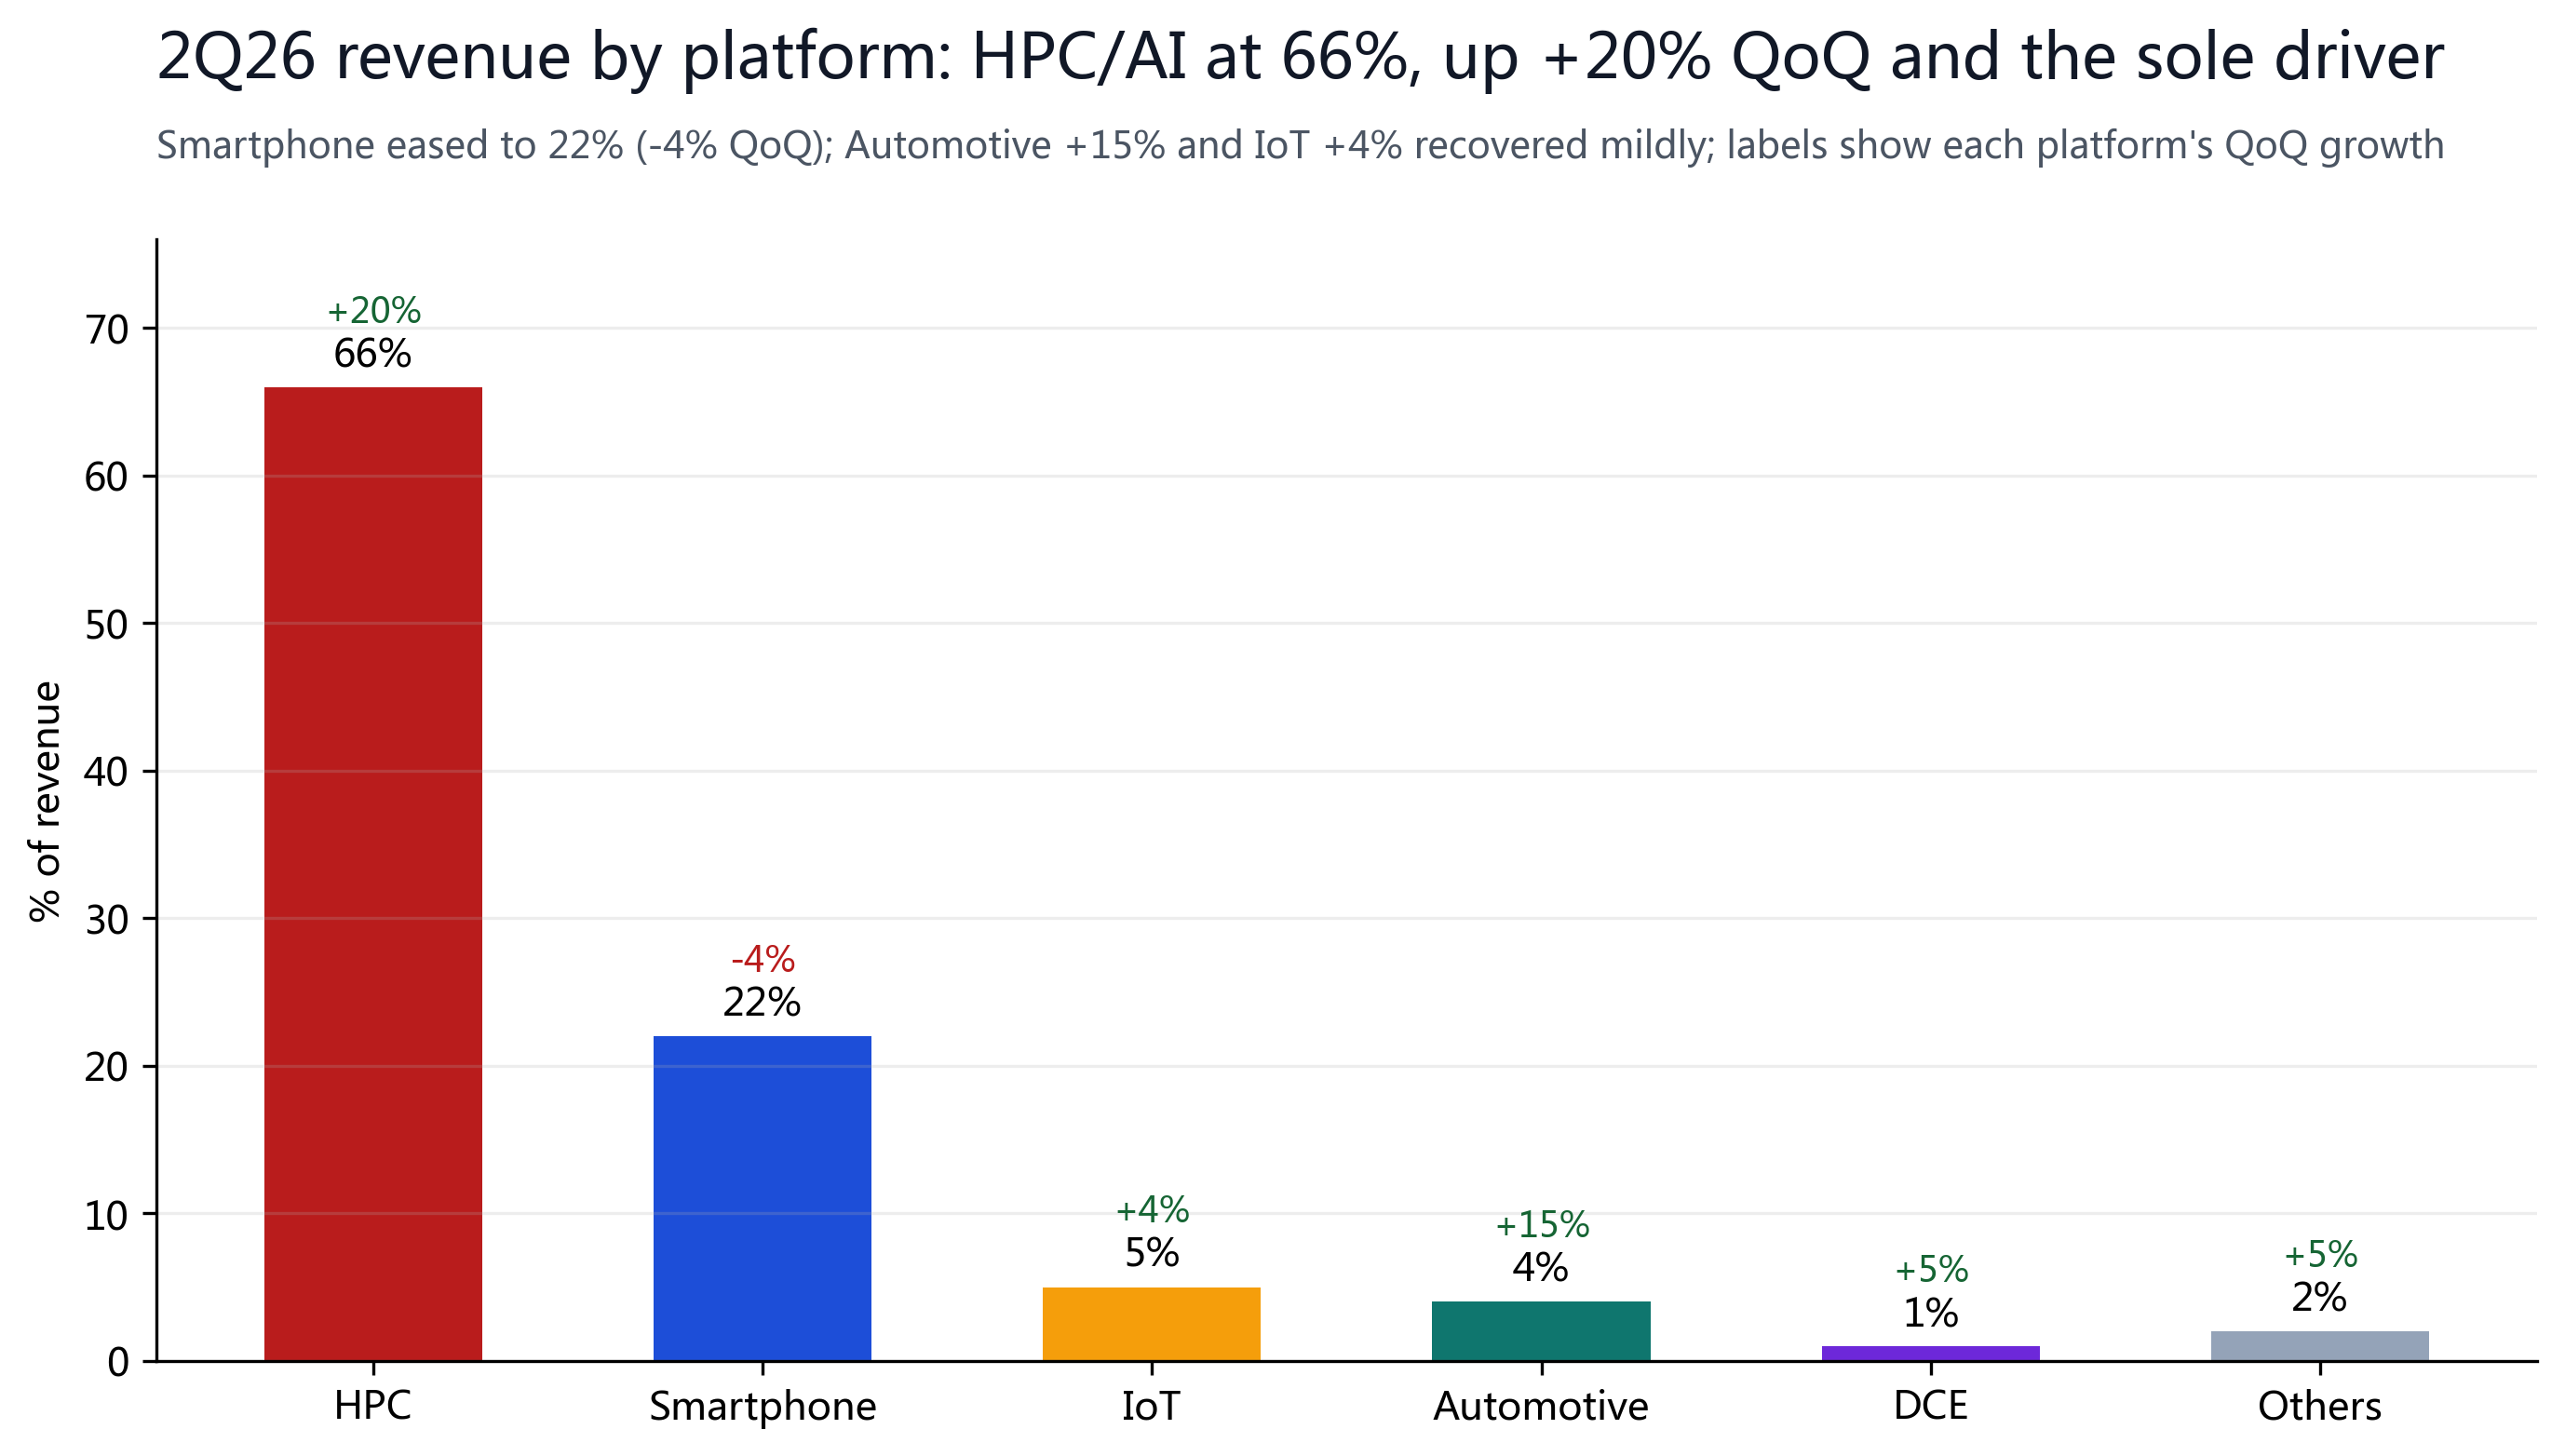
By end platform, AI is the dominant theme: HPC (high-performance computing, including AI accelerators) is 66% of revenue and up +20% QoQ — the only strong driver this quarter; smartphones eased to 22% (-4% QoQ), while automotive (+15%) and IoT (+4%) recovered mildly. This mix shows TSMC's growth has shifted from the traditional smartphone cycle to a new one driven by AI data-center capex, whose visibility and durability far exceed consumer electronics.
§06Balance Sheet and Cash Flow
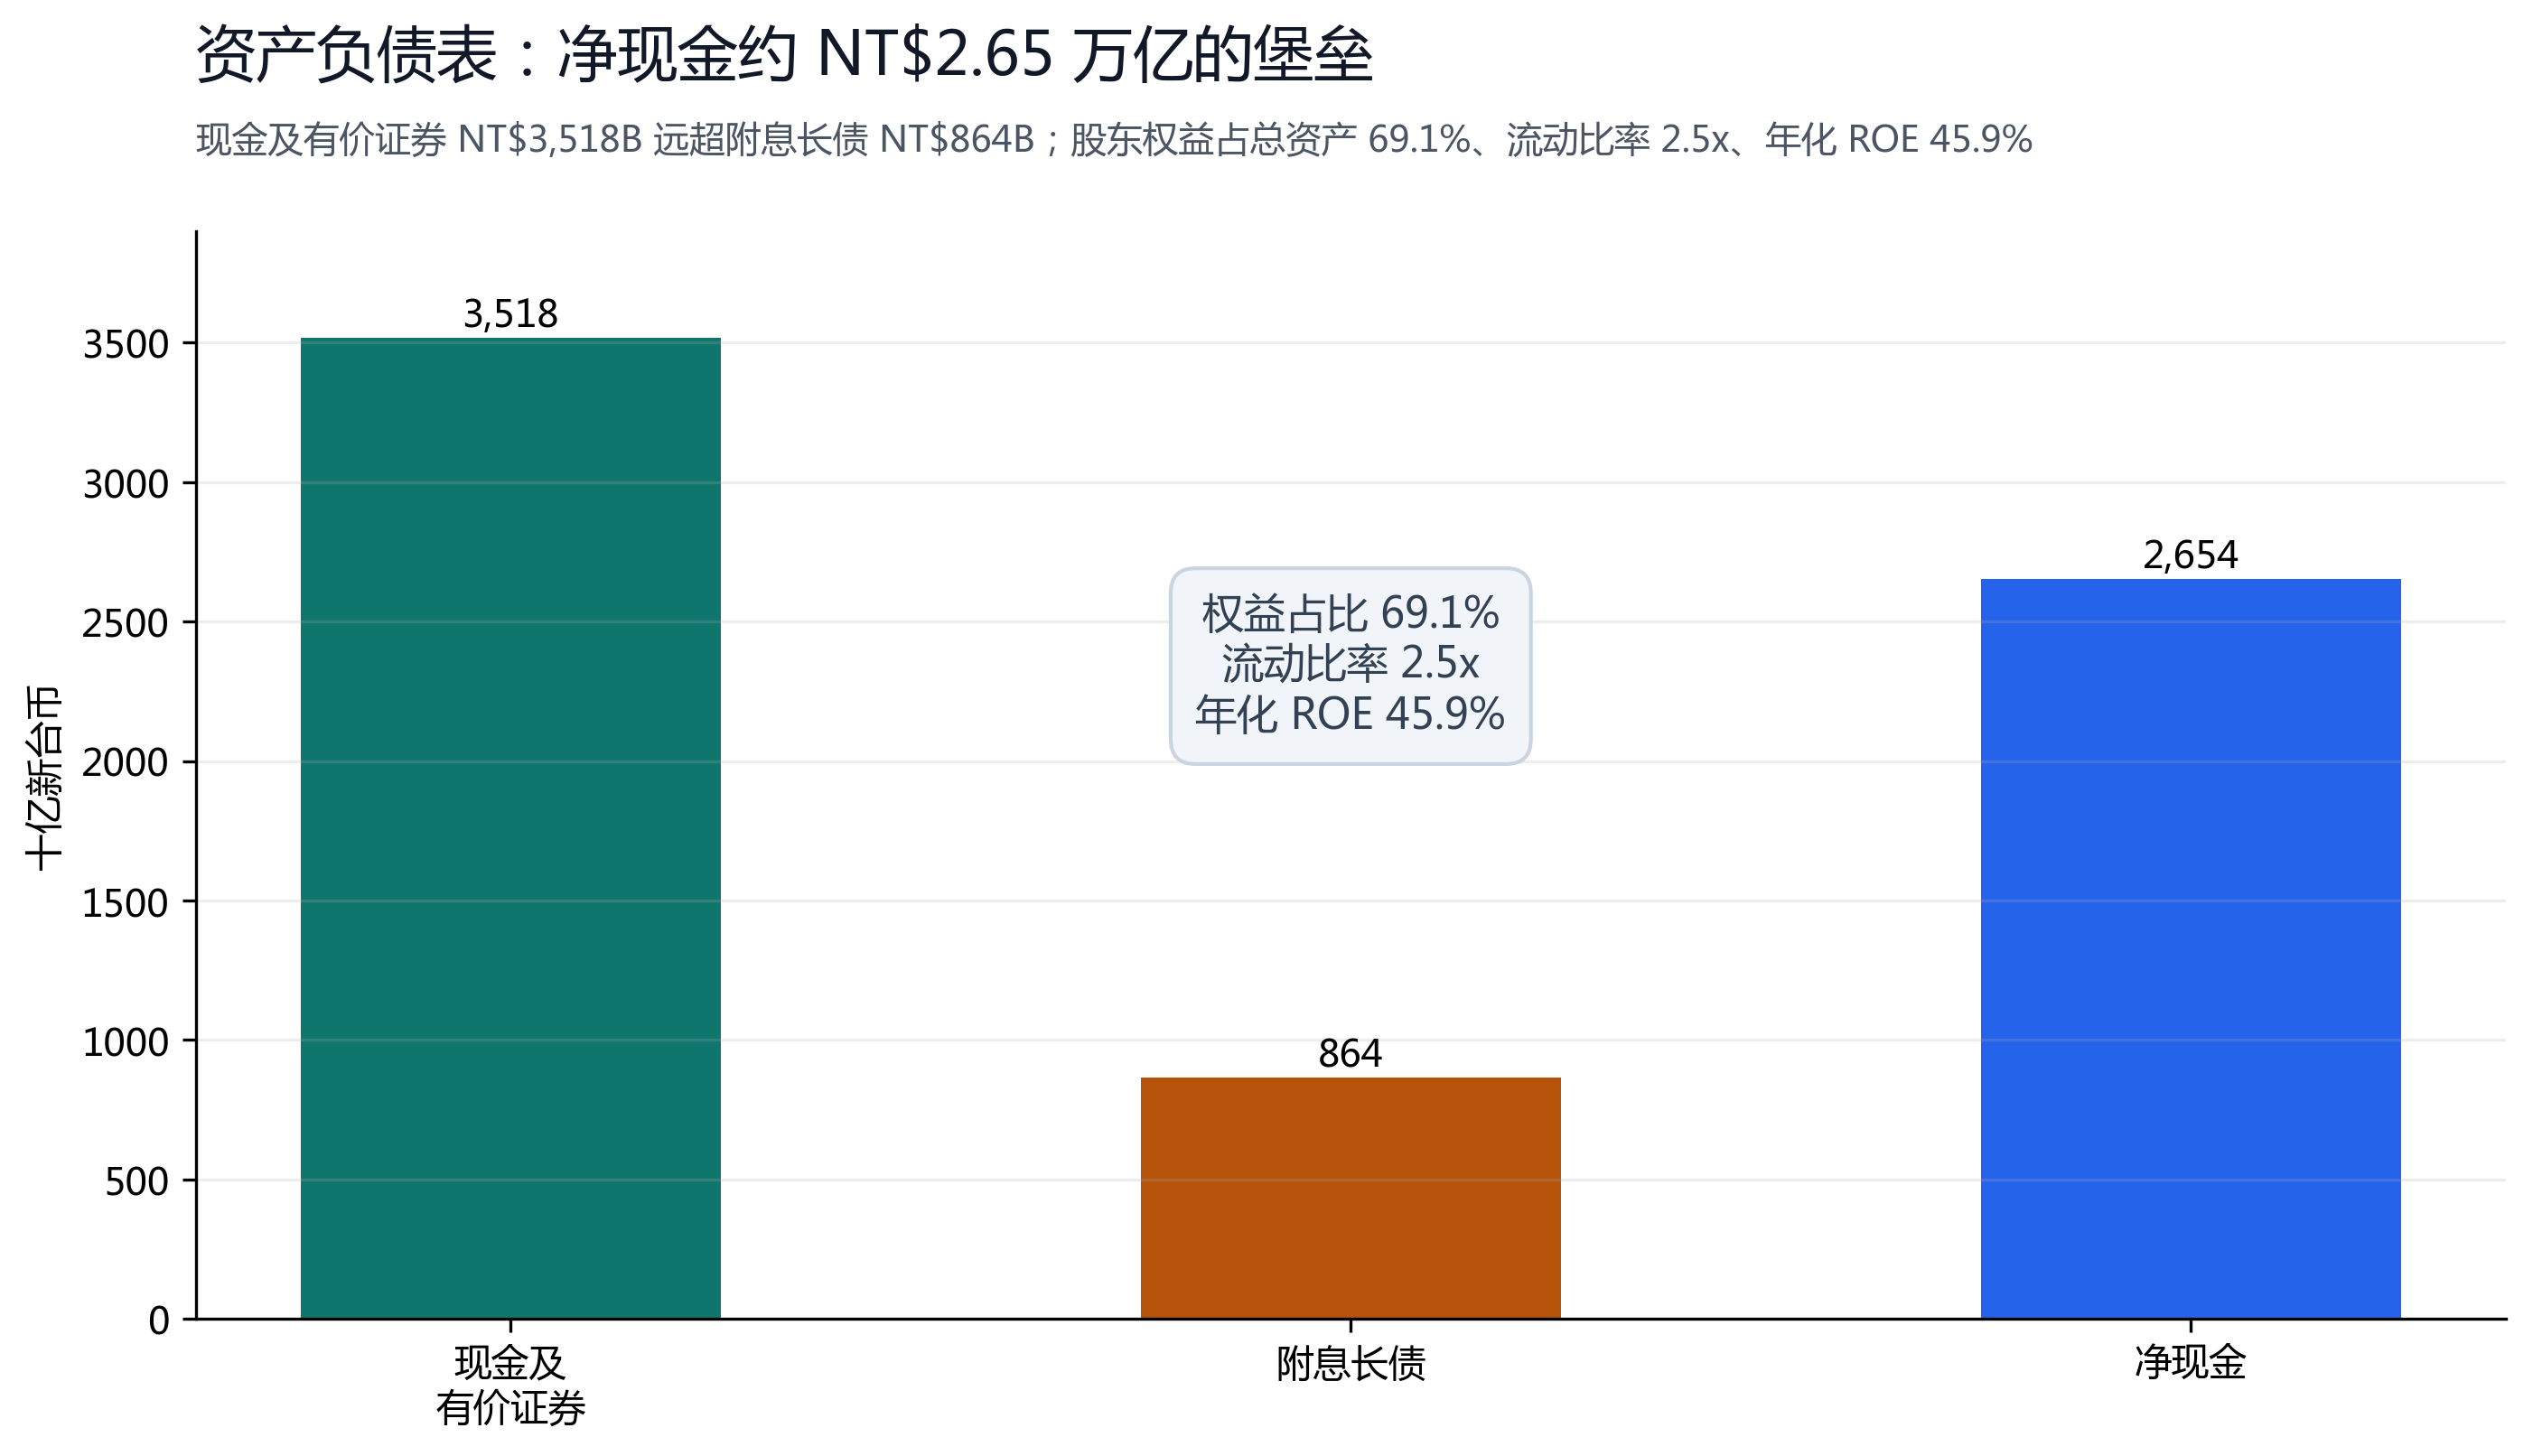
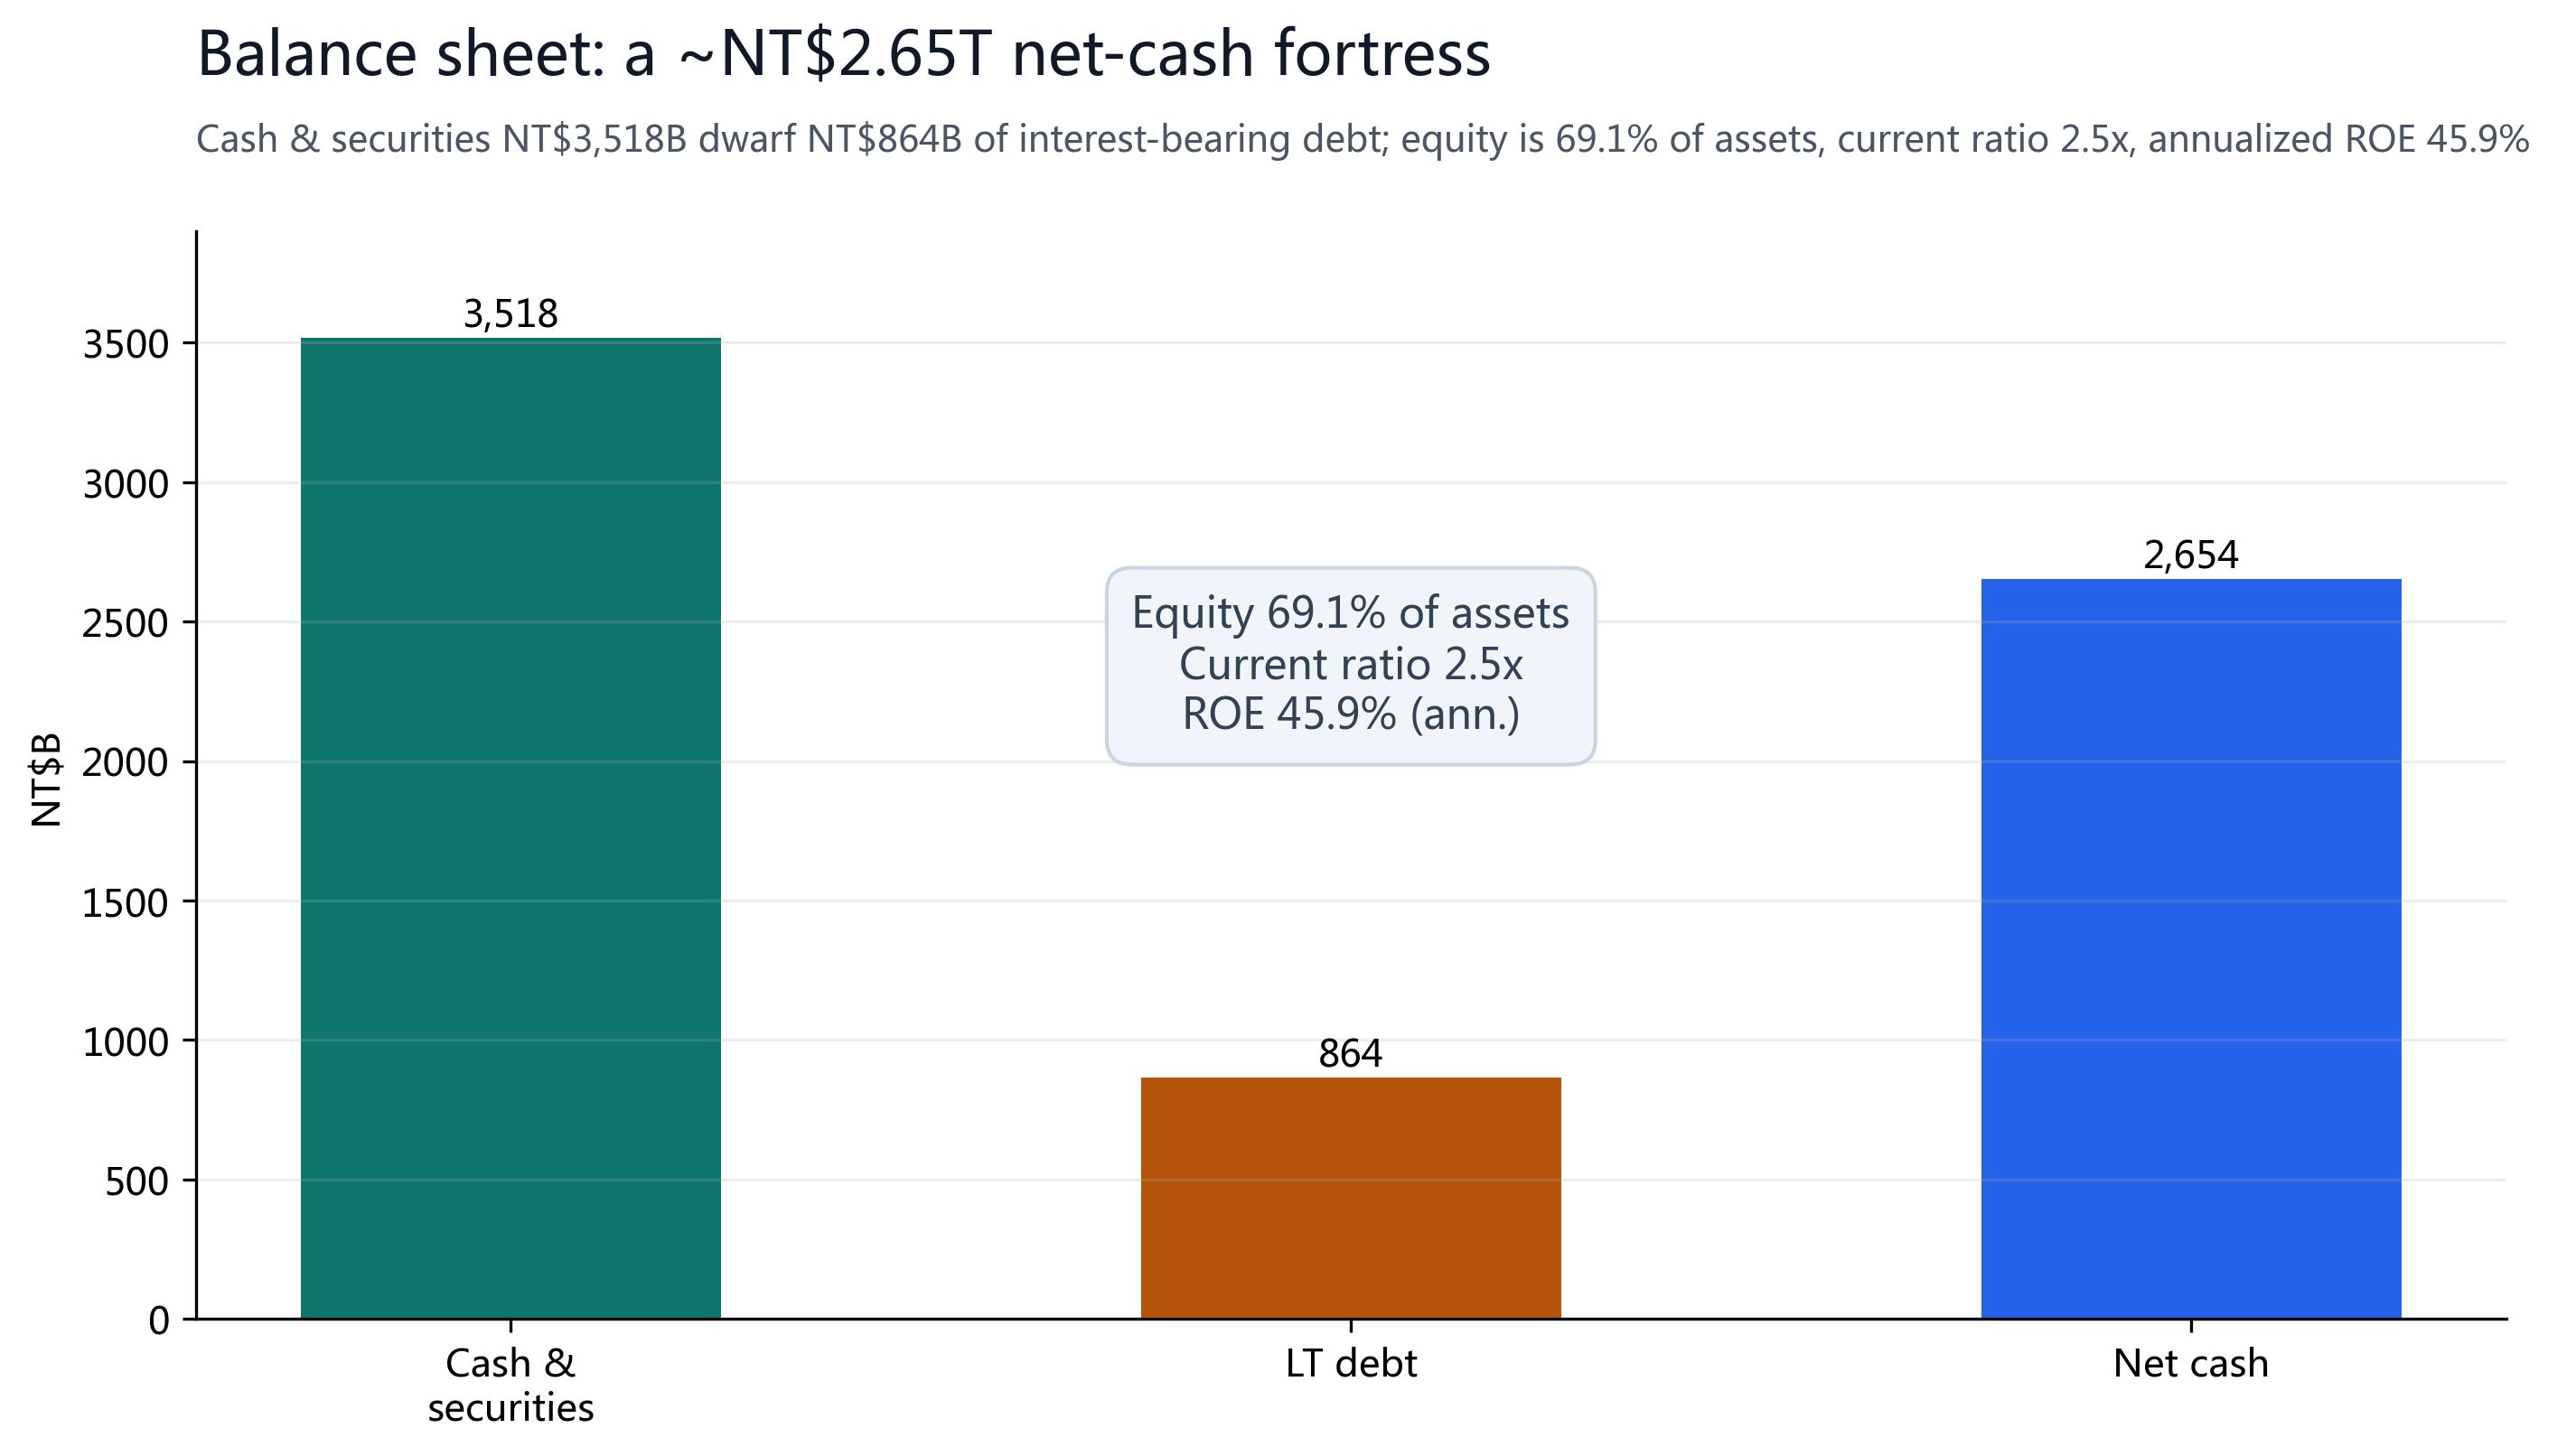
TSMC carries a fortress balance sheet: cash and marketable securities of NT$3,518B far exceed NT$864B of interest-bearing long-term debt, for about NT$2.65T of net cash; equity is 69.1% of assets, the current ratio is 2.5x, and annualized ROE is 45.9%. The strong balance sheet lets the company keep investing heavily through the AI arms race without financial strain, and supports steady dividends (the board approved a NT$7.00 cash dividend for 1Q26).
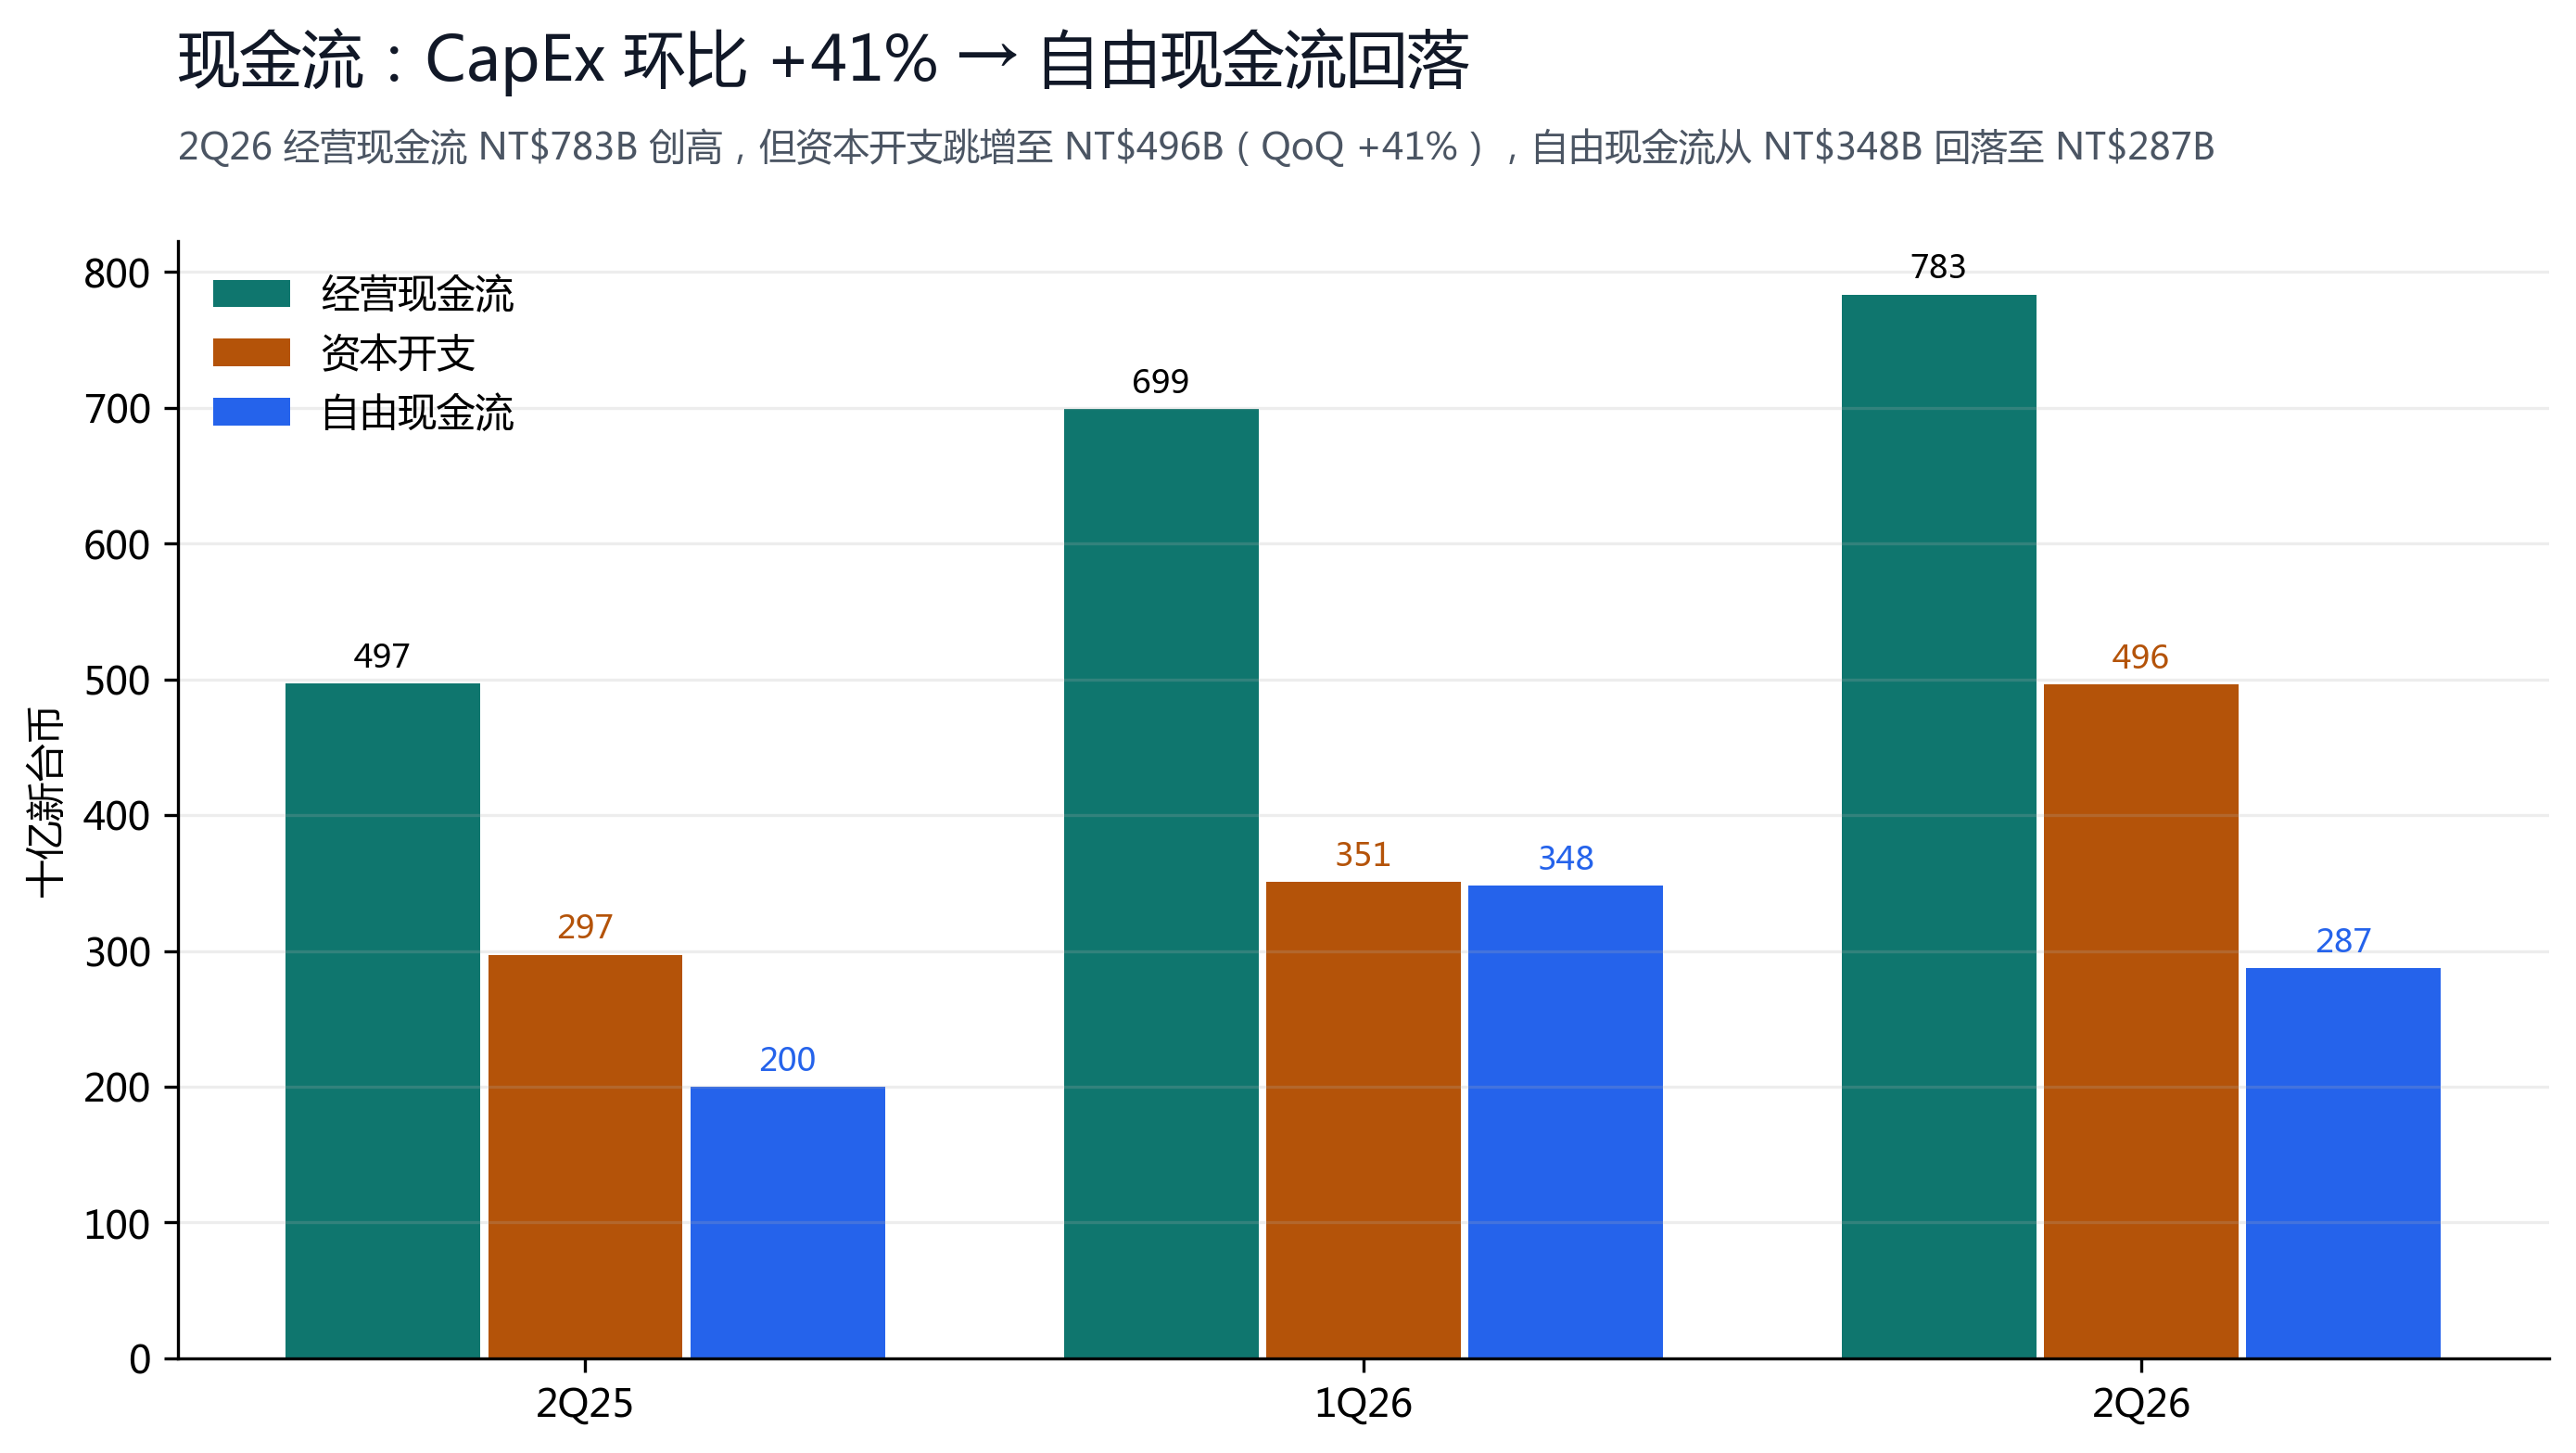
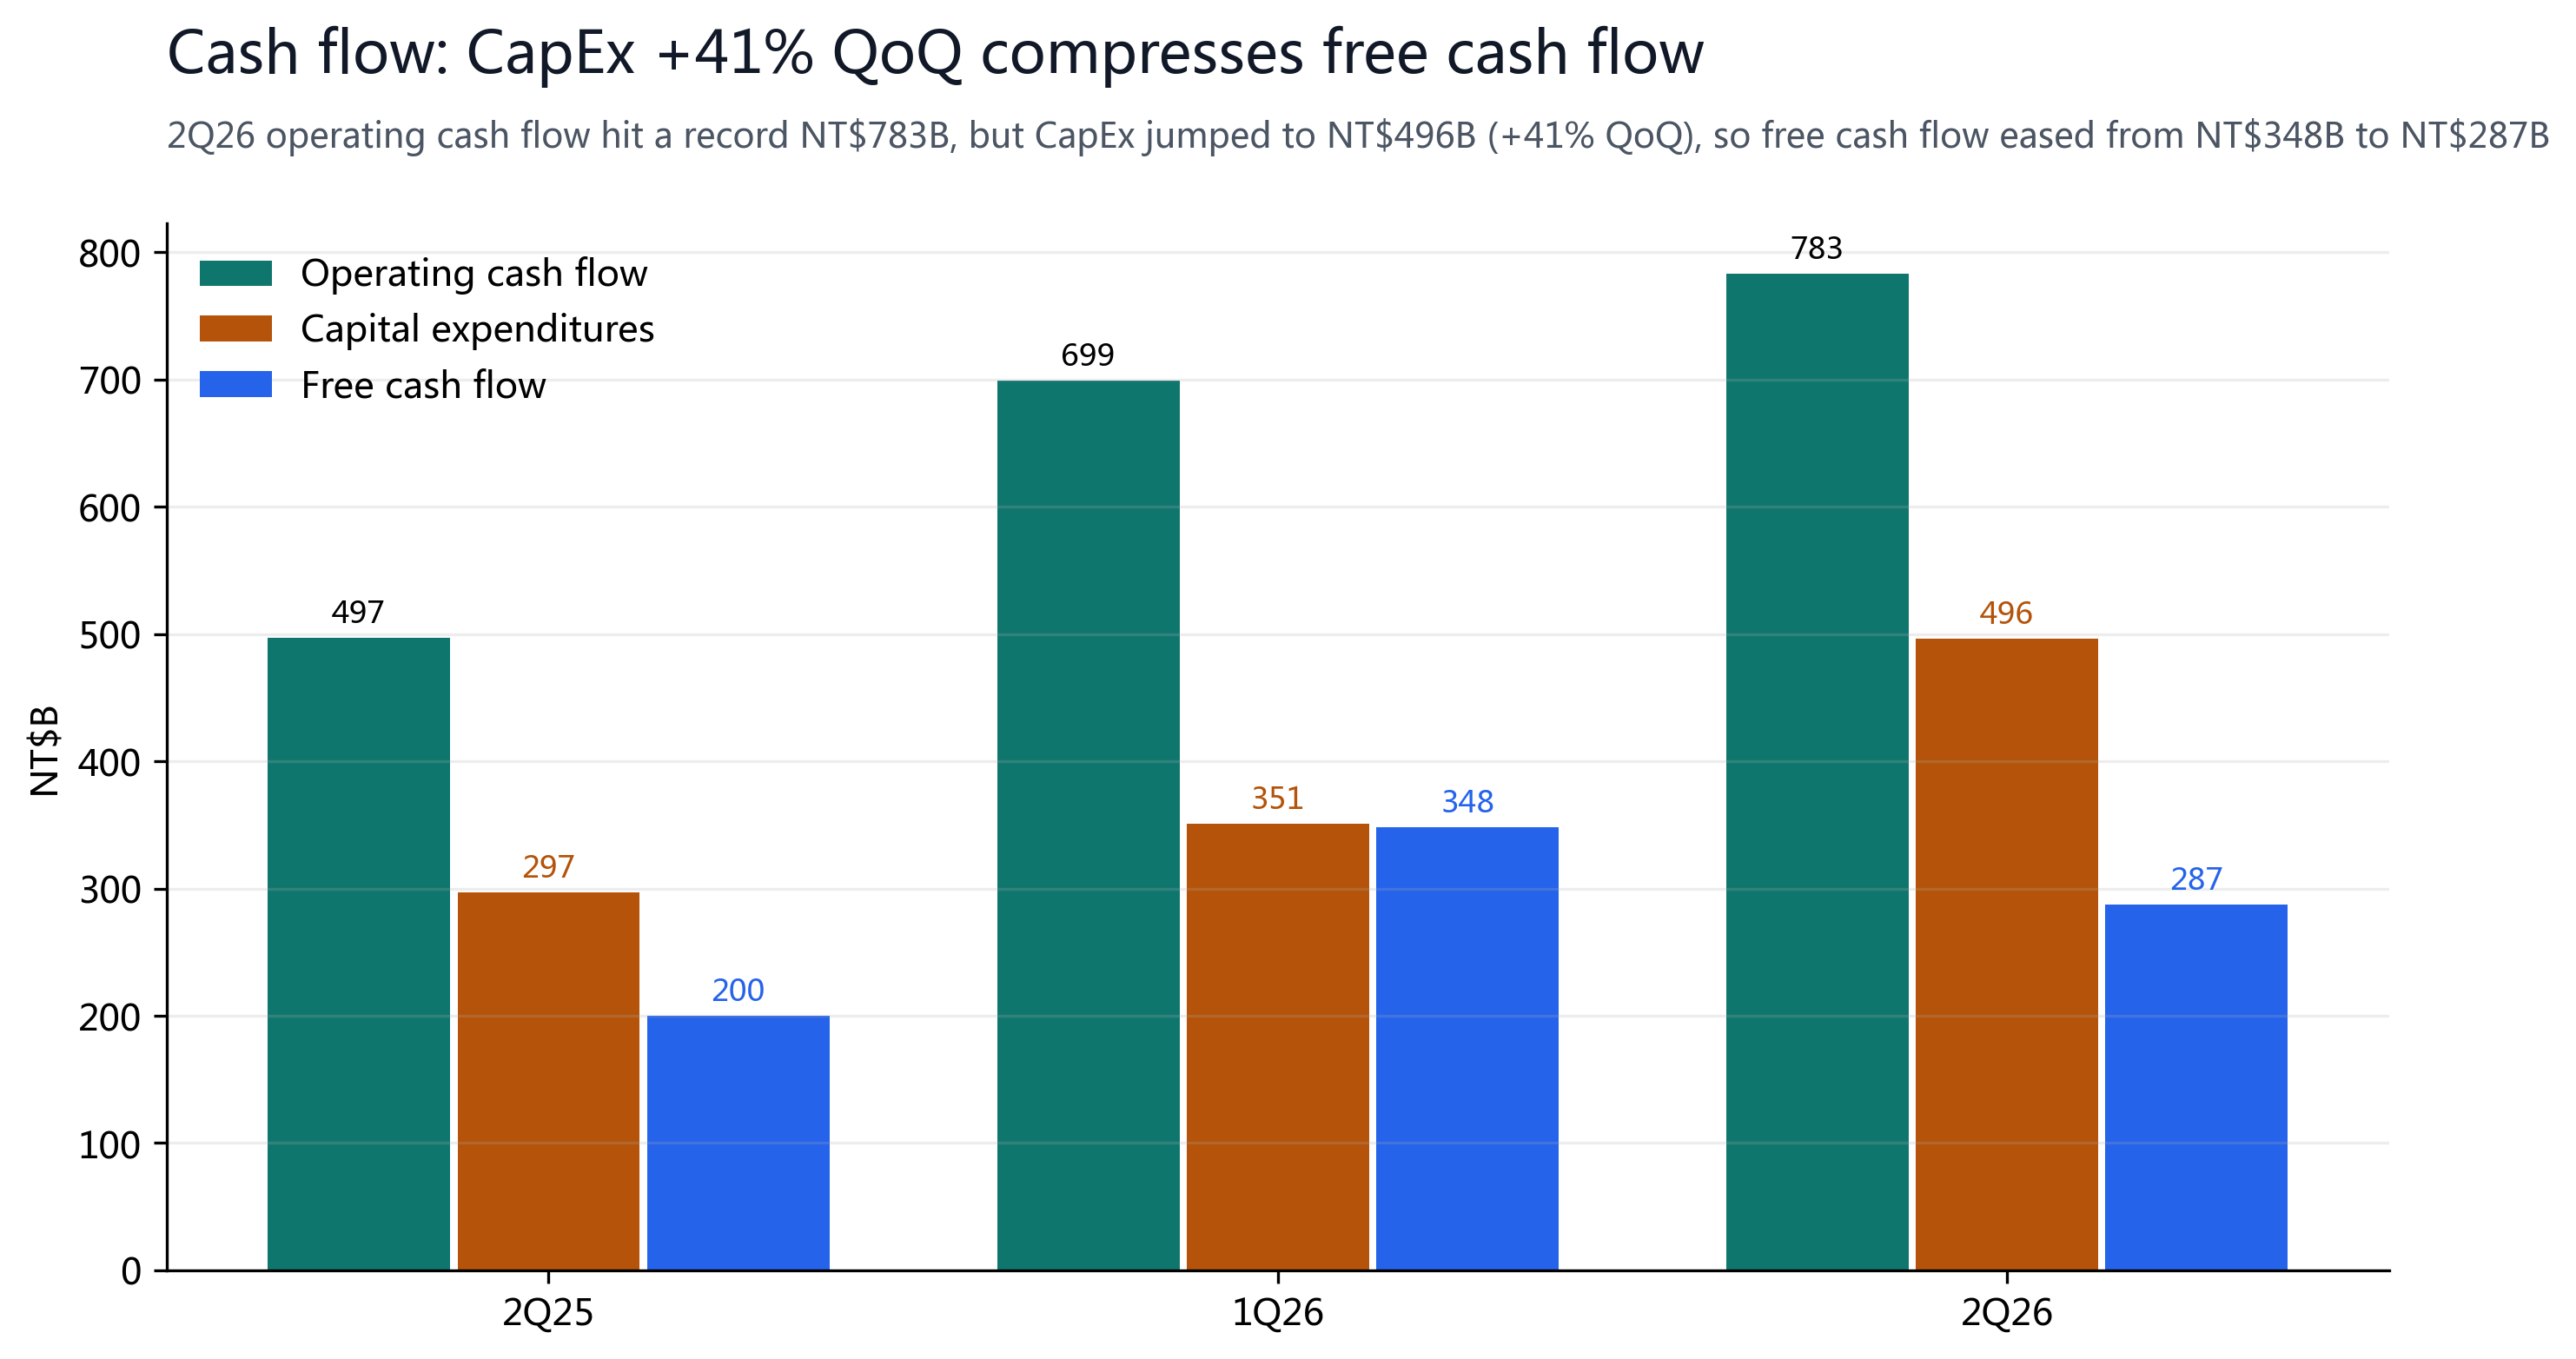
The other side of cash flow is capex: operating cash flow hit a record NT$783B this quarter, but capital expenditures jumped to NT$496B (+41% QoQ, +67% YoY), pulling free cash flow down from NT$348B to NT$287B. This is the inevitable cost of AI expansion — to meet data-center compute demand, TSMC must keep adding advanced capacity. Free cash flow will swing with the build-out pace in the near term, but as long as AI demand materializes, this capex converts into future volume and price. A/R days rose to 29 and inventory days to 87, a mild lengthening of working capital worth tracking but not a concern today.
§07Valuation and Price Target
TSMC is a consistently profitable large-cap leader, so we use a weighted multi-multiple approach rather than the sum-of-the-parts used for loss-makers. We anchor on forward EPS (in ADR/USD terms) to strip out this quarter's one-time VIS gain from GAAP net income.
| Method | Formula | PT | Weight |
|---|---|---|---|
| FY27E P/E (primary) | FY27E EPS $21.24 × 24.0x | $510 | 45% |
| FY26E P/E (near-term) | FY26E EPS $17.05 × 27.0x | $460 | 25% |
| Street consensus check | 18-analyst mean $520 | $520 | 30% |
| Weighted PT | 0.45×510 + 0.25×460 + 0.30×520 | $500 | 100% |
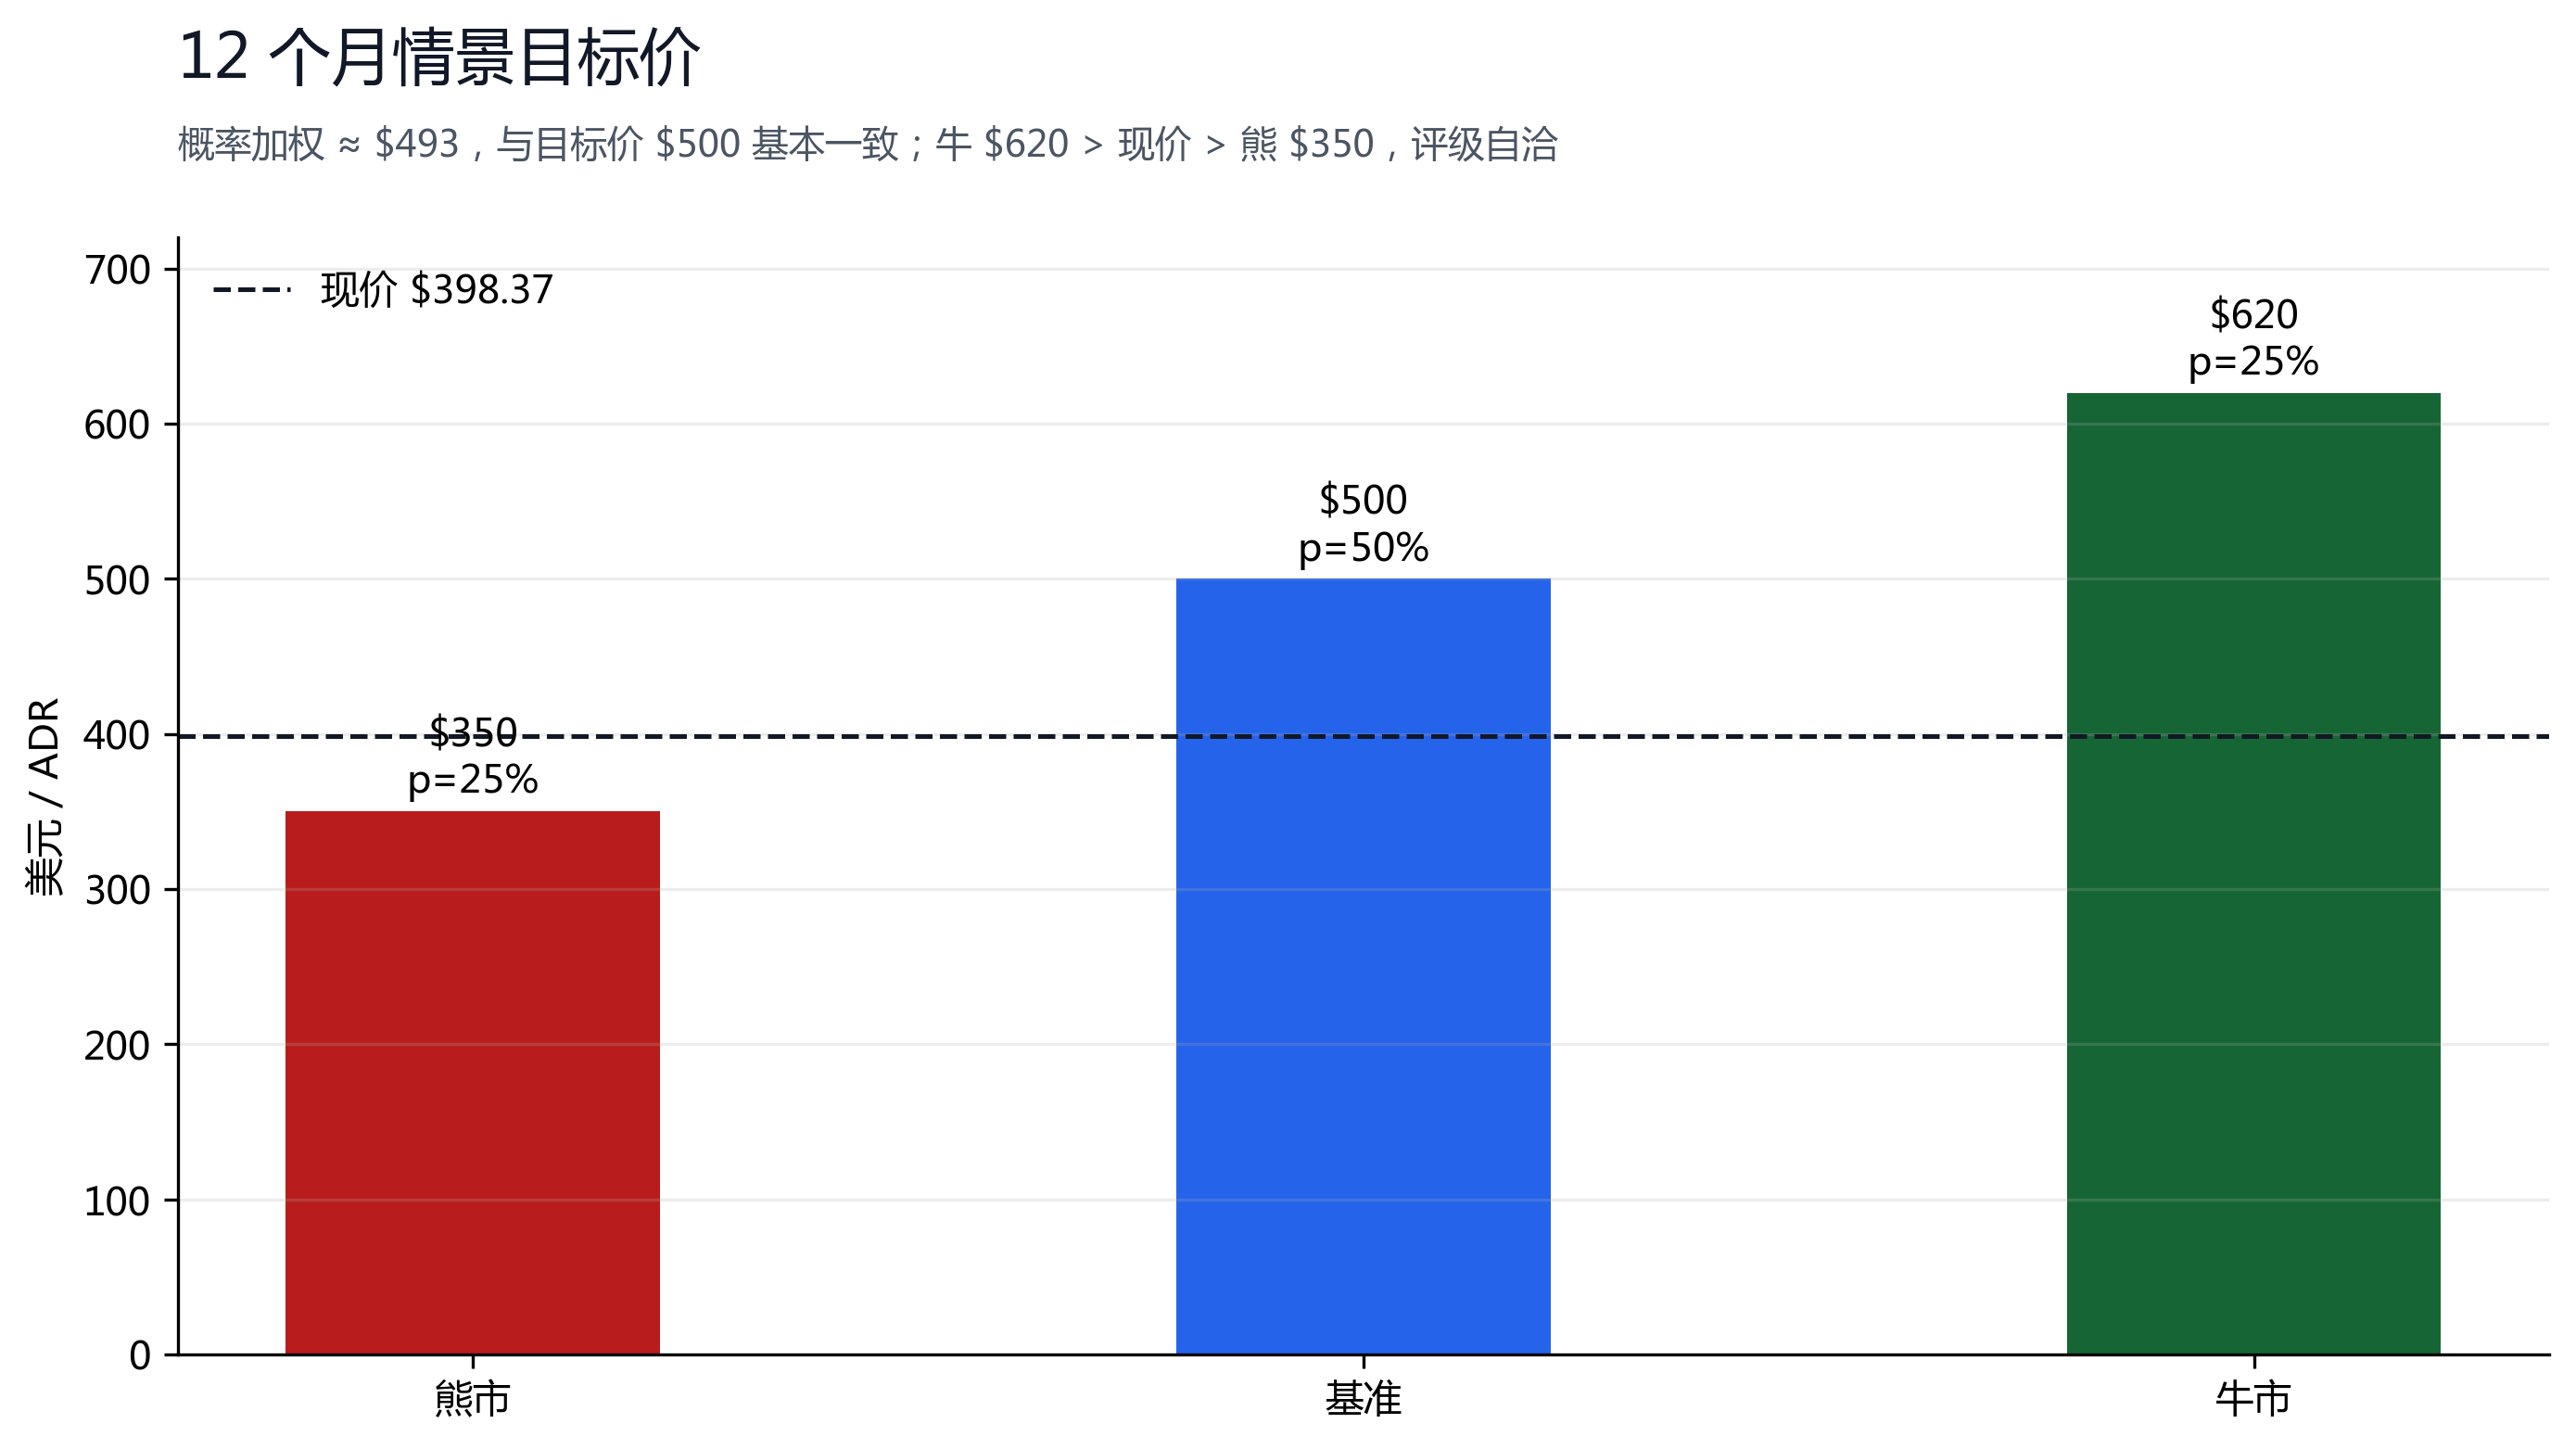
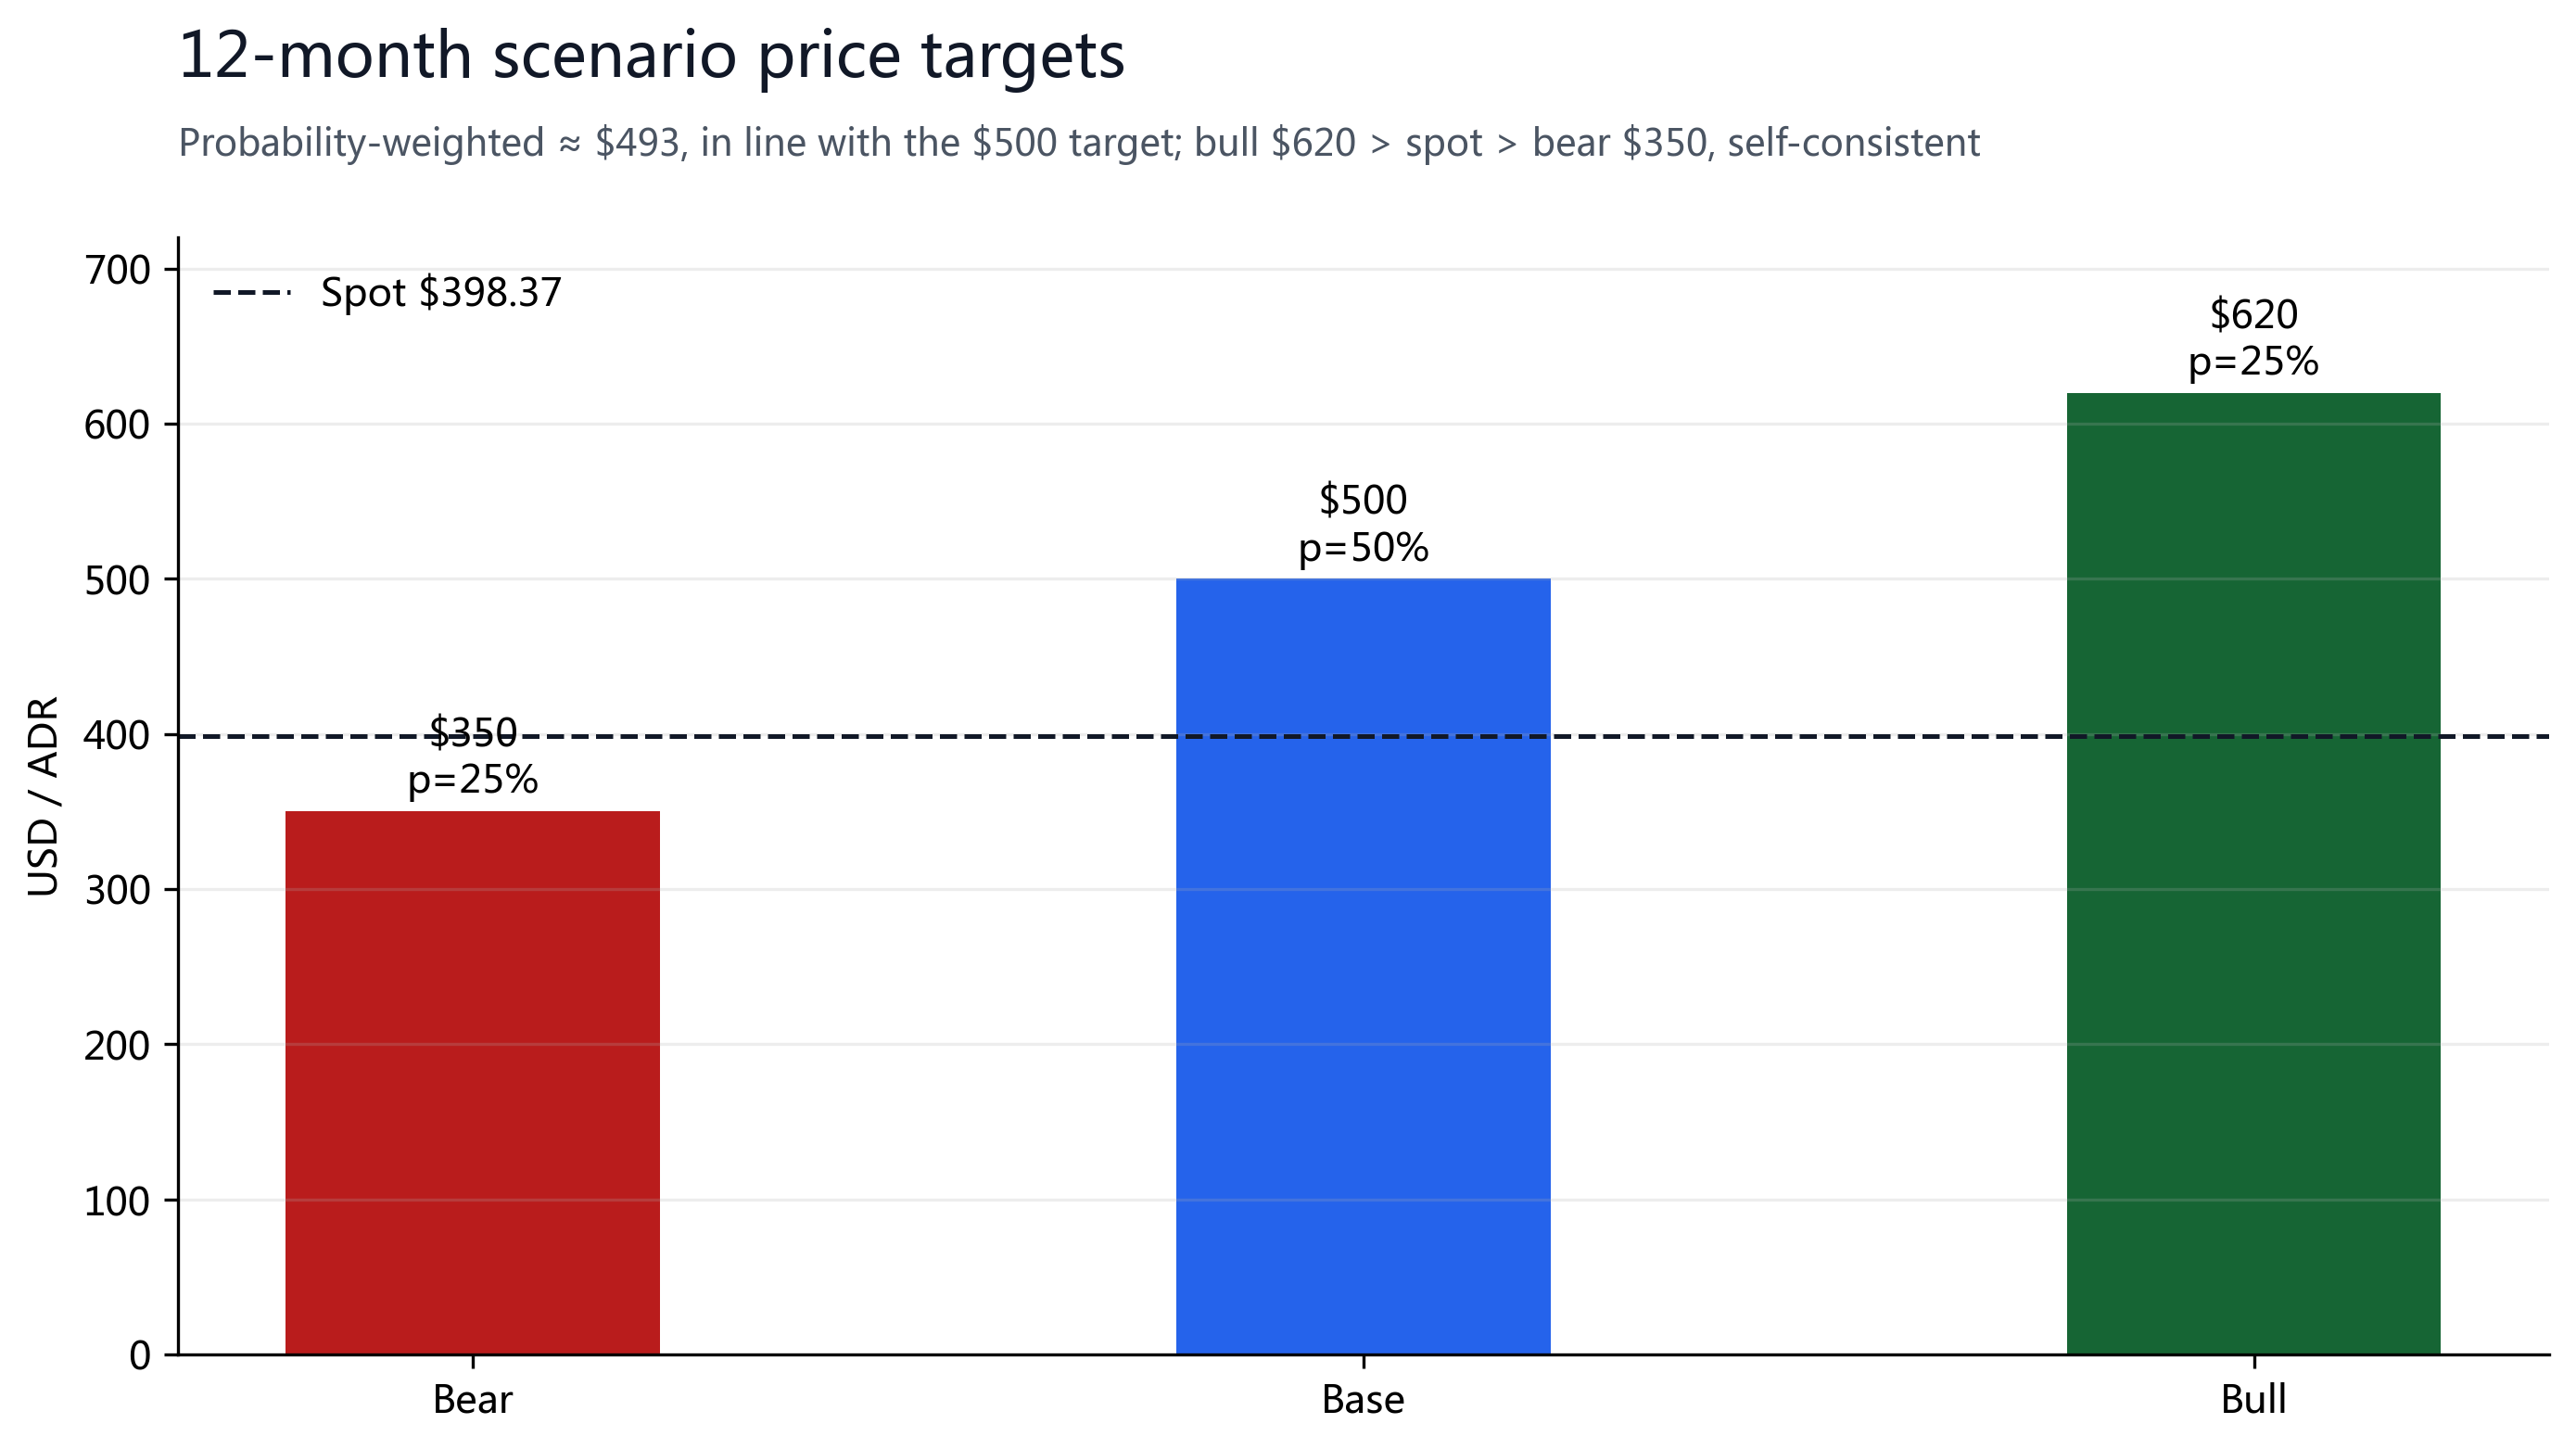
The three methods weight to a 12-month price target of $500 (+25.5% vs spot). A 24x FY27E multiple is not aggressive for a company growing revenue ~+25% with a 60% operating margin and a near-monopoly at the leading edge (PEG ≈ 1.0); we sit slightly below the $520 consensus mean to reflect capex pressure on cash flow and geopolitical uncertainty. Three scenarios — Bear $350 / Base $500 / Bull $620 at 25/50/25 probabilities — weight to about $493, in line with the target; the bull case $620 is above spot and the bear case $350 below it, so the rating and scenarios are self-consistent.
§08Catalysts and Risks
| Date / Window | Event | Direction |
|---|---|---|
| 2026-09-16 | 1Q26 cash dividend ex-date (NT$7.00/share) | Steady dividend, neutral-to-positive |
| Mid-Oct 2026 | 3Q26 earnings | Decisive: validate continued AI demand, margin durability, capex/FCF balance |
| 2H 2026 | 2nm (N2) ramp + A13 node + Sony imaging deal | Positive: a fresh volume-and-price layer plus customer expansion |
| Ongoing | U.S. tariffs/export controls + cross-strait risk + NT$ FX | Bearish tail risk; disturbs supply-demand and FX translation |
(1) the AI capex cycle peaks or data-center investment slows, directly hitting the 66% HPC platform;
(2) capex keeps surging (+41% QoQ this quarter) and free cash flow misses;
(3) geopolitics: cross-strait tensions, U.S. export controls on China, and potential tariffs disturb supply-demand and capacity footprint;
(4) a stronger Taiwan dollar erodes the USD translation of revenue and profit;
(5) advanced-node ramp or yield disappoints (e.g., a bumpy 2nm climb).
Upside risk: if AI demand keeps beating, 2nm ramps faster than planned, and the company raises full-year revenue and capex guidance, the multiple could re-rate above the $520 consensus mean, mapping to the $620 bull case.
§09Sources, Limits and Disclosure
- TSMC 2Q 2026 earnings conference materials (2026-07-16): statements of comprehensive income / balance sheet / cash flows / revenue by technology and platform / recent major events
- Price, market cap, 52-week range, analyst targets and forward-EPS consensus (FY26E $17.05 / FY27E $21.24), rating split: Yahoo Finance (TSM and 2330.TW, 2026-07-17 close)
- One-time gain attribution: TSMC recent-events disclosure “sold 8.1% of Vanguard” (2026-05-15); spot USD/TWD 32.33 (Yahoo Finance)
Limitations: ch01 uses real price anchors rather than a weekly curve (no verified OHLC series, so no illustrative price chart is drawn); operating income is computed as revenue × the official operating margin; the after-tax amount of the one-time VIS gain is not broken out in the release, so the clean net income/EPS/margin are author estimates (assuming ~10% tax on the disposal gain); specific 3Q26 and full-year company guidance figures are not in the materials obtained, so this report cites no specific guidance and uses analyst consensus for forward EPS; the ADR premium is computed at the spot FX rate and will fluctuate; fields without a public source (beta, institutional ownership %, options IV, insider trades) were not fabricated. This report is not investment advice.