Space Exploration Technologies Corp.NASDAQ:SPCX
Published 2026-08-05, with market data as of the 2026-08-04 close. All financials are sourced from SpaceX's first post-IPO quarterly report (Form 10-Q / 8-K earnings release, issued 2026-08-04, quarter ended 2026-06-30) and the S-1 prospectus.
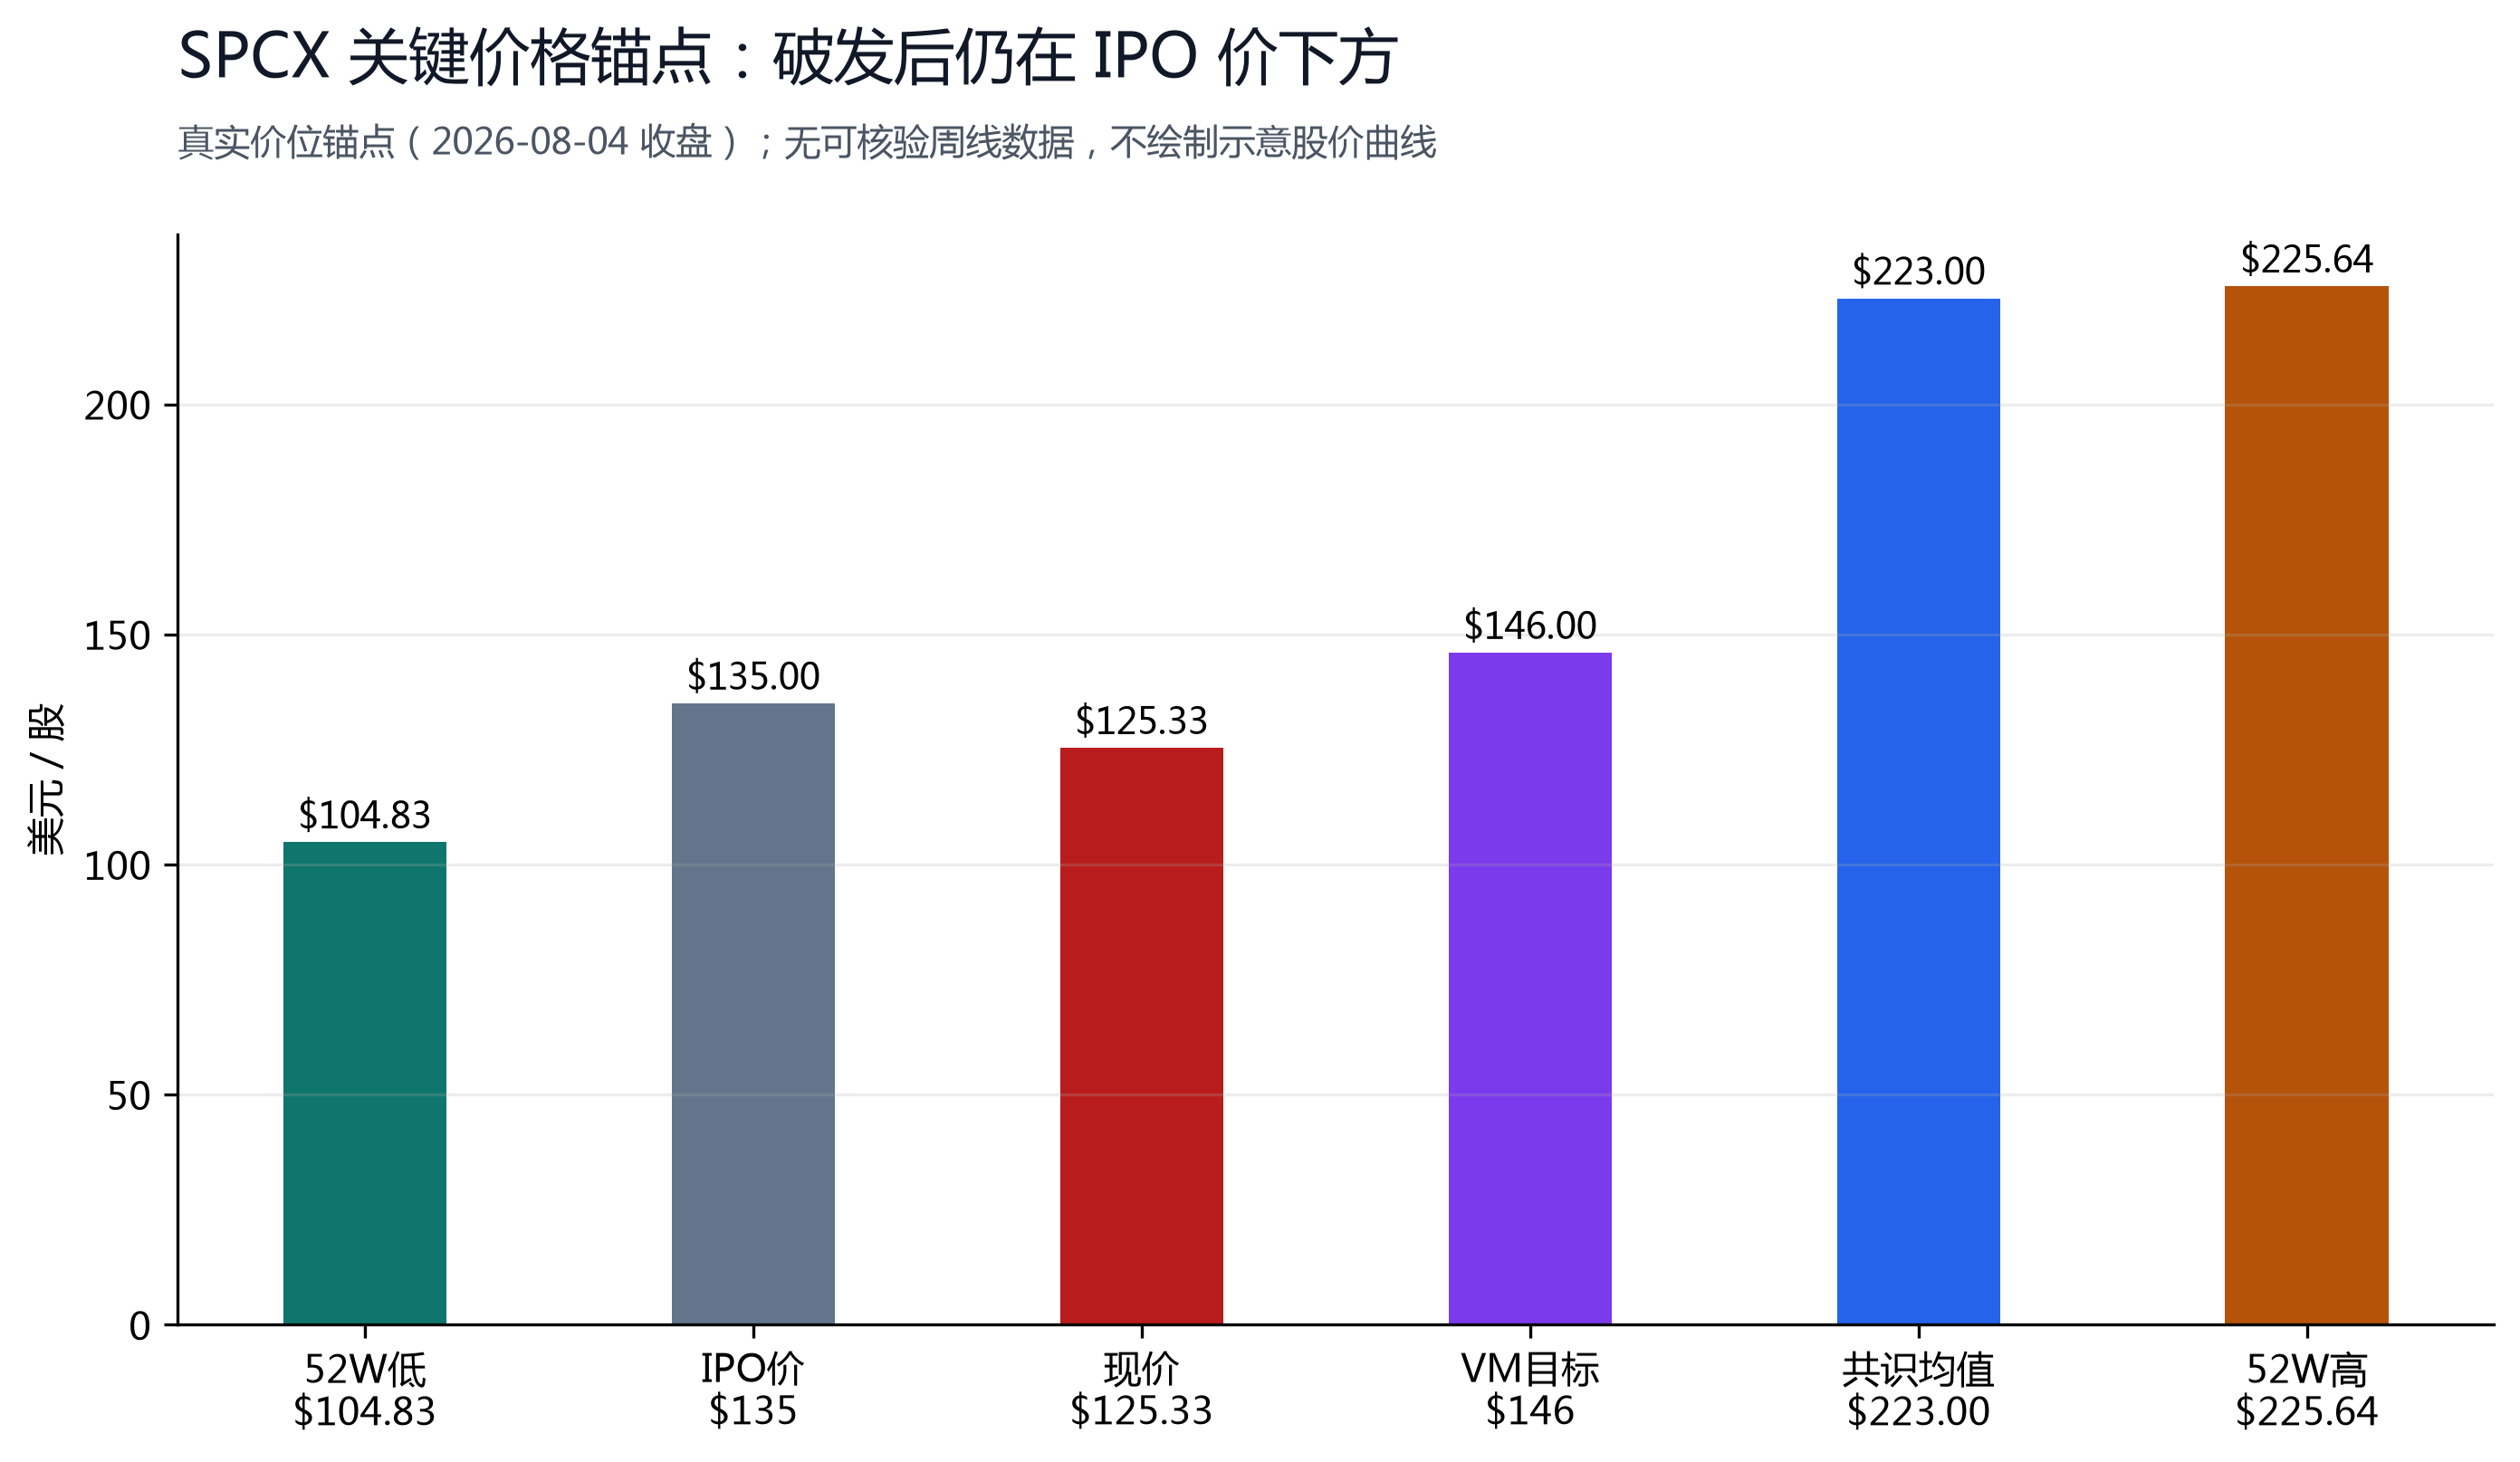
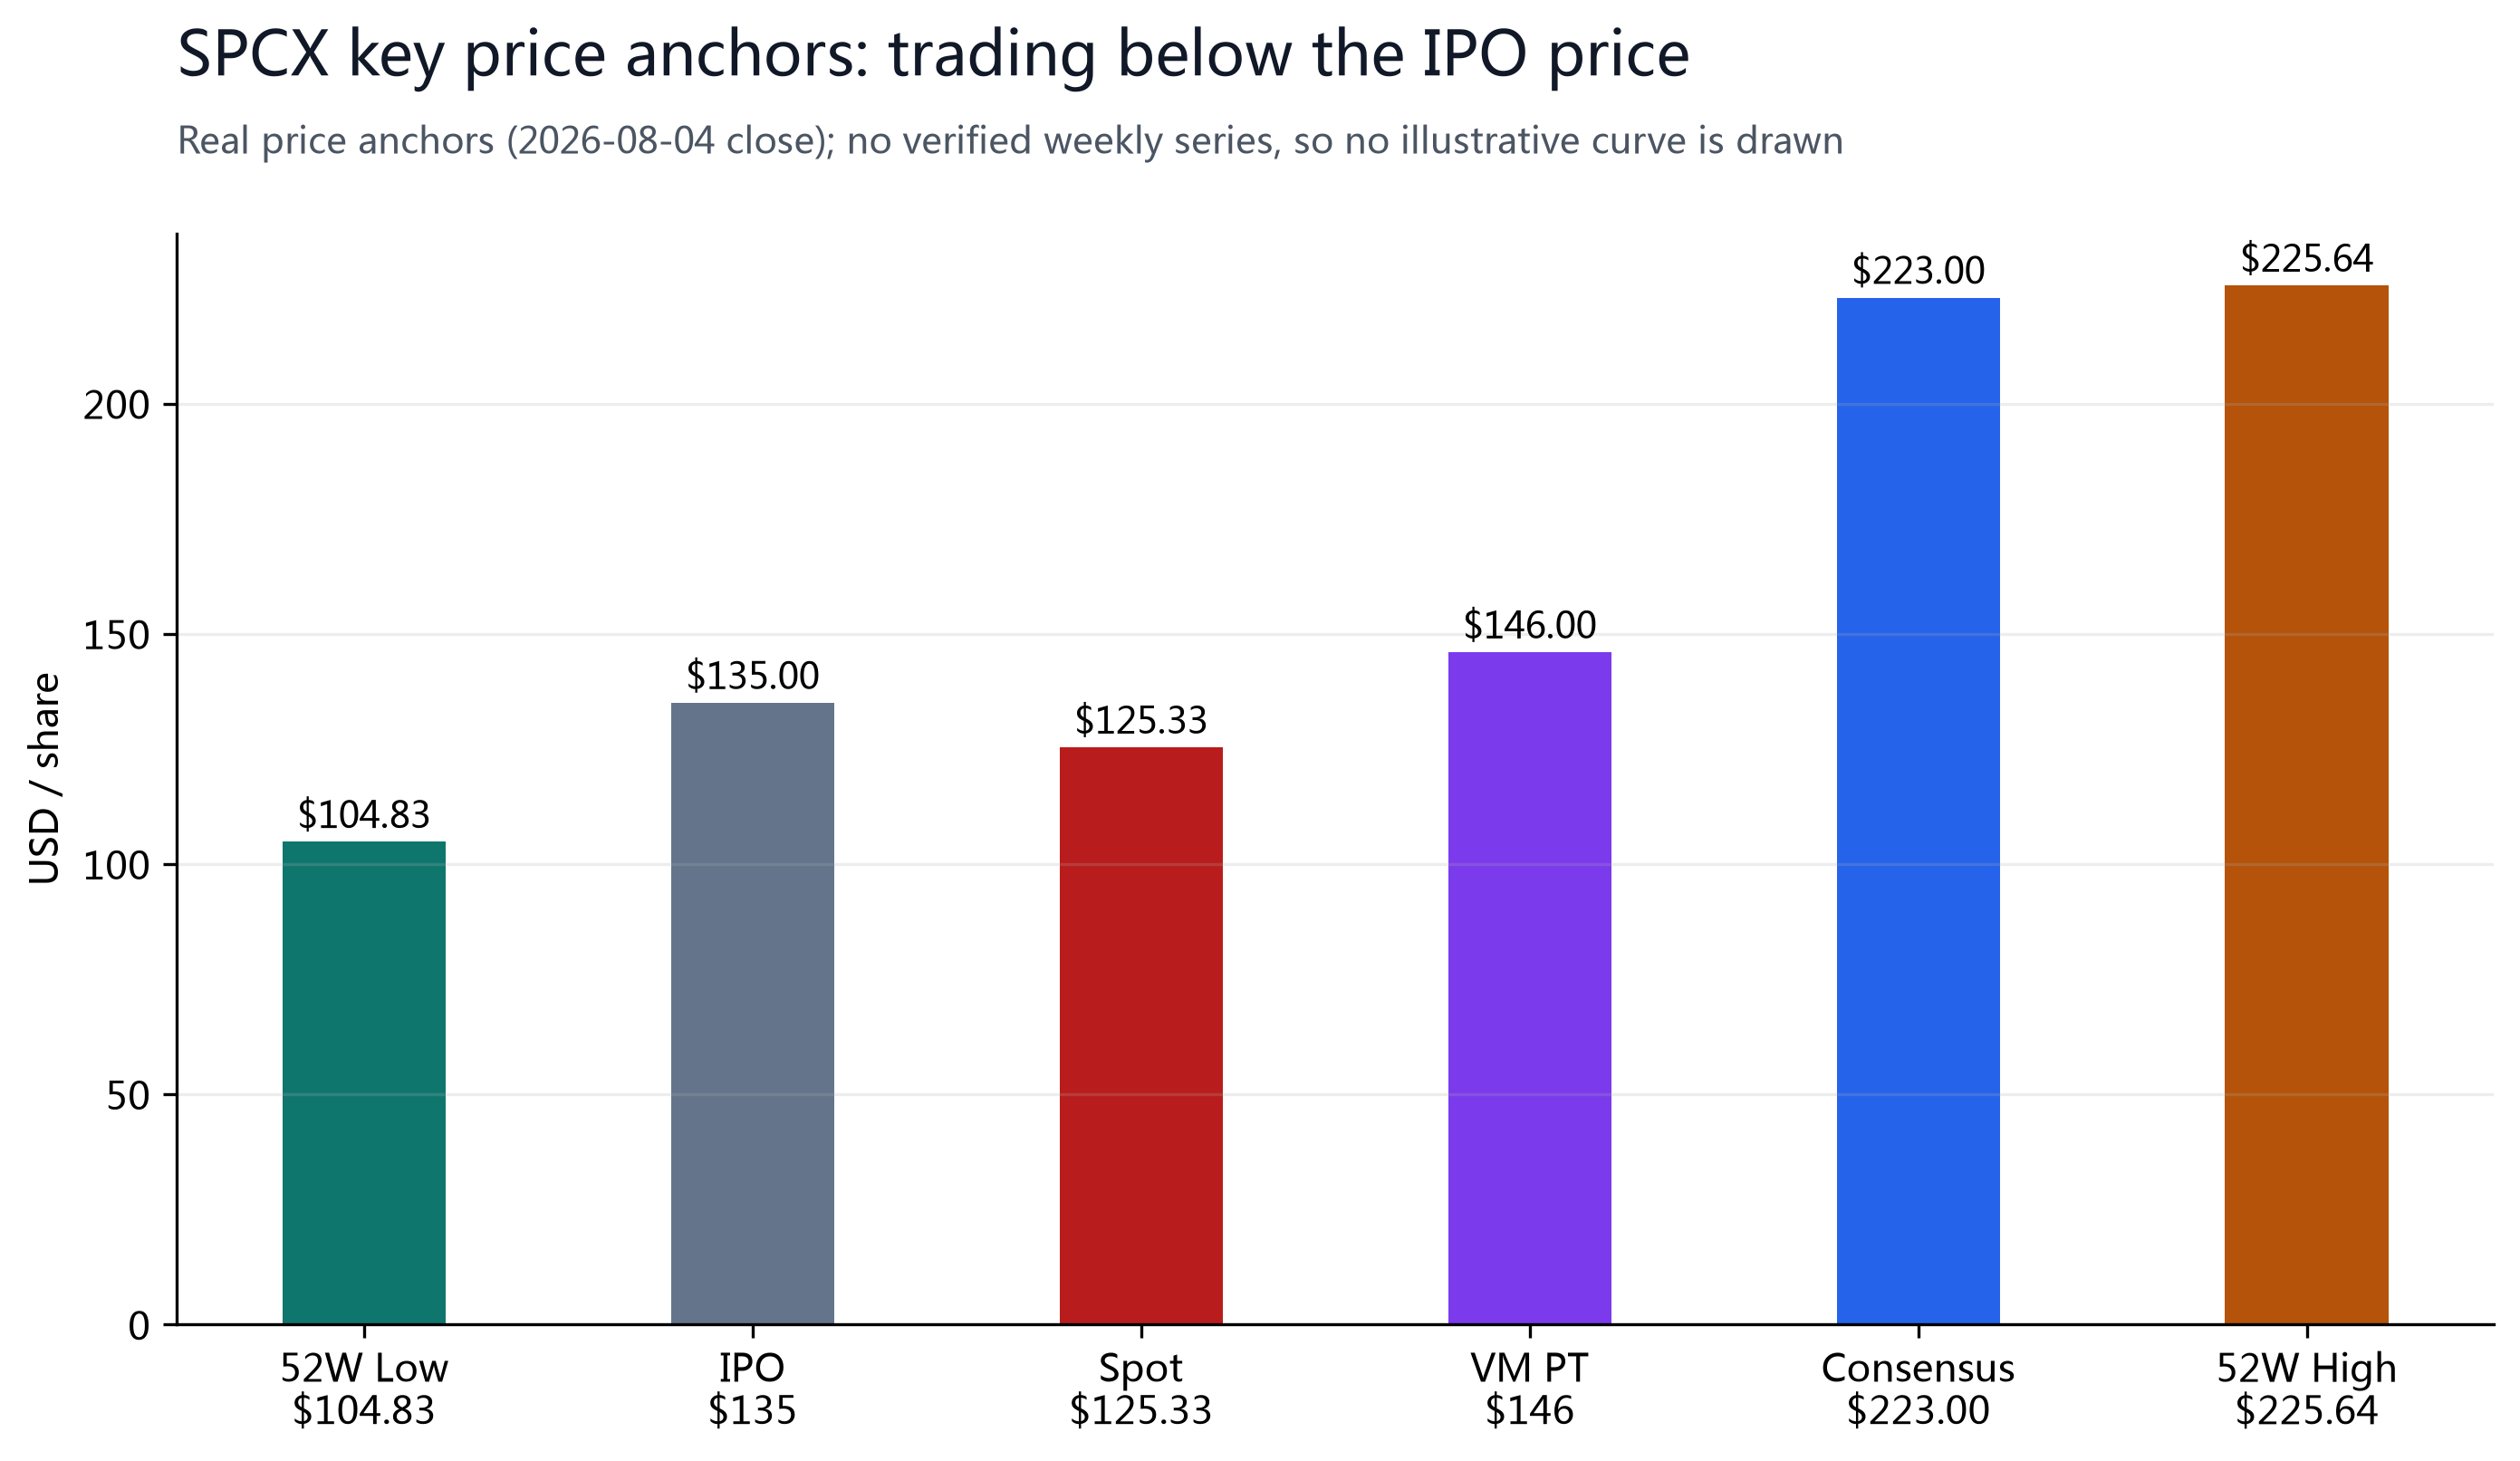
SpaceX completed the largest IPO in history on 2026-06-12 at $135/share (market cap $1.77T), spiked to an intraday high of $225.64 on June 16, then fell steadily; on the August 4 earnings day it closed at $125.33 (+9.43%), 7.2% below the IPO price and -44.5% off the high. Q2'26 revenue was $7,814M (+92% YoY), adjusted EBITDA $3,538M (+192%), and the net loss narrowed to $541M — all beating estimates; but AI-segment capex of $15.8B (total capex $18.4B) far exceeded expectations and the stock fell nearly 9% after hours.
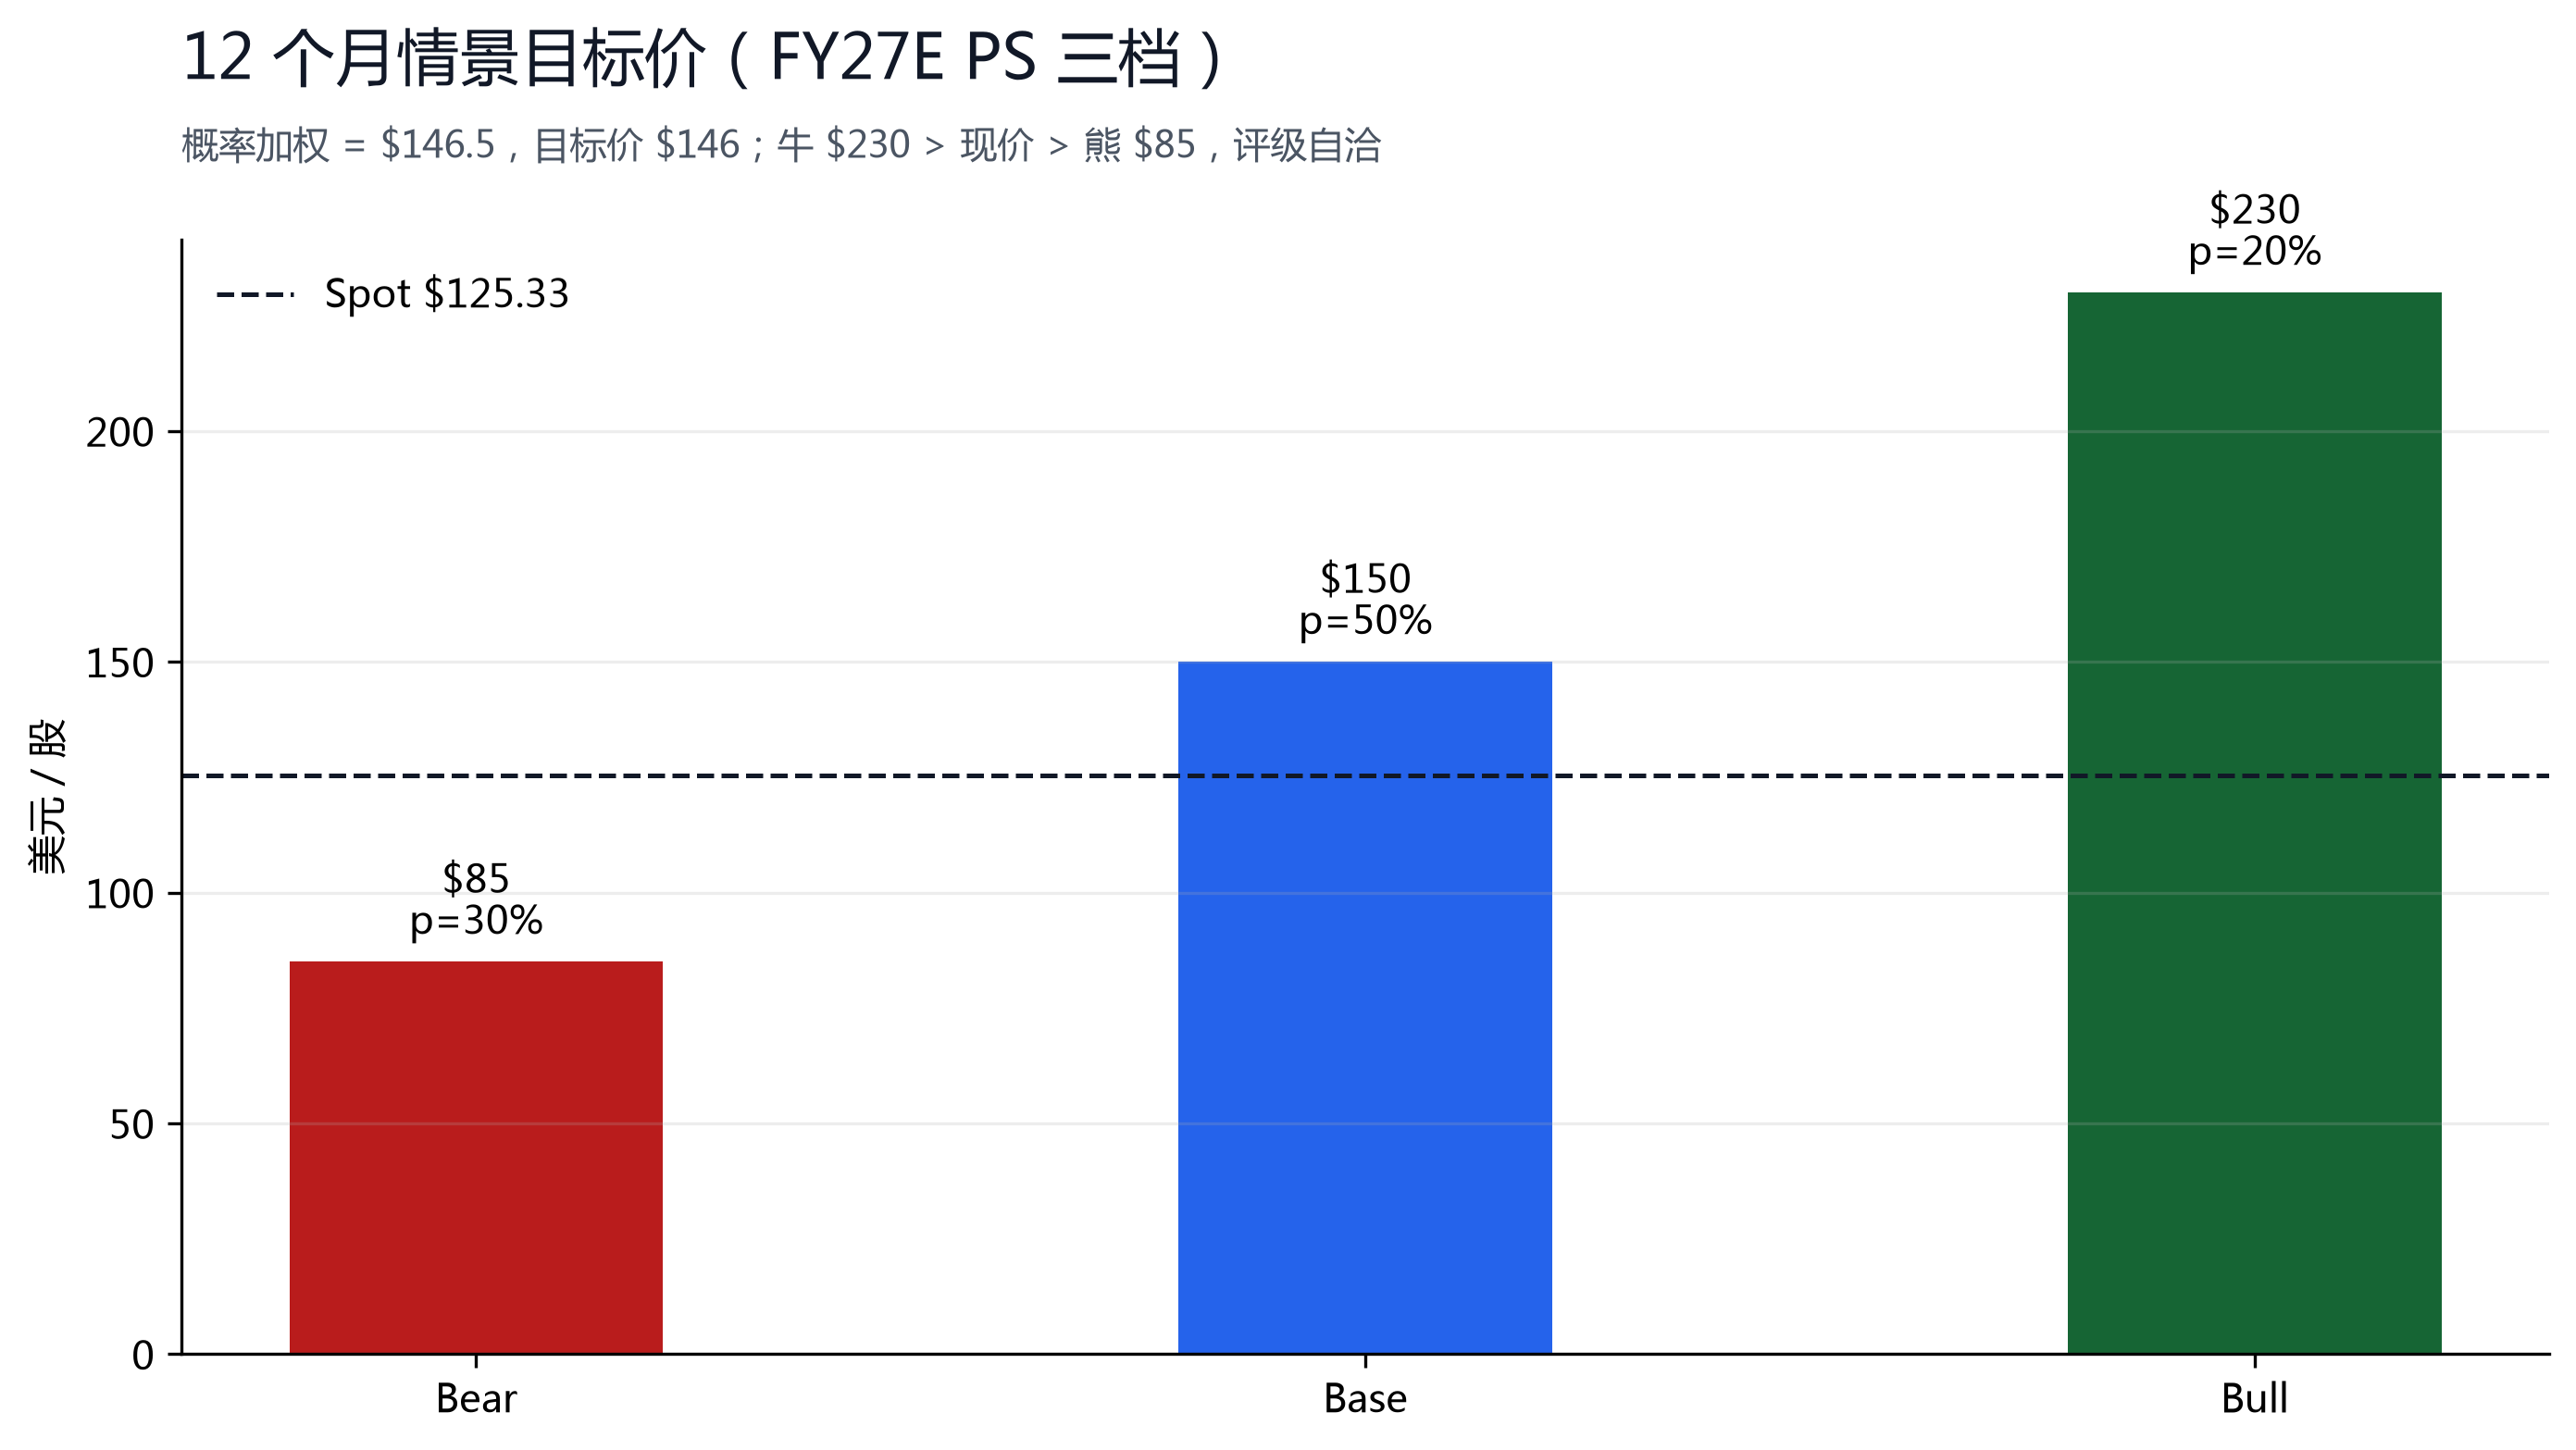
On August 6 (two trading days after earnings) SpaceX's unusual staggered lockup begins releasing about 911M shares (~20% of insider holdings), then 7% every two to three weeks; by December 8 (day 180) the float expands from ~4% to ~40%; Elon Musk's ~6.4B shares (Class B, 40%+ of the company) are separately locked for 366 days to 2027-06-12. We rate SPCX Overweight with Medium conviction and a 12-month target of $146 (+16.9% vs spot): the revenue explosion and loss-narrowing inflection are real, but lockup supply and ~-$25B of free cash flow (H1'26, calculated) cap near-term upside.
§01Investment Summary
SpaceX is torn between two opposing forces. On one side it is one of the fastest-growing public tech companies in history — Q2'26 revenue of $7,814M (+92% YoY), adjusted EBITDA of $3,538M (+192%), Starlink at 12.0M subscribers, the AI segment annualizing above $10B with EBITDA turning positive — a genuine inflection. On the other side, the stock has halved from its post-IPO high in two months and trades 7.2% below the IPO price: $15.8B of single-quarter AI capex spooked the market, a staggered lockup starting August 6 pushes the float from 4% toward 40%, and short interest reached as high as ~32% of the float (S3). We cross-check three FY27E-revenue P/S scenarios (15/27/41x) to a probability-weighted 12-month target of $146.
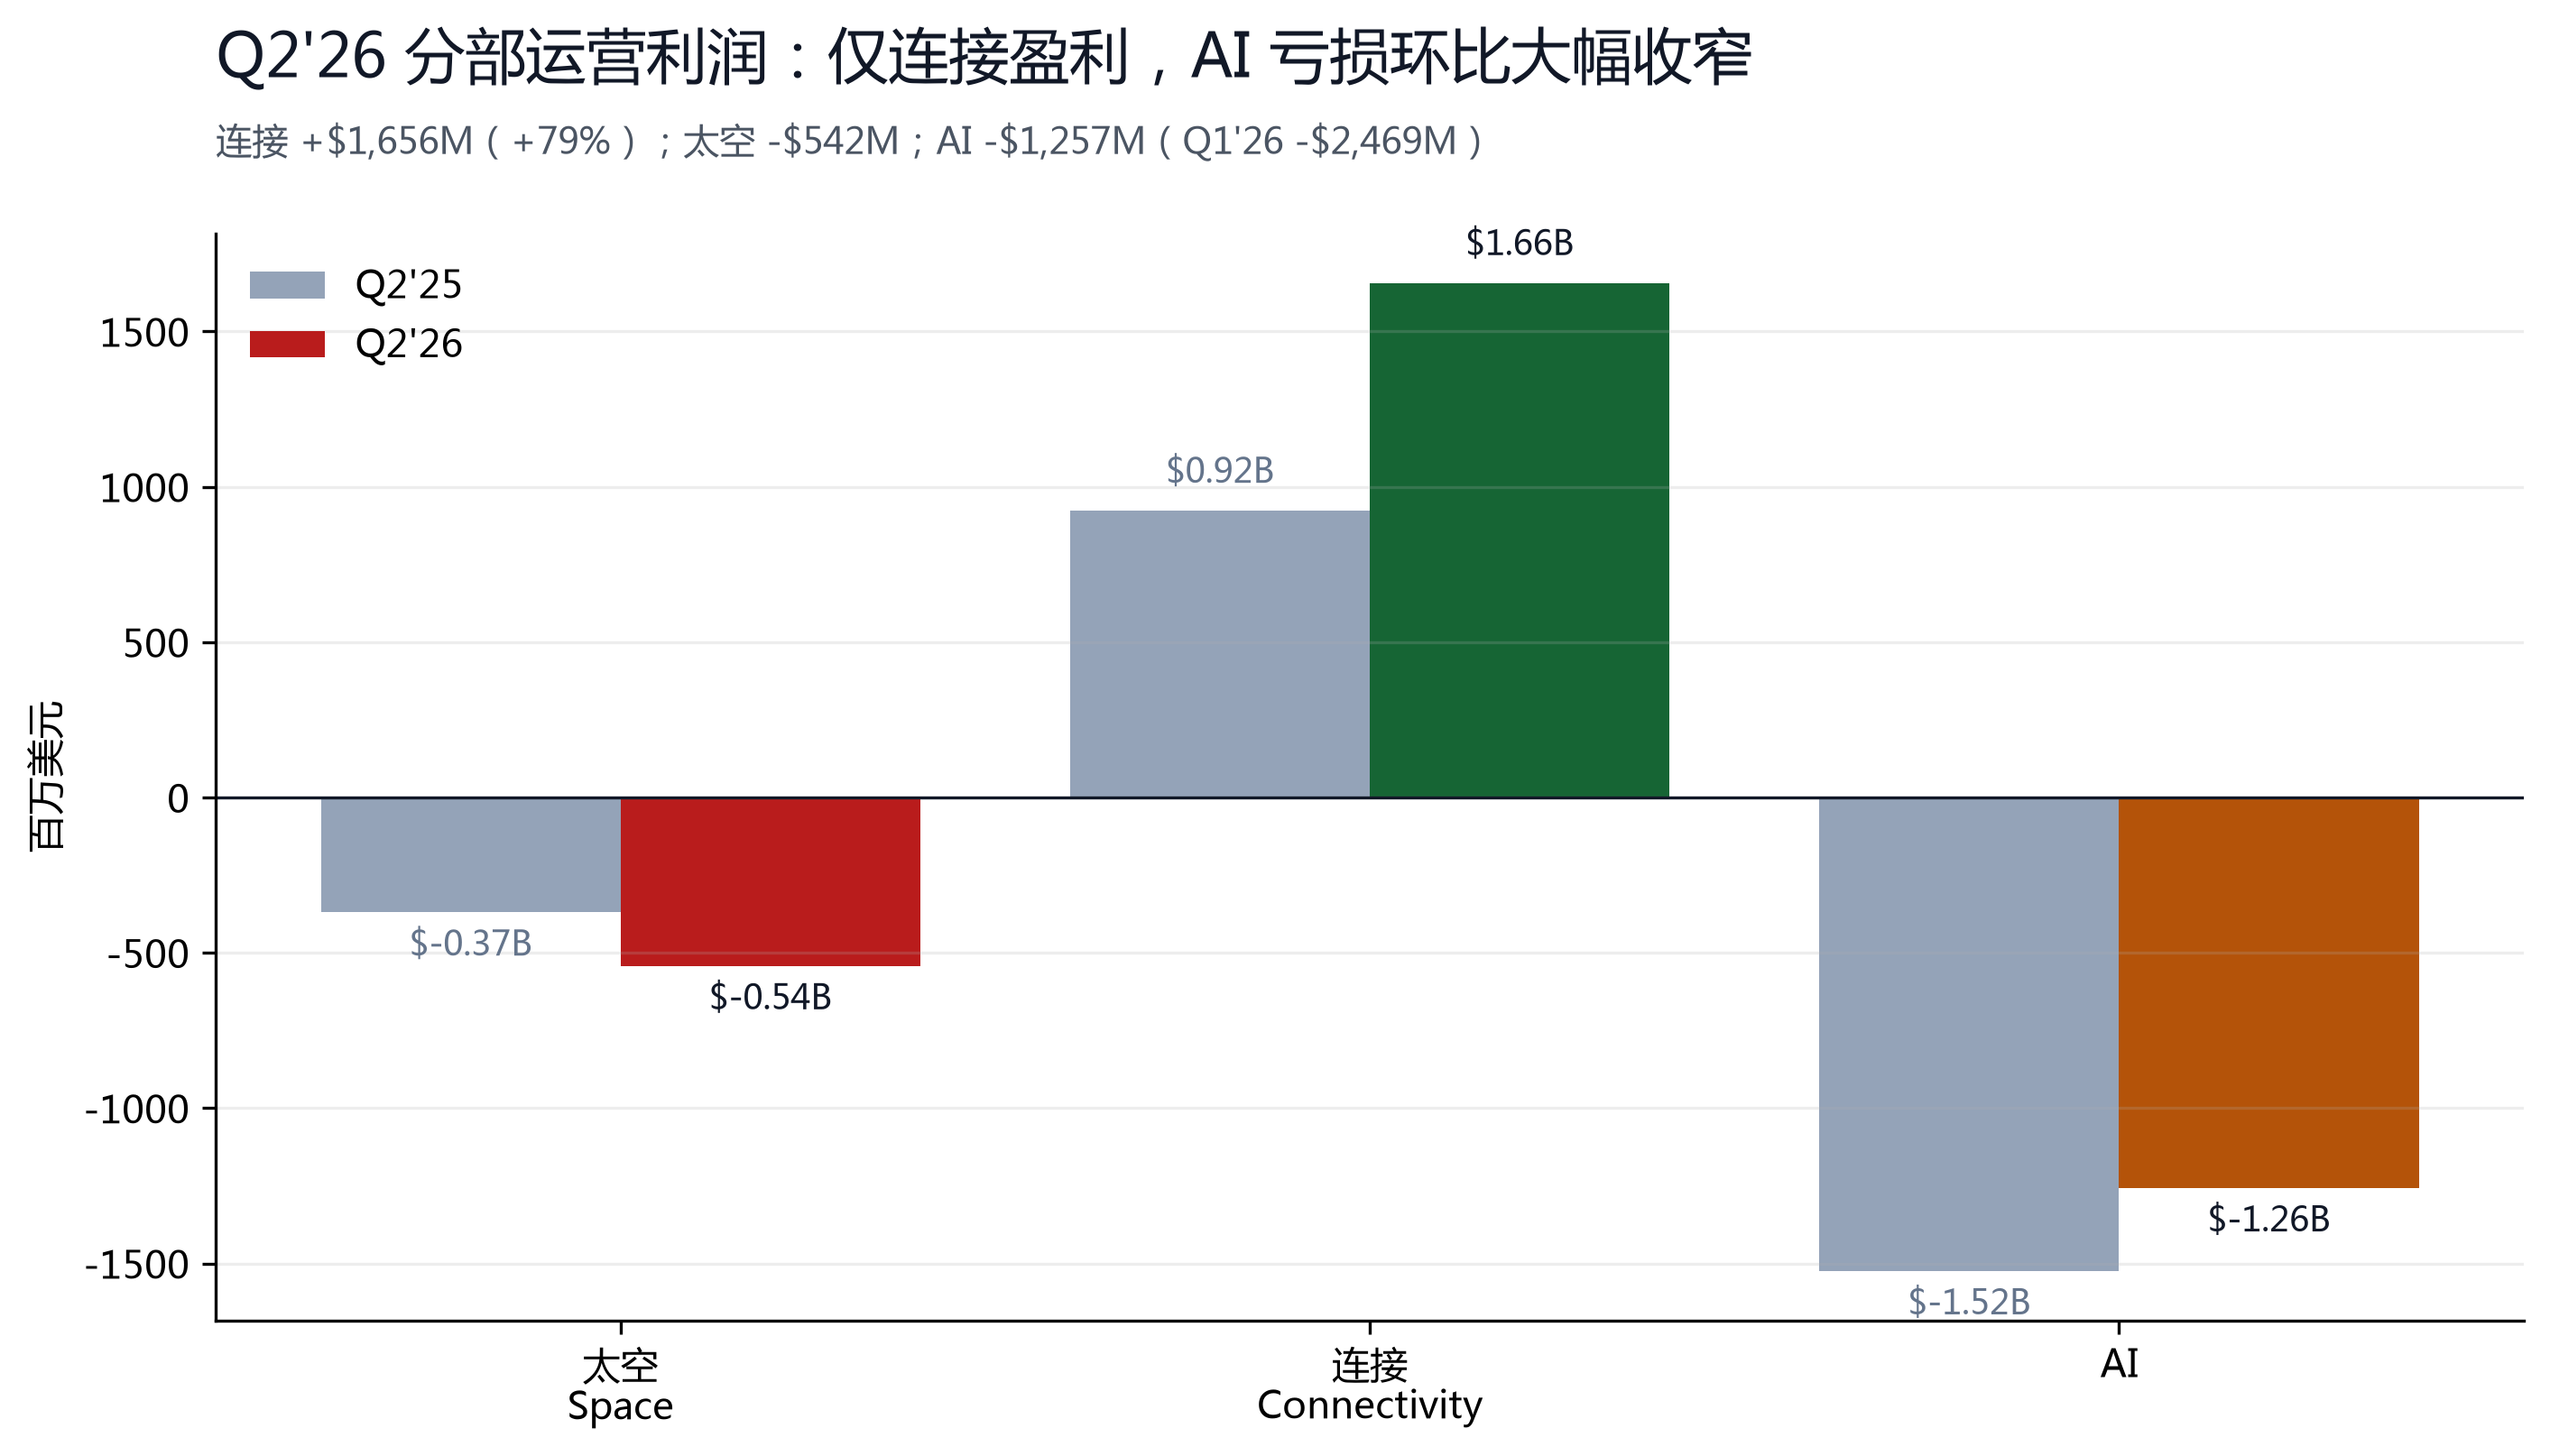
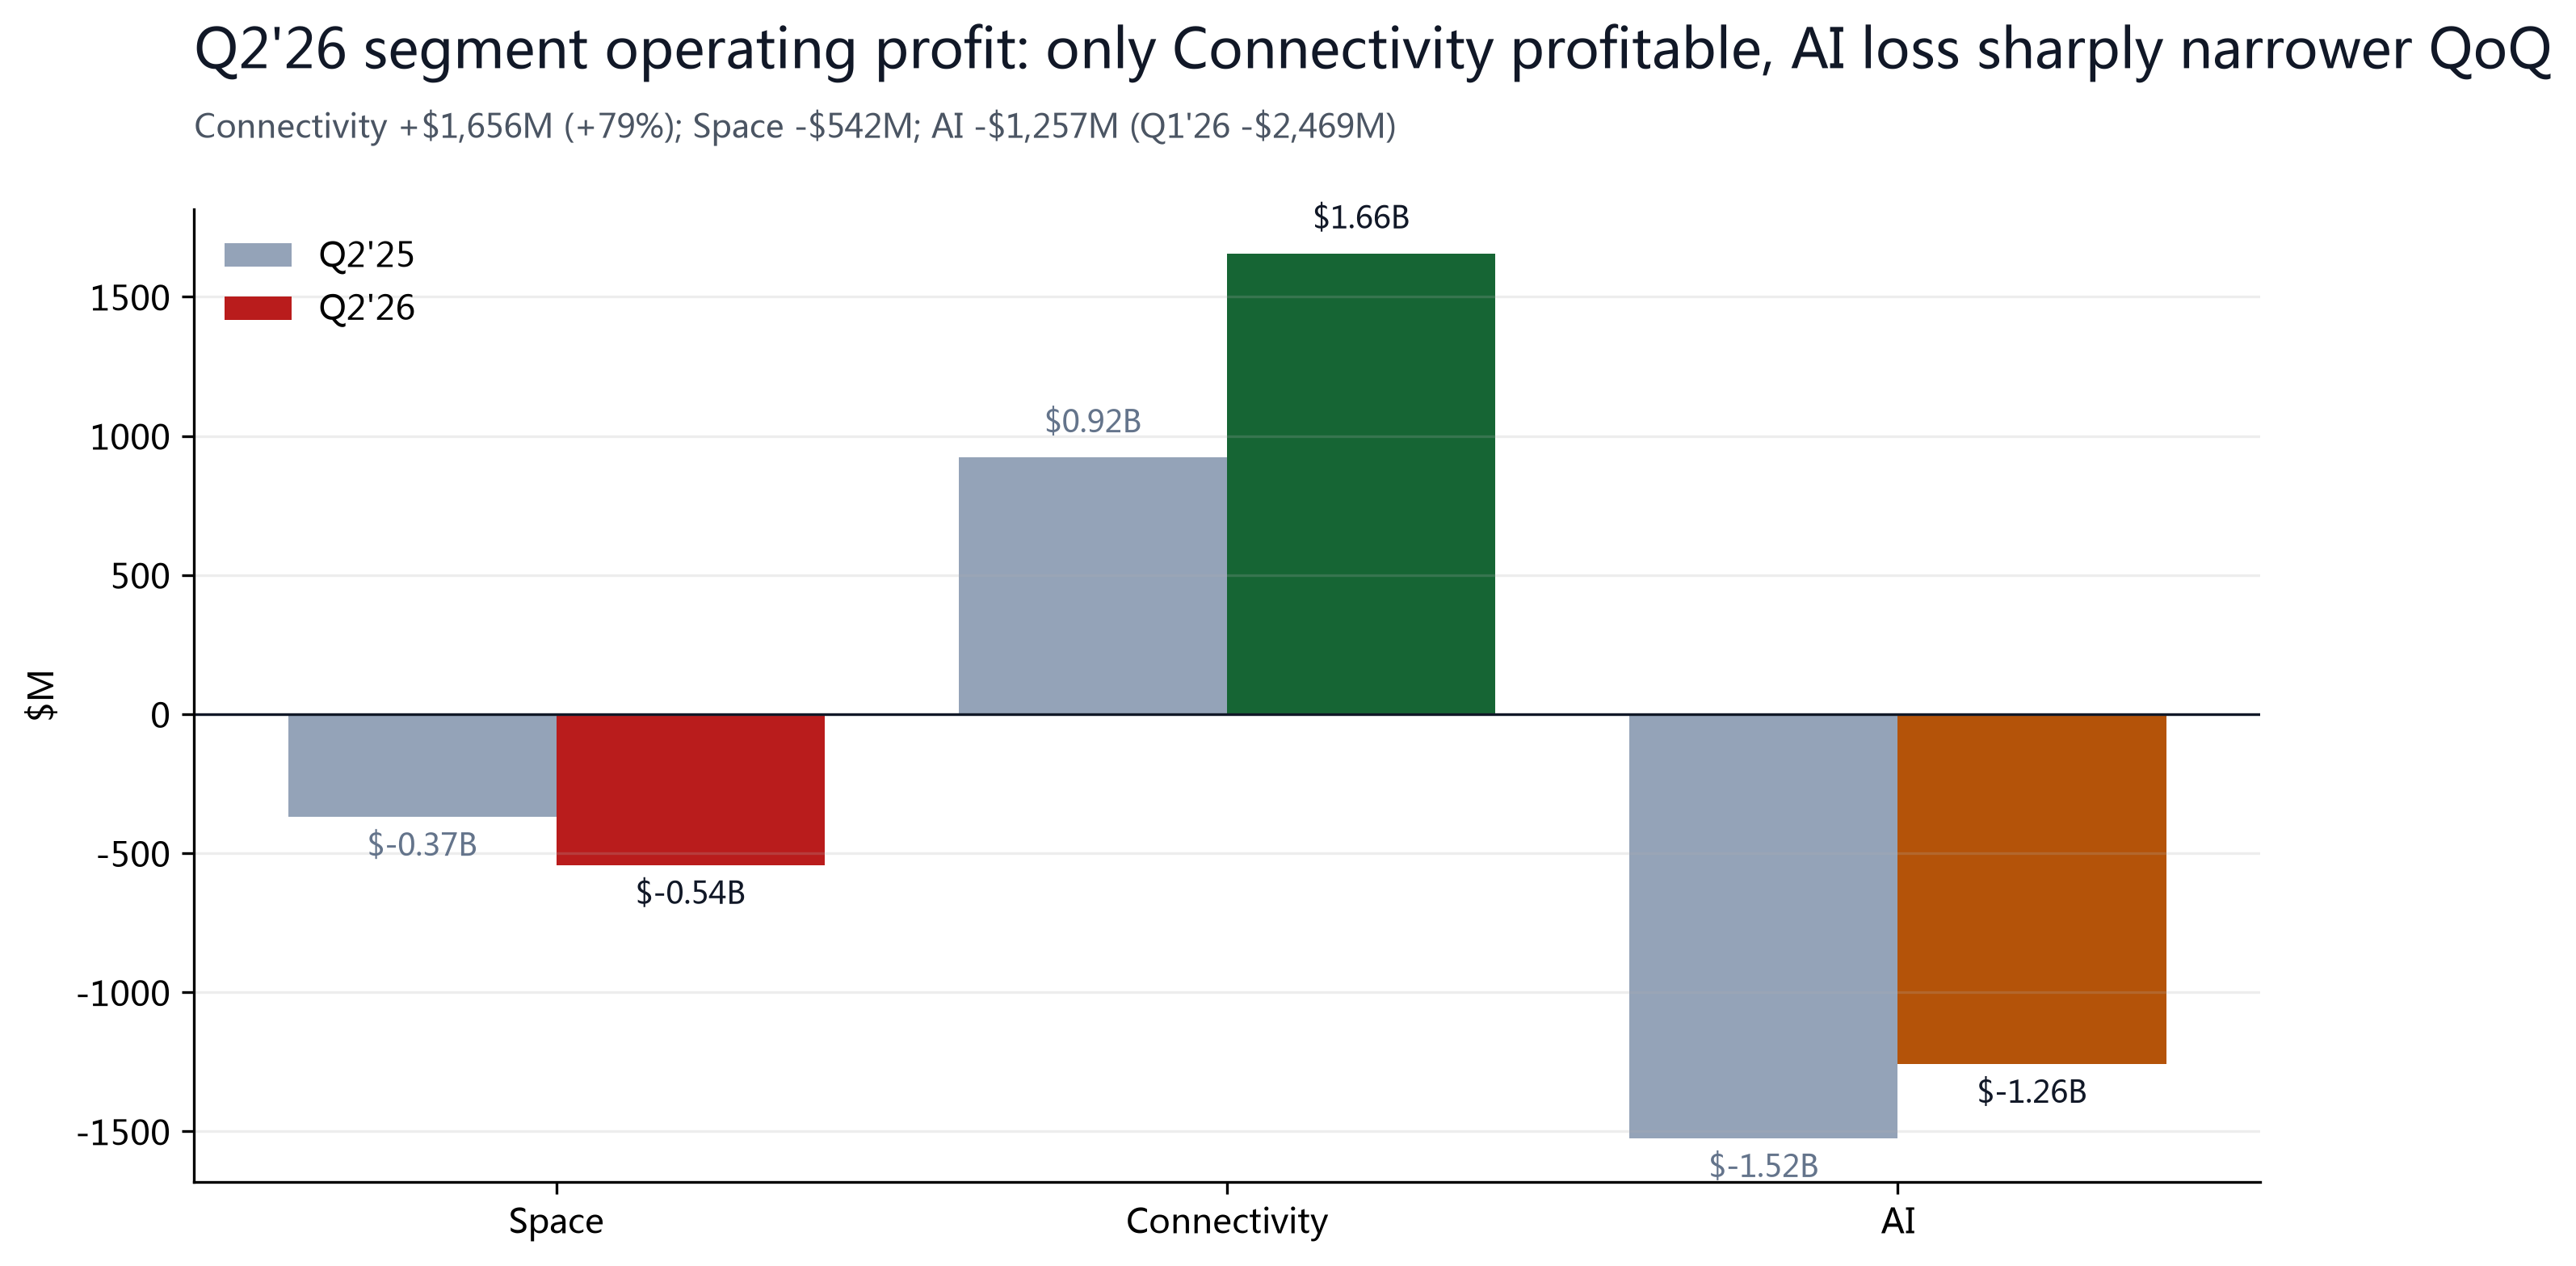
Three reasons to be Overweight: (1) Q2'26 beat across the board (revenue +92%, adjusted EBITDA +192%, net loss -46%), with the AI segment's operating loss halving QoQ and adjusted EBITDA turning positive at +$1,146M — a genuine double inflection in revenue and losses; (2) Starlink is the only profitable segment (Q2'26 operating profit $1,656M, +79%), at 12.0M subscribers with enterprise/government revenue +108%, providing downside support; (3) crowded shorts (S3 puts them at ~32% of the float) plus explosive revenue growth means any beat can trigger a squeeze.
Three key risks: (1) the lockup wave starting Aug 6 — by Dec 8 the float grows from ~4% to ~40%, real supply pressure; (2) deeply negative free cash flow (H1'26 CFO $3,466M - capex $28,476M ≈ -$25,010M, calculated), with AI spending funded by IPO proceeds and debt (cash on hand $100B); (3) Starlink ARPU -22% YoY and Space segment H1 revenue -2% — deceleration in both mature businesses. This is also why we set our target well below the $223 street consensus.
§02Price and Street View
On earnings day Aug 4, SPCX surged 9.43% to close at $125.33, its best single-day gain in a month — the market first cheered the revenue beat and narrower losses; but after hours, AI capex of $15.8B (Street expected $13.2B total) drove the stock down nearly 9% to $115.98. The 'up first, then sold off' pattern of the session captures all of the market's ambivalence about this company: the growth is real, and so is the cash burn.
| Metric | Value | Source / Note |
|---|---|---|
| Current price | $125.33 | 2026-08-04 收盘 (+9.43%);盘后 $115.98 (-7.46%) |
| Market cap | $1.65T | 125.33 x 13.18B shares (10-Q) |
| vs IPO price | -7.2% | IPO $135 (2026-06-12);市值高点 $1.77T |
| vs 52W high | -44.5% | 52W 高 $225.64 (2026-06-16 盘中) |
| 52W range | $104.83-$225.64 | 低点 2026-08-03 盘中 |
| Volume (8/4) | 144.1M | 日均约 103M;换手率偏高 |
| Float | 5.56 亿股 | 占总股本约 4.2%(解禁前) |
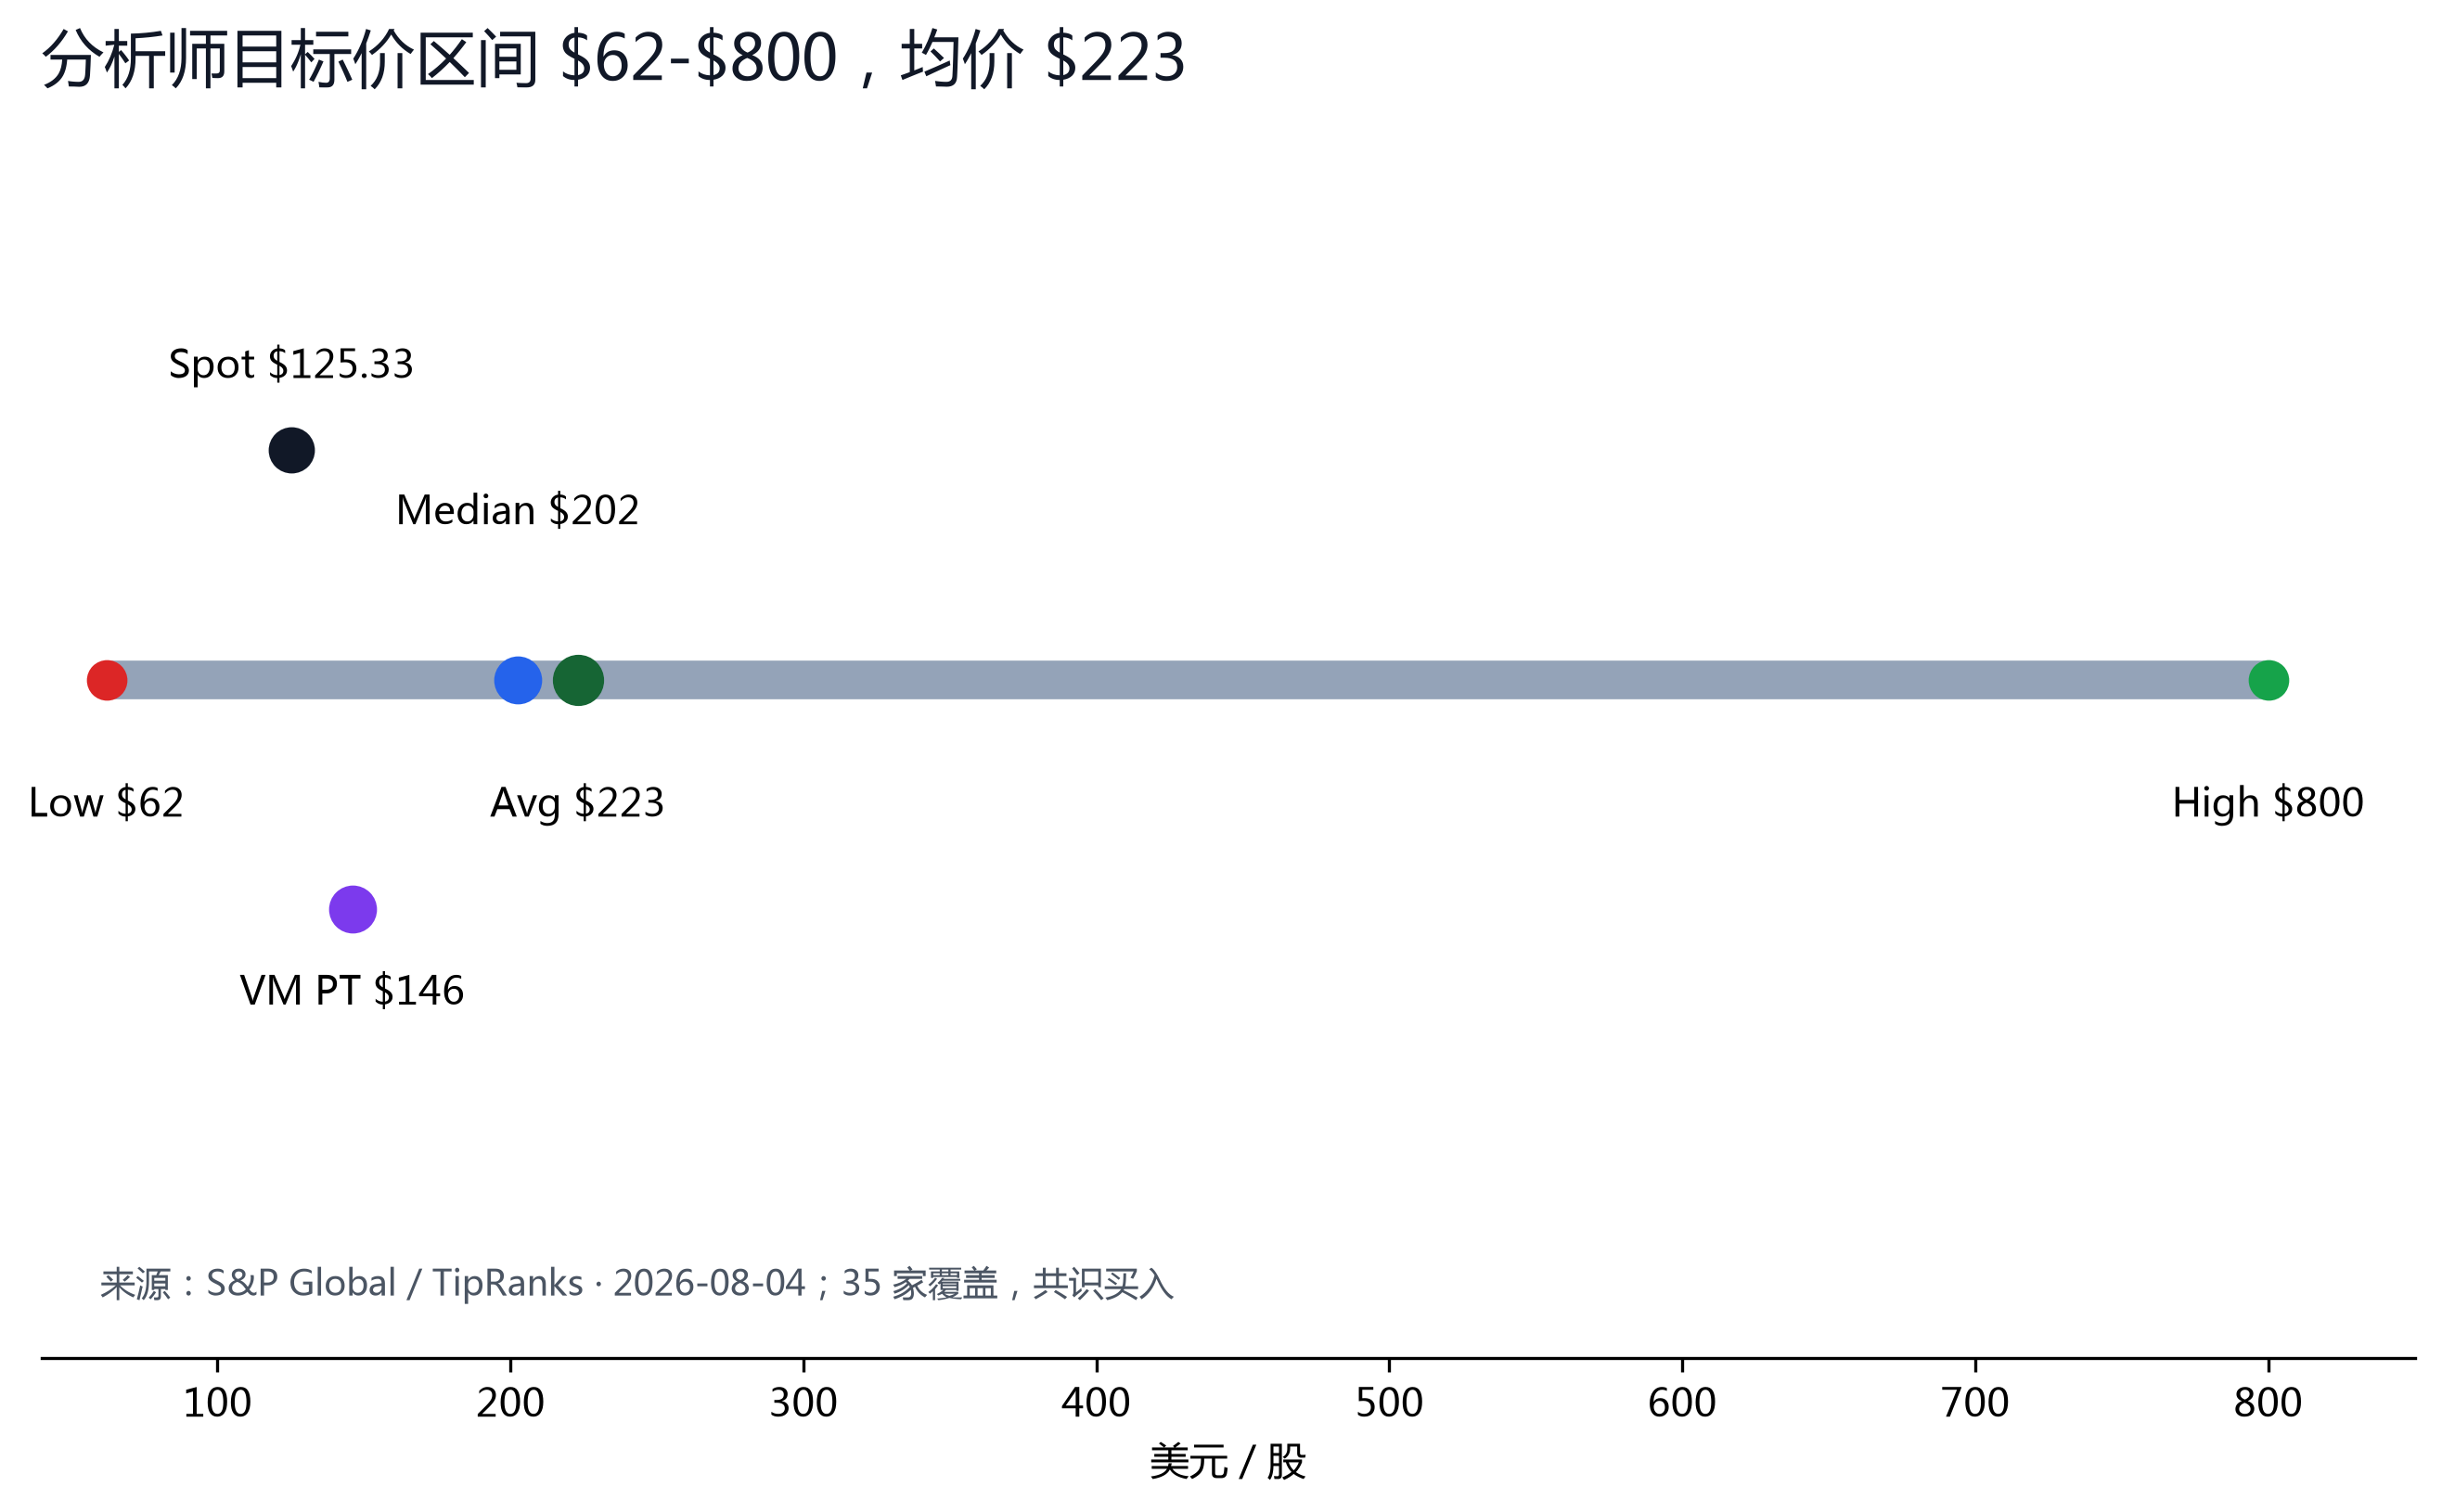
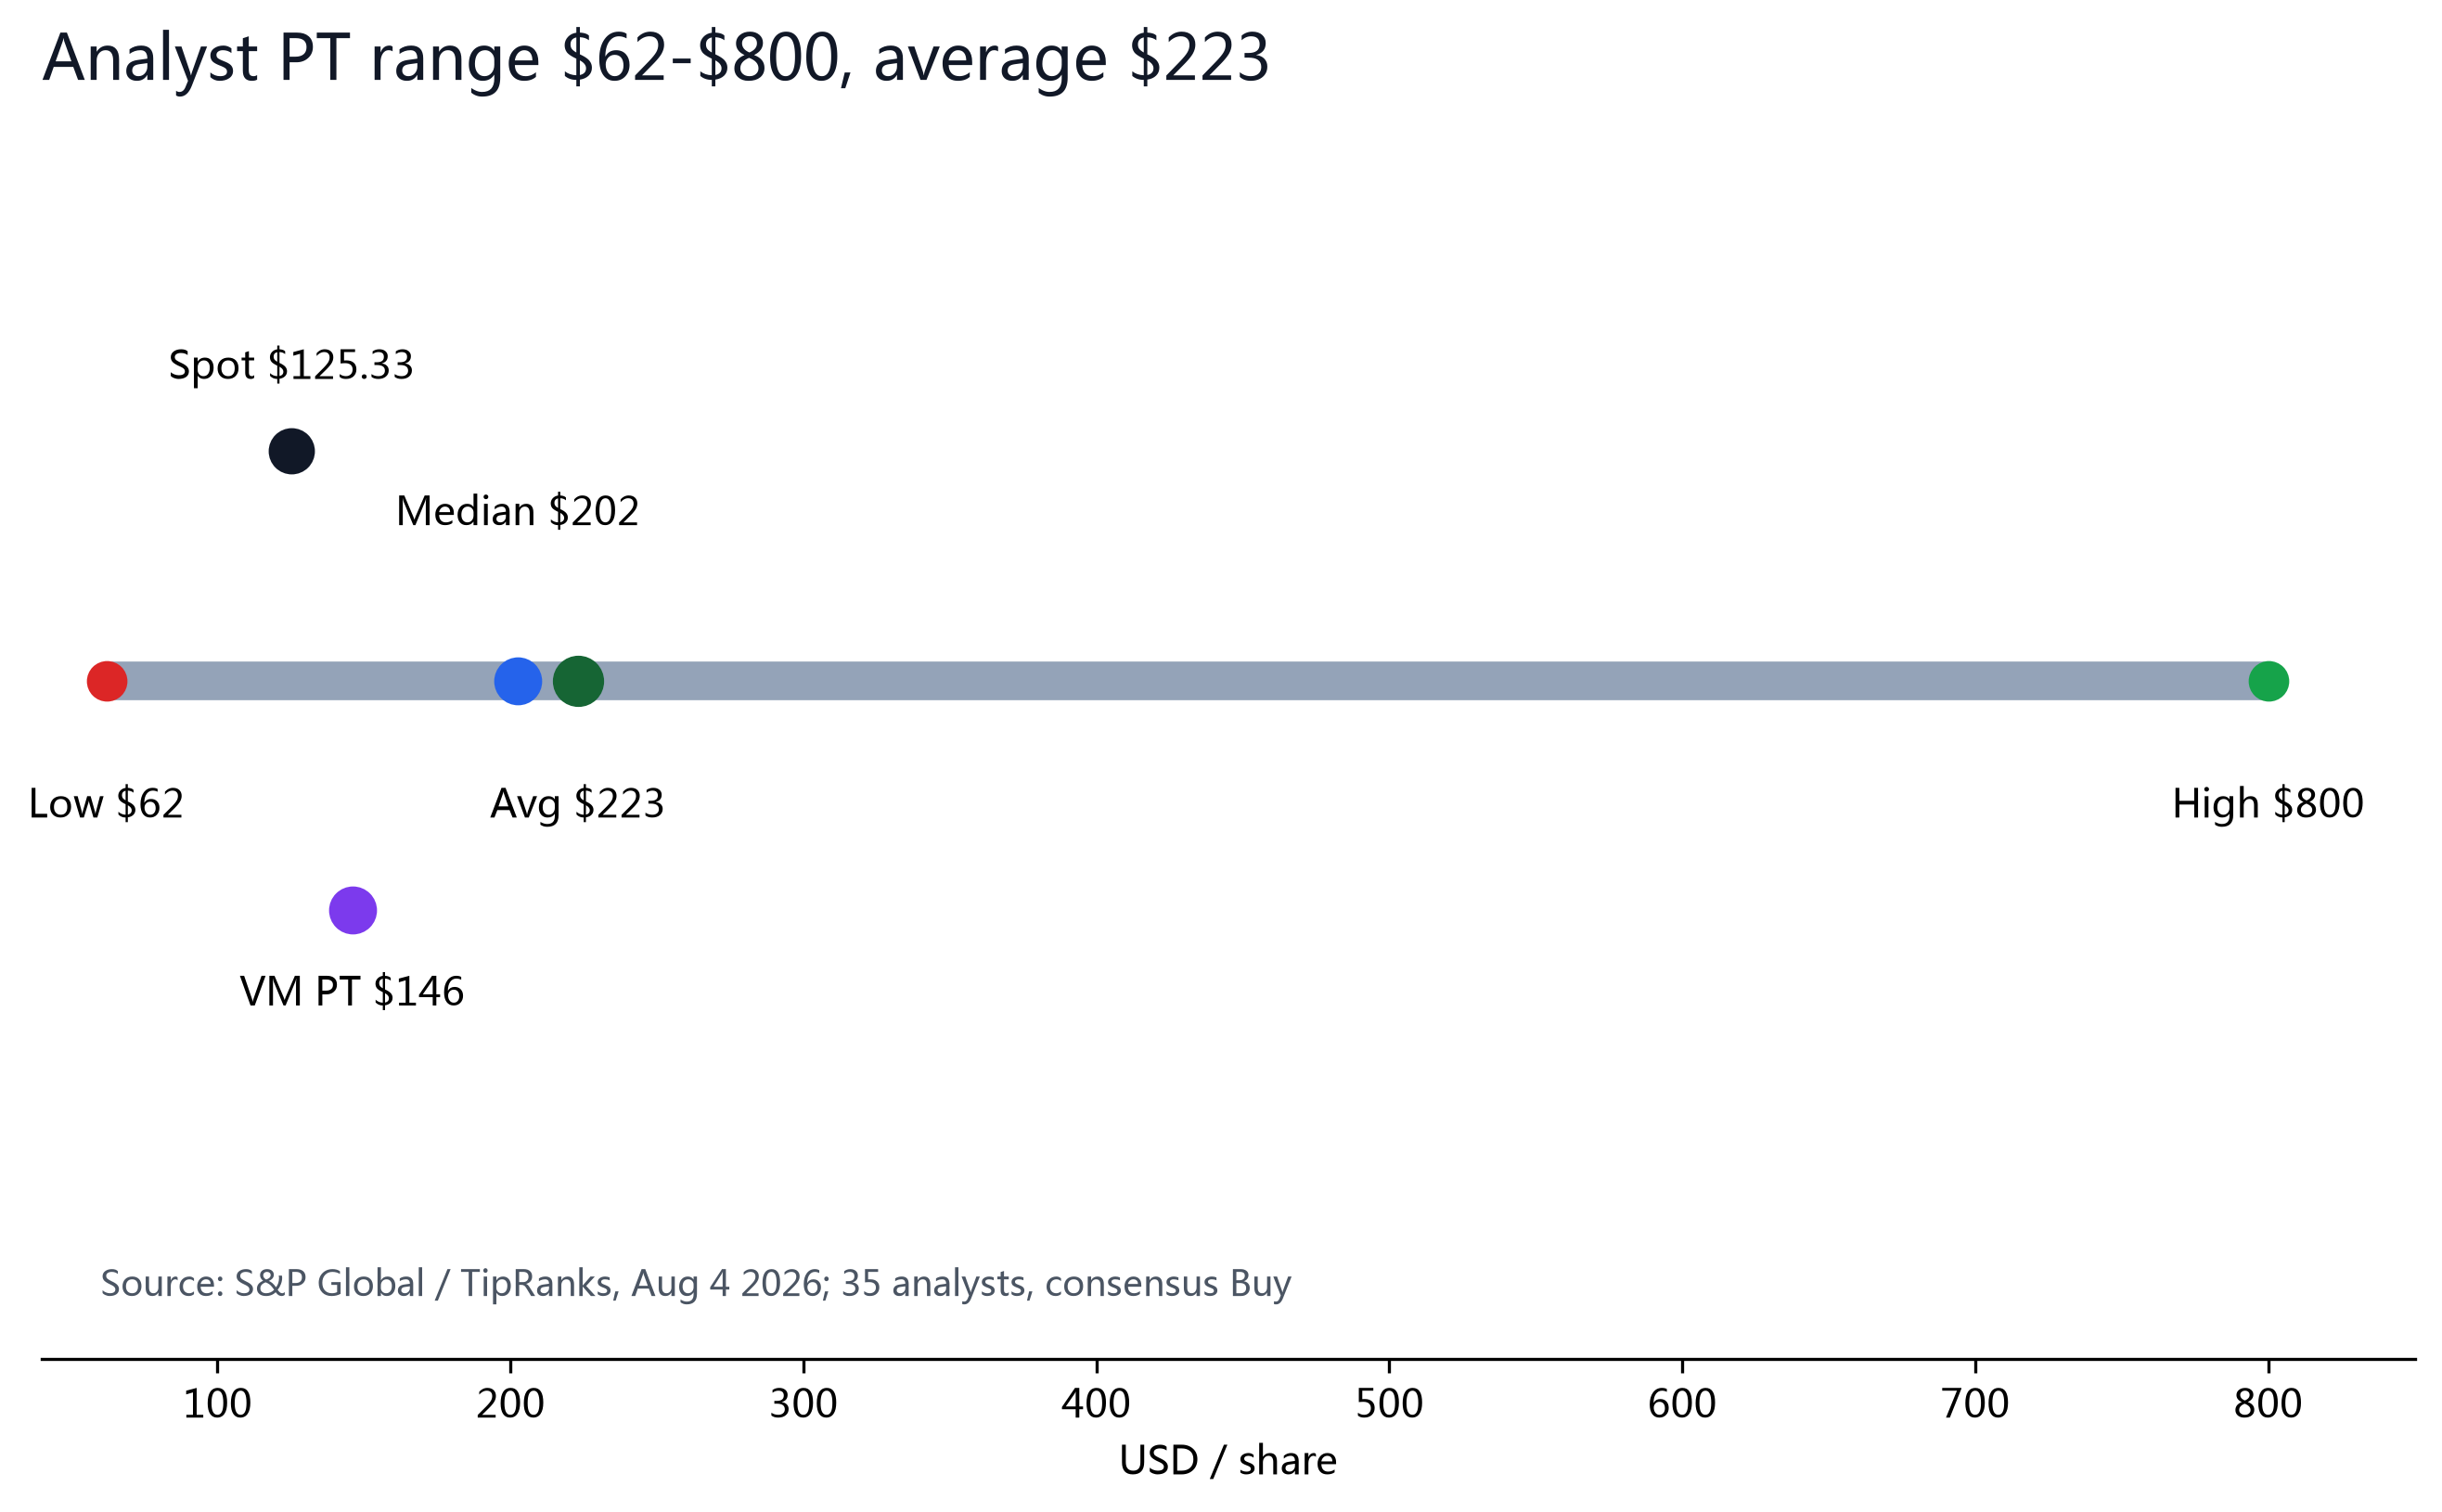
| Analyst PT | $62 / $223 / $800 | Low / Avg / High · S&P Global / TipRanks |
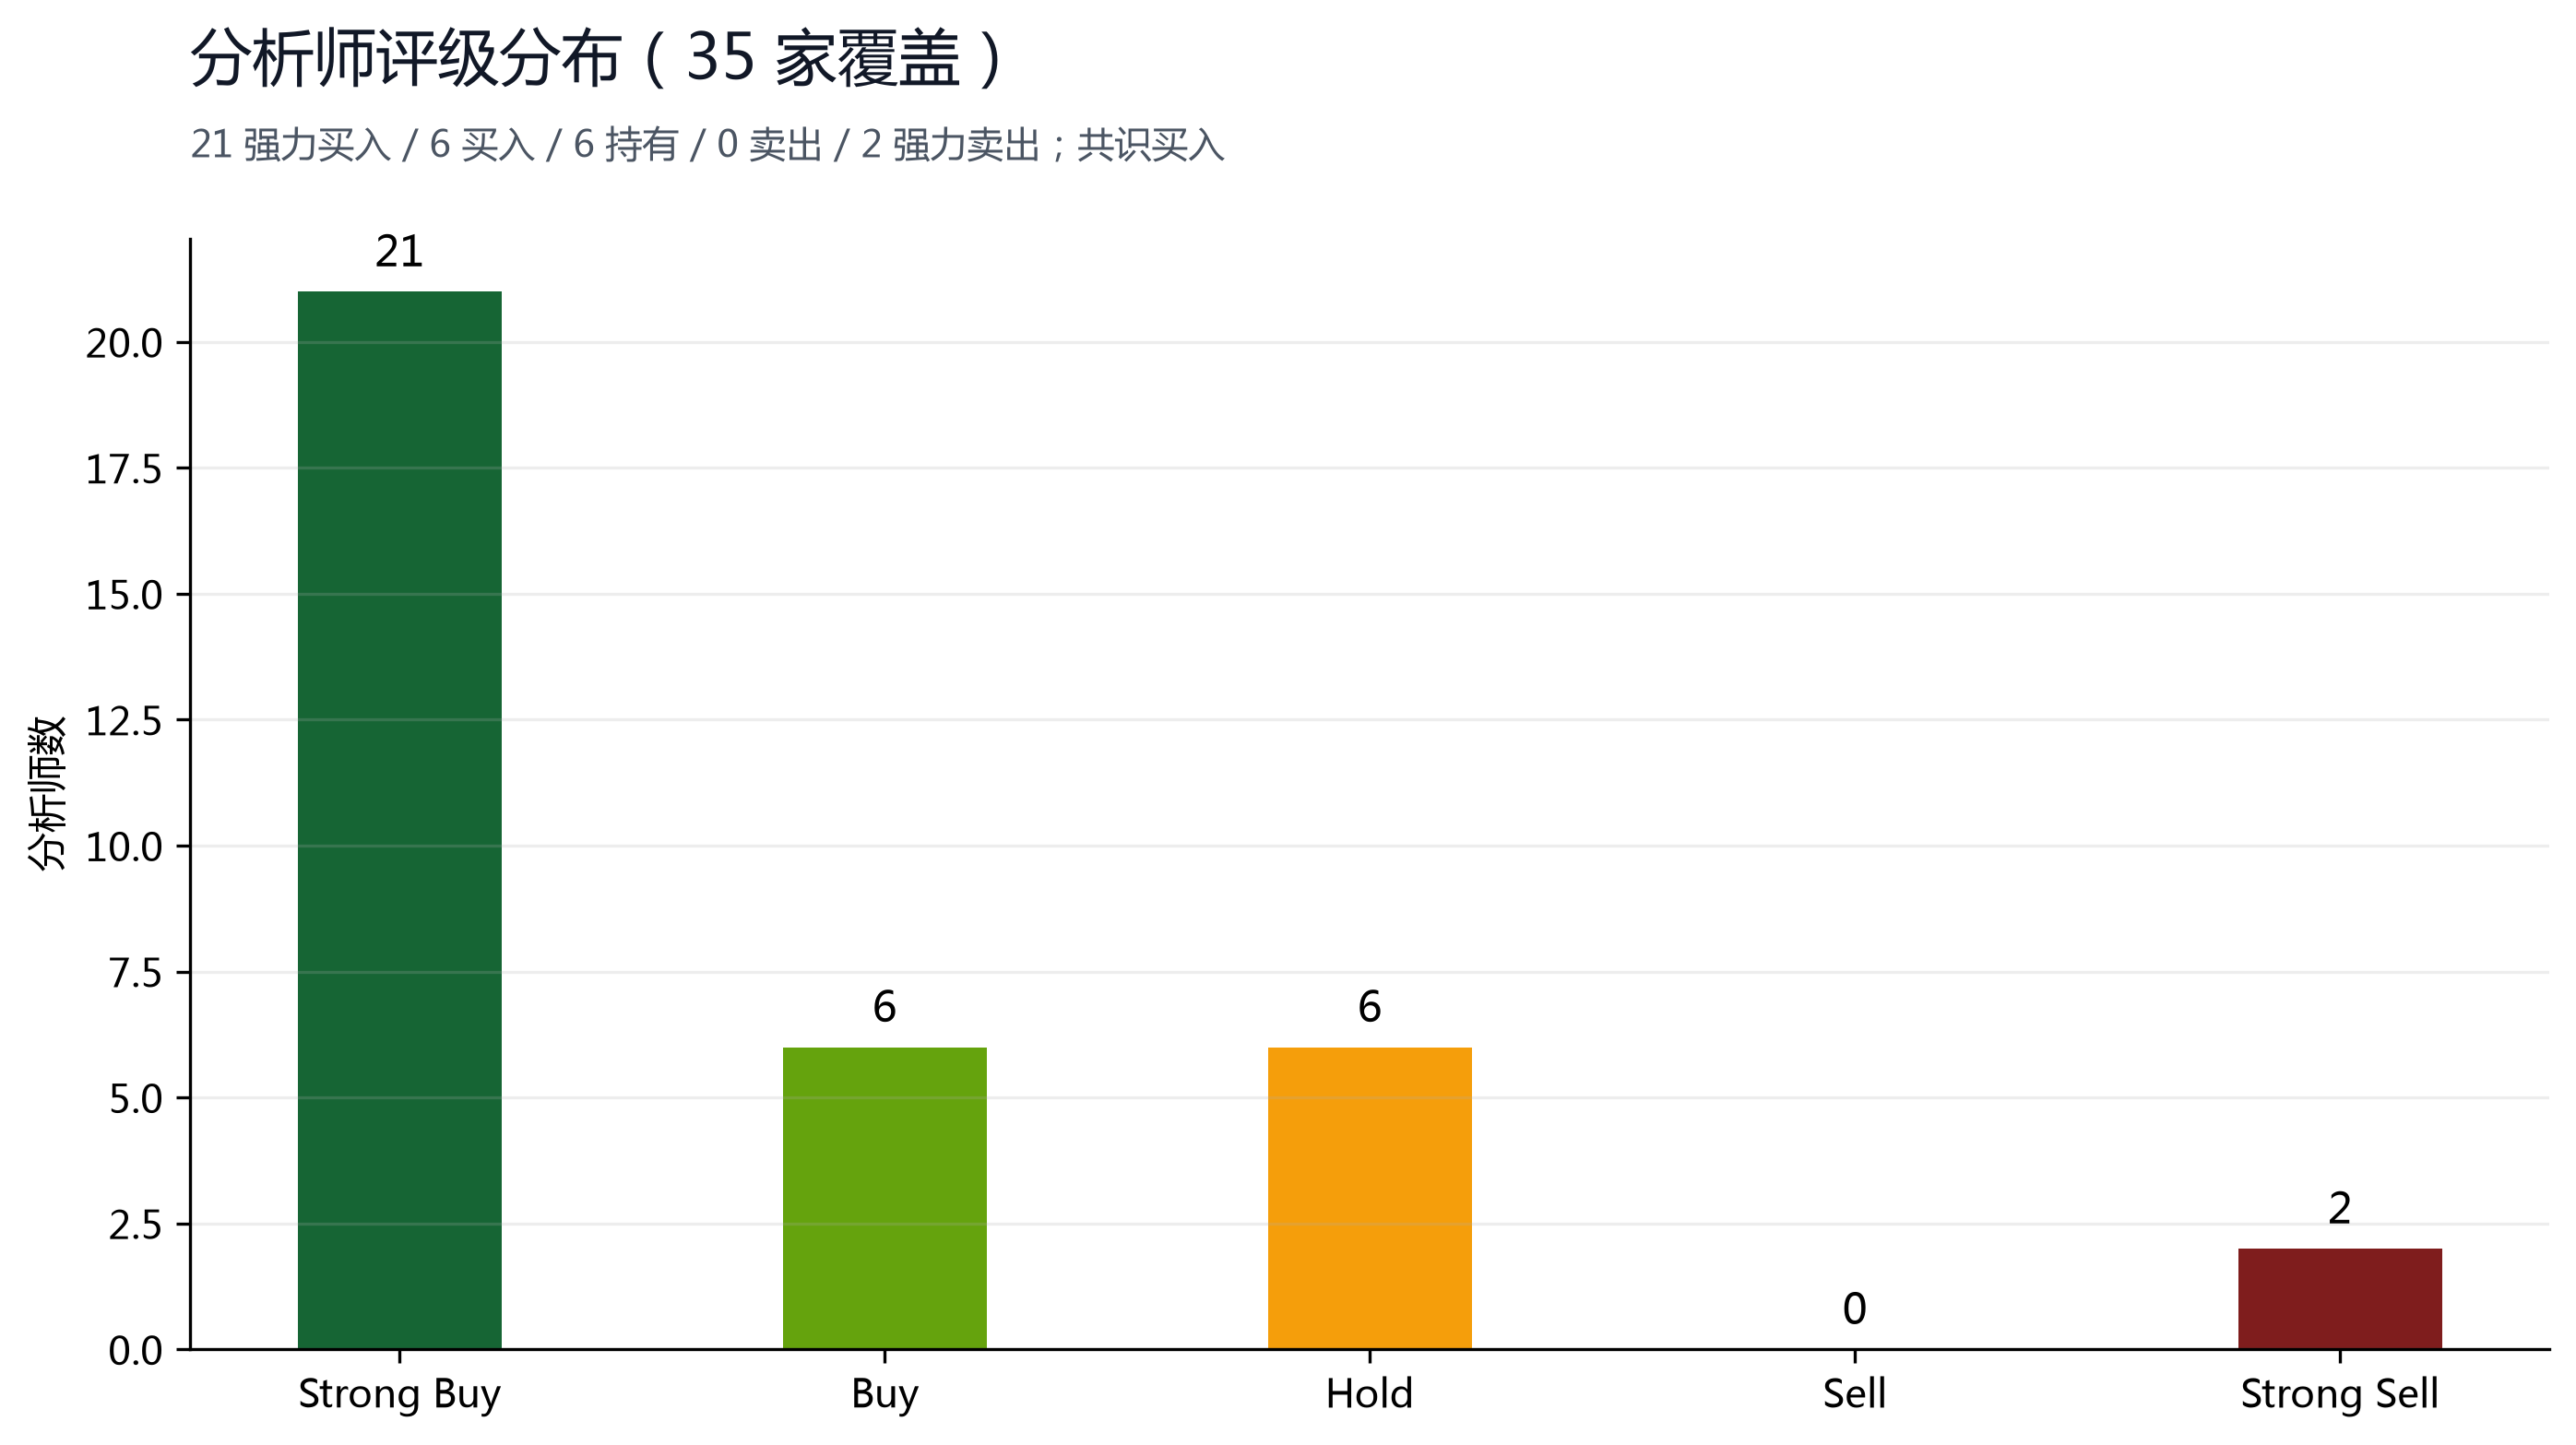
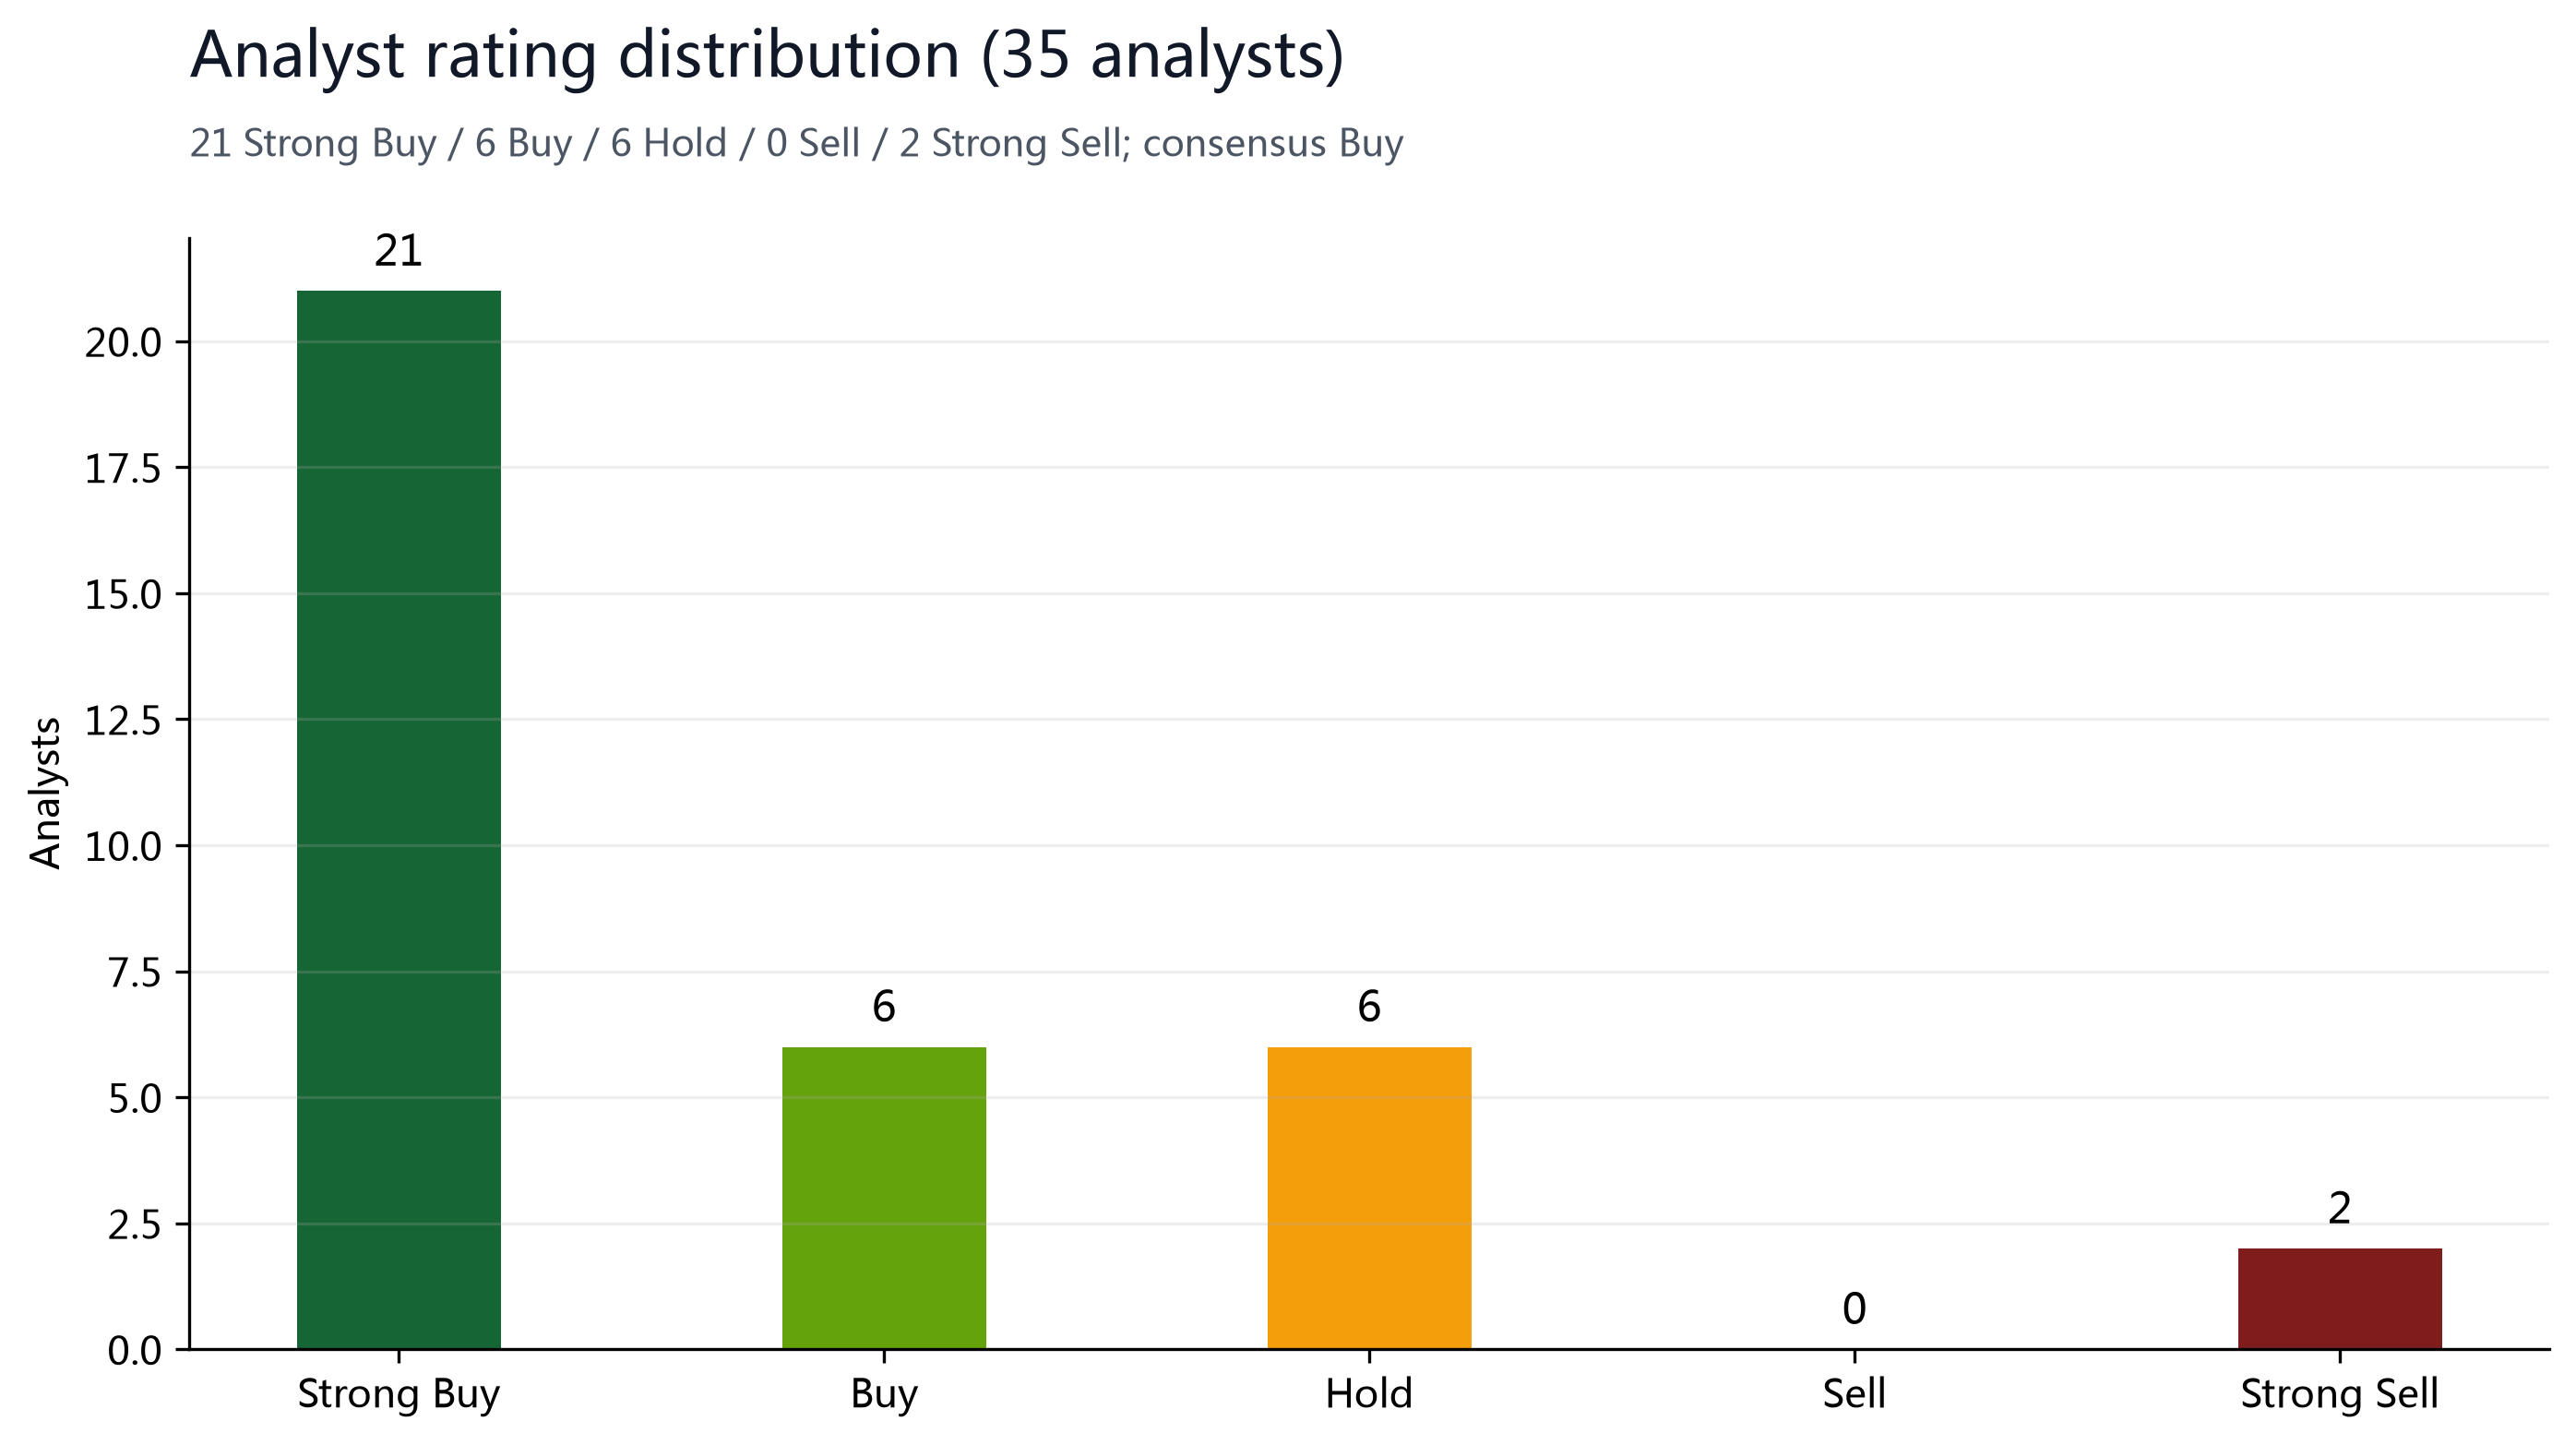
| Recommendation split | 21 / 6 / 6 / 0 / 2 | SB / B / H / S / SS · 35 analysts |
| TTM 指标 | Rev $19.3B / NI -$9.4B / EPS -$2.94 | stockanalysis.com |
§03Bull/Bear View
Bull: revenue doubling, a loss-narrowing inflection, a profitable Connectivity segment, and crowded shorts
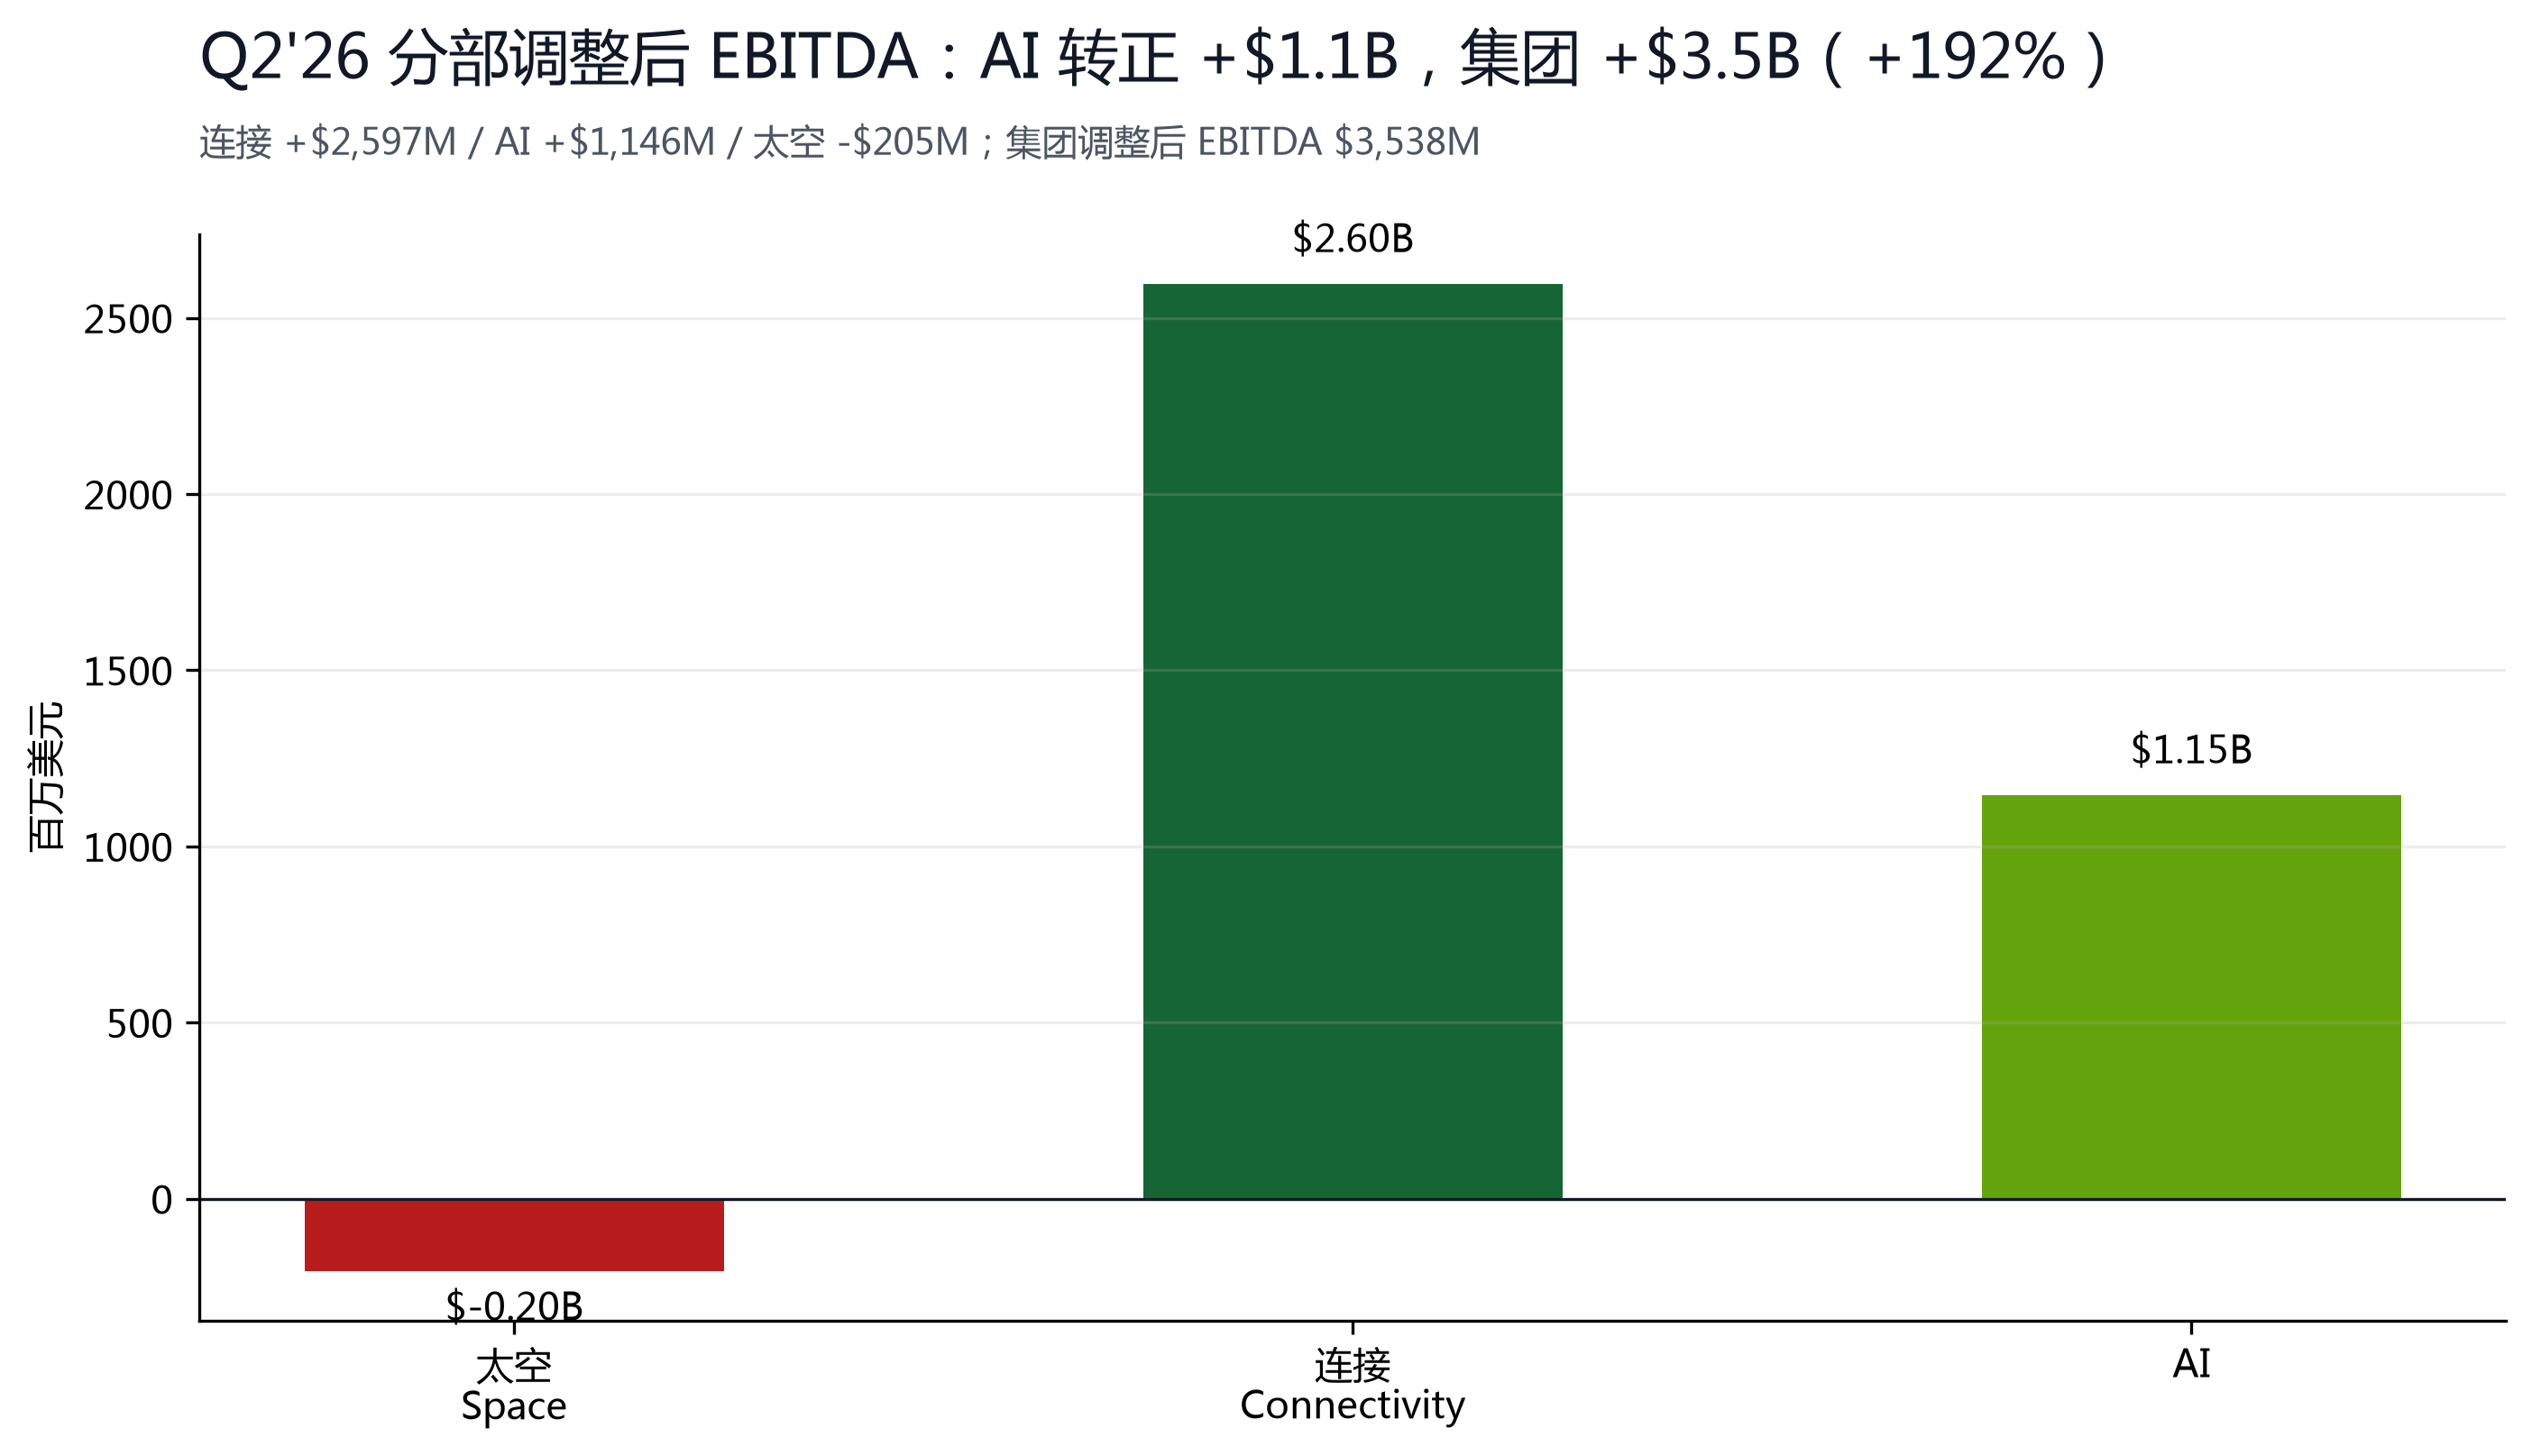
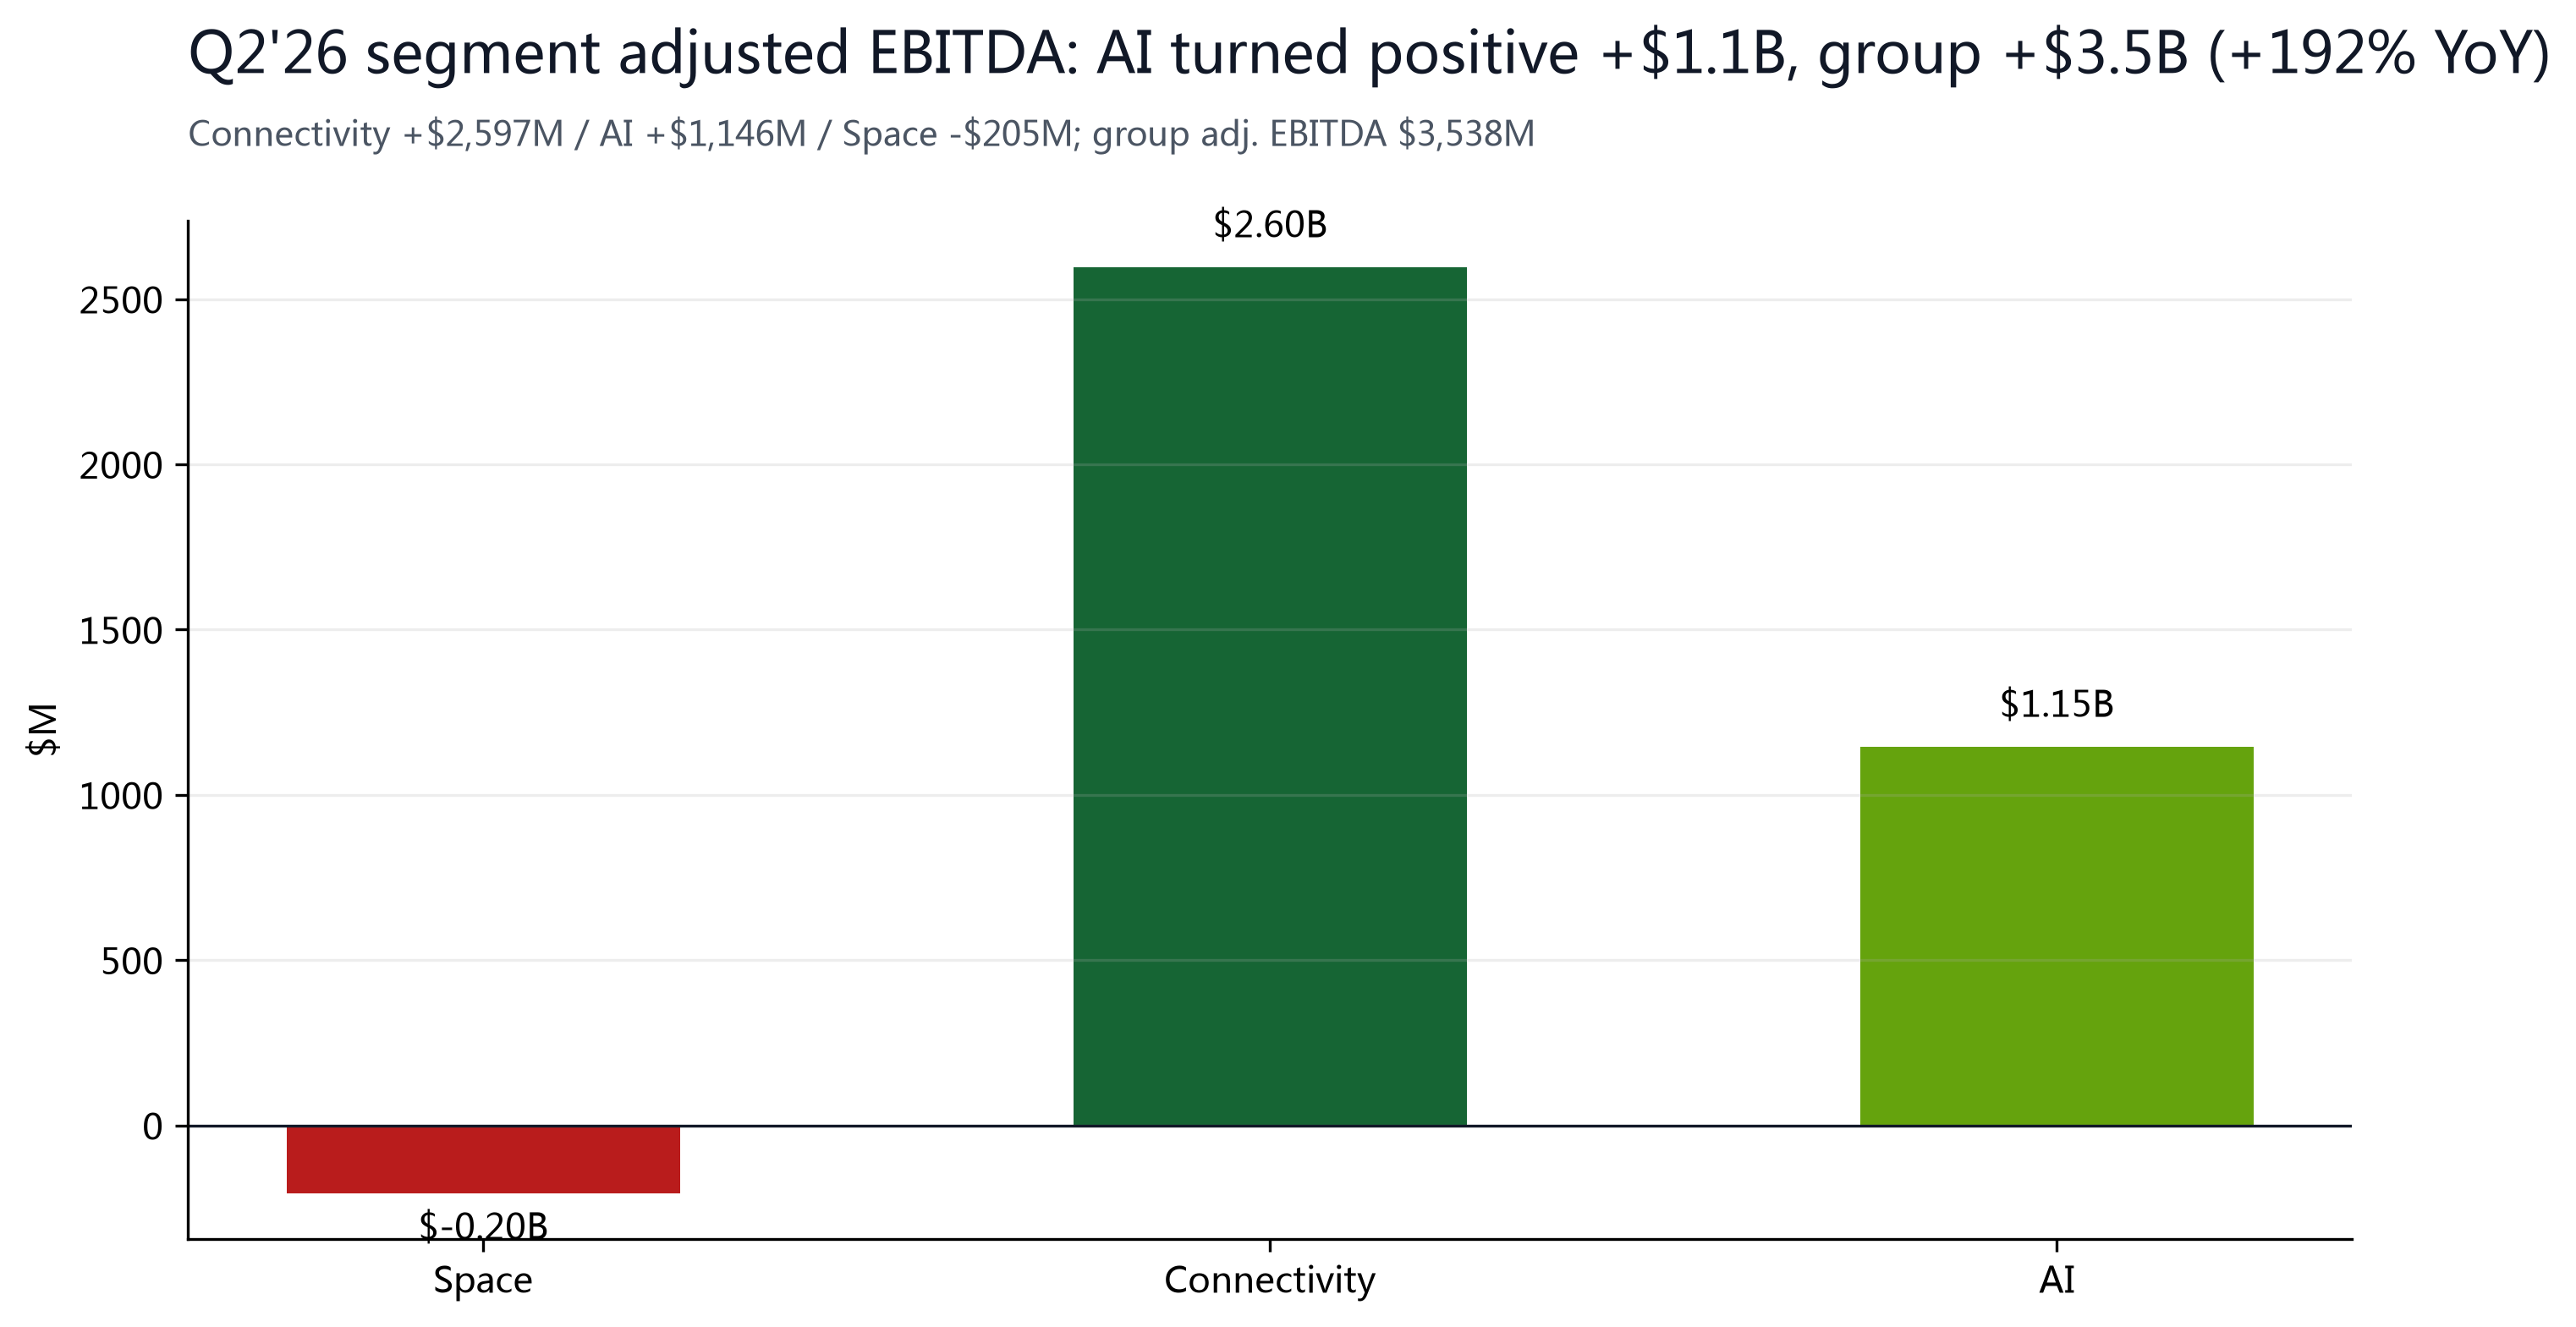
Q2'26 revenue of $7,814M (+92% YoY), adjusted EBITDA of $3,538M (+192%), and a net loss 46% narrower — all three beat. Structurally, Connectivity (Starlink) posted operating profit of $1,656M (+79%) with enterprise/government revenue of $1,806M (+108%) — a genuine cash cow — and secured over $6B of multi-year Starshield U.S. government contracts (U.S. Space Force LEO communications and Earth observation) plus FCC approval of EchoStar's 65MHz spectrum transfer (owned direct-to-cell spectrum). The AI segment grew revenue 247% to $2,561M, halved its operating loss QoQ, and turned adjusted EBITDA positive at +$1,146M (after $1.89B of D&A), with 1.4GW of compute, a $47.5B backlog, $14.1B of Q2 cloud-service contract sales (including ~$920M/month from Google through mid-2029) and ~$6.7B of new cloud signings in the first weeks of Q3; management guided to >2GW compute by year-end, roughly $100B of December-annualized revenue (including Cursor) by year-end, a $1T revenue goal by 2030, and an exclusive NVIDIA partnership to build Starmind orbital AI-compute satellites (Vera Rubin silicon). Positioning-wise, shorts hold ~32% of the float (S3), and the lockup and earnings negatives are already heavily priced in — any sustained beat can trigger a squeeze, making the crowded short a call option on the upside.
Bear: the lockup wave, unbounded cash burn, decelerating mature businesses, and a still-rich multiple
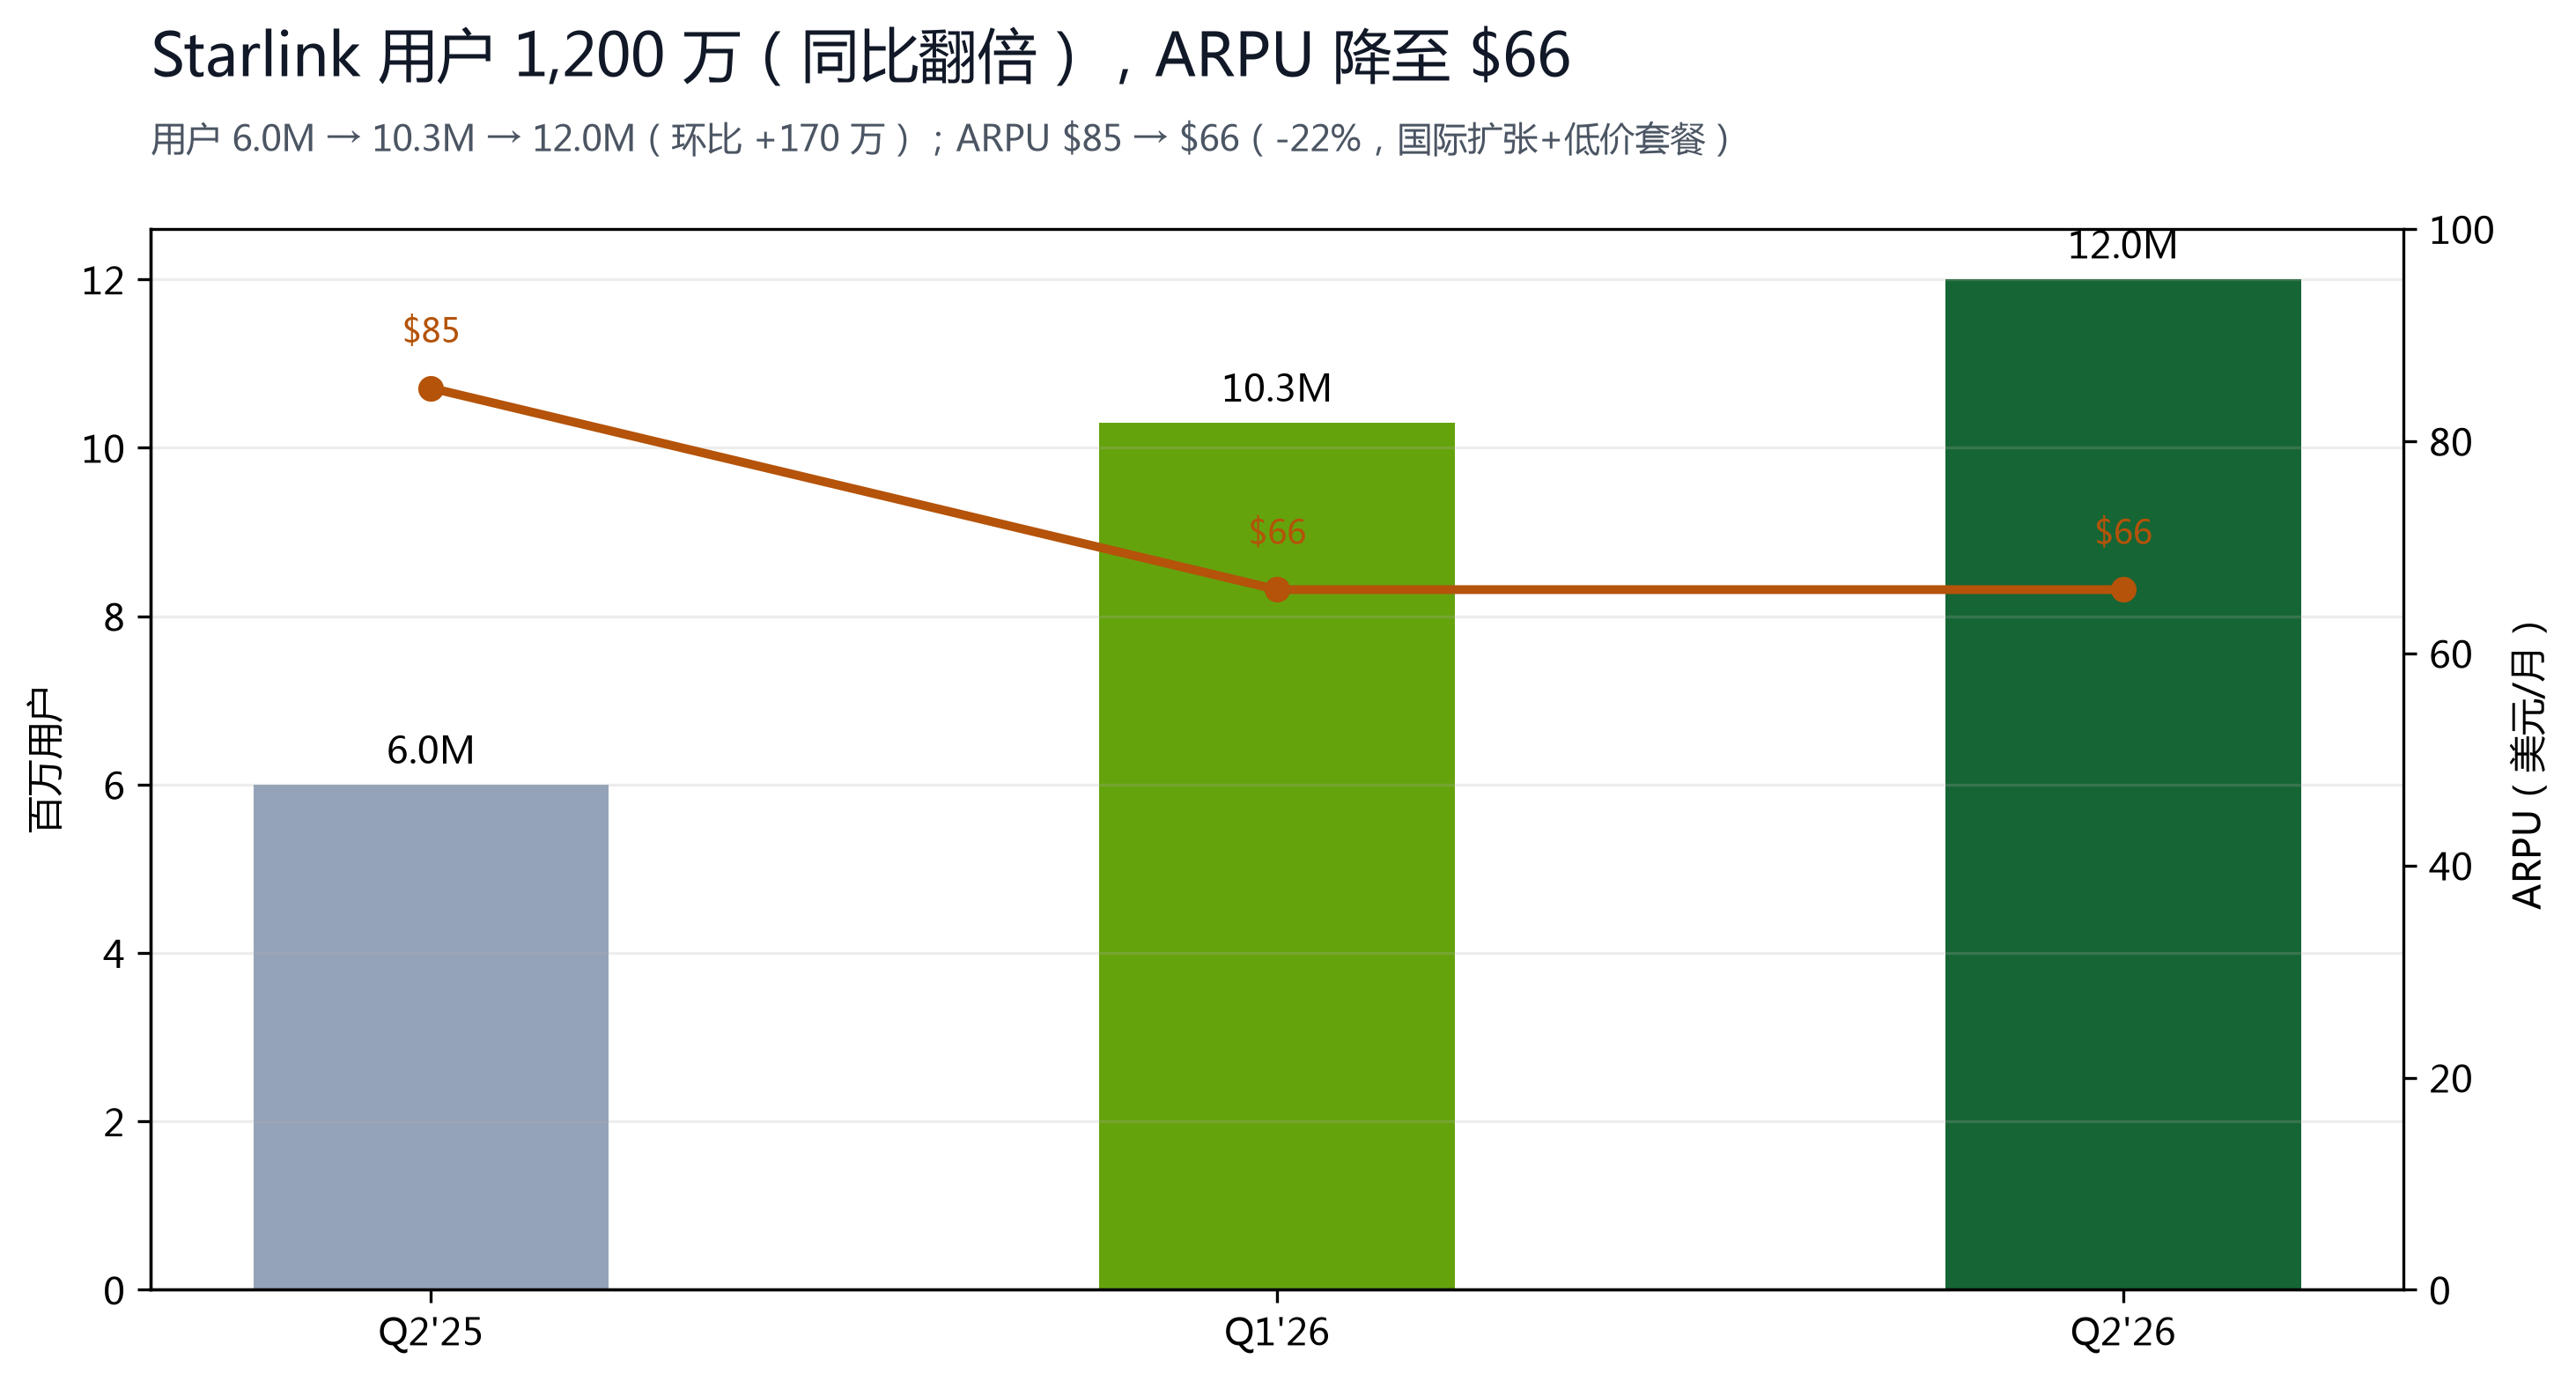
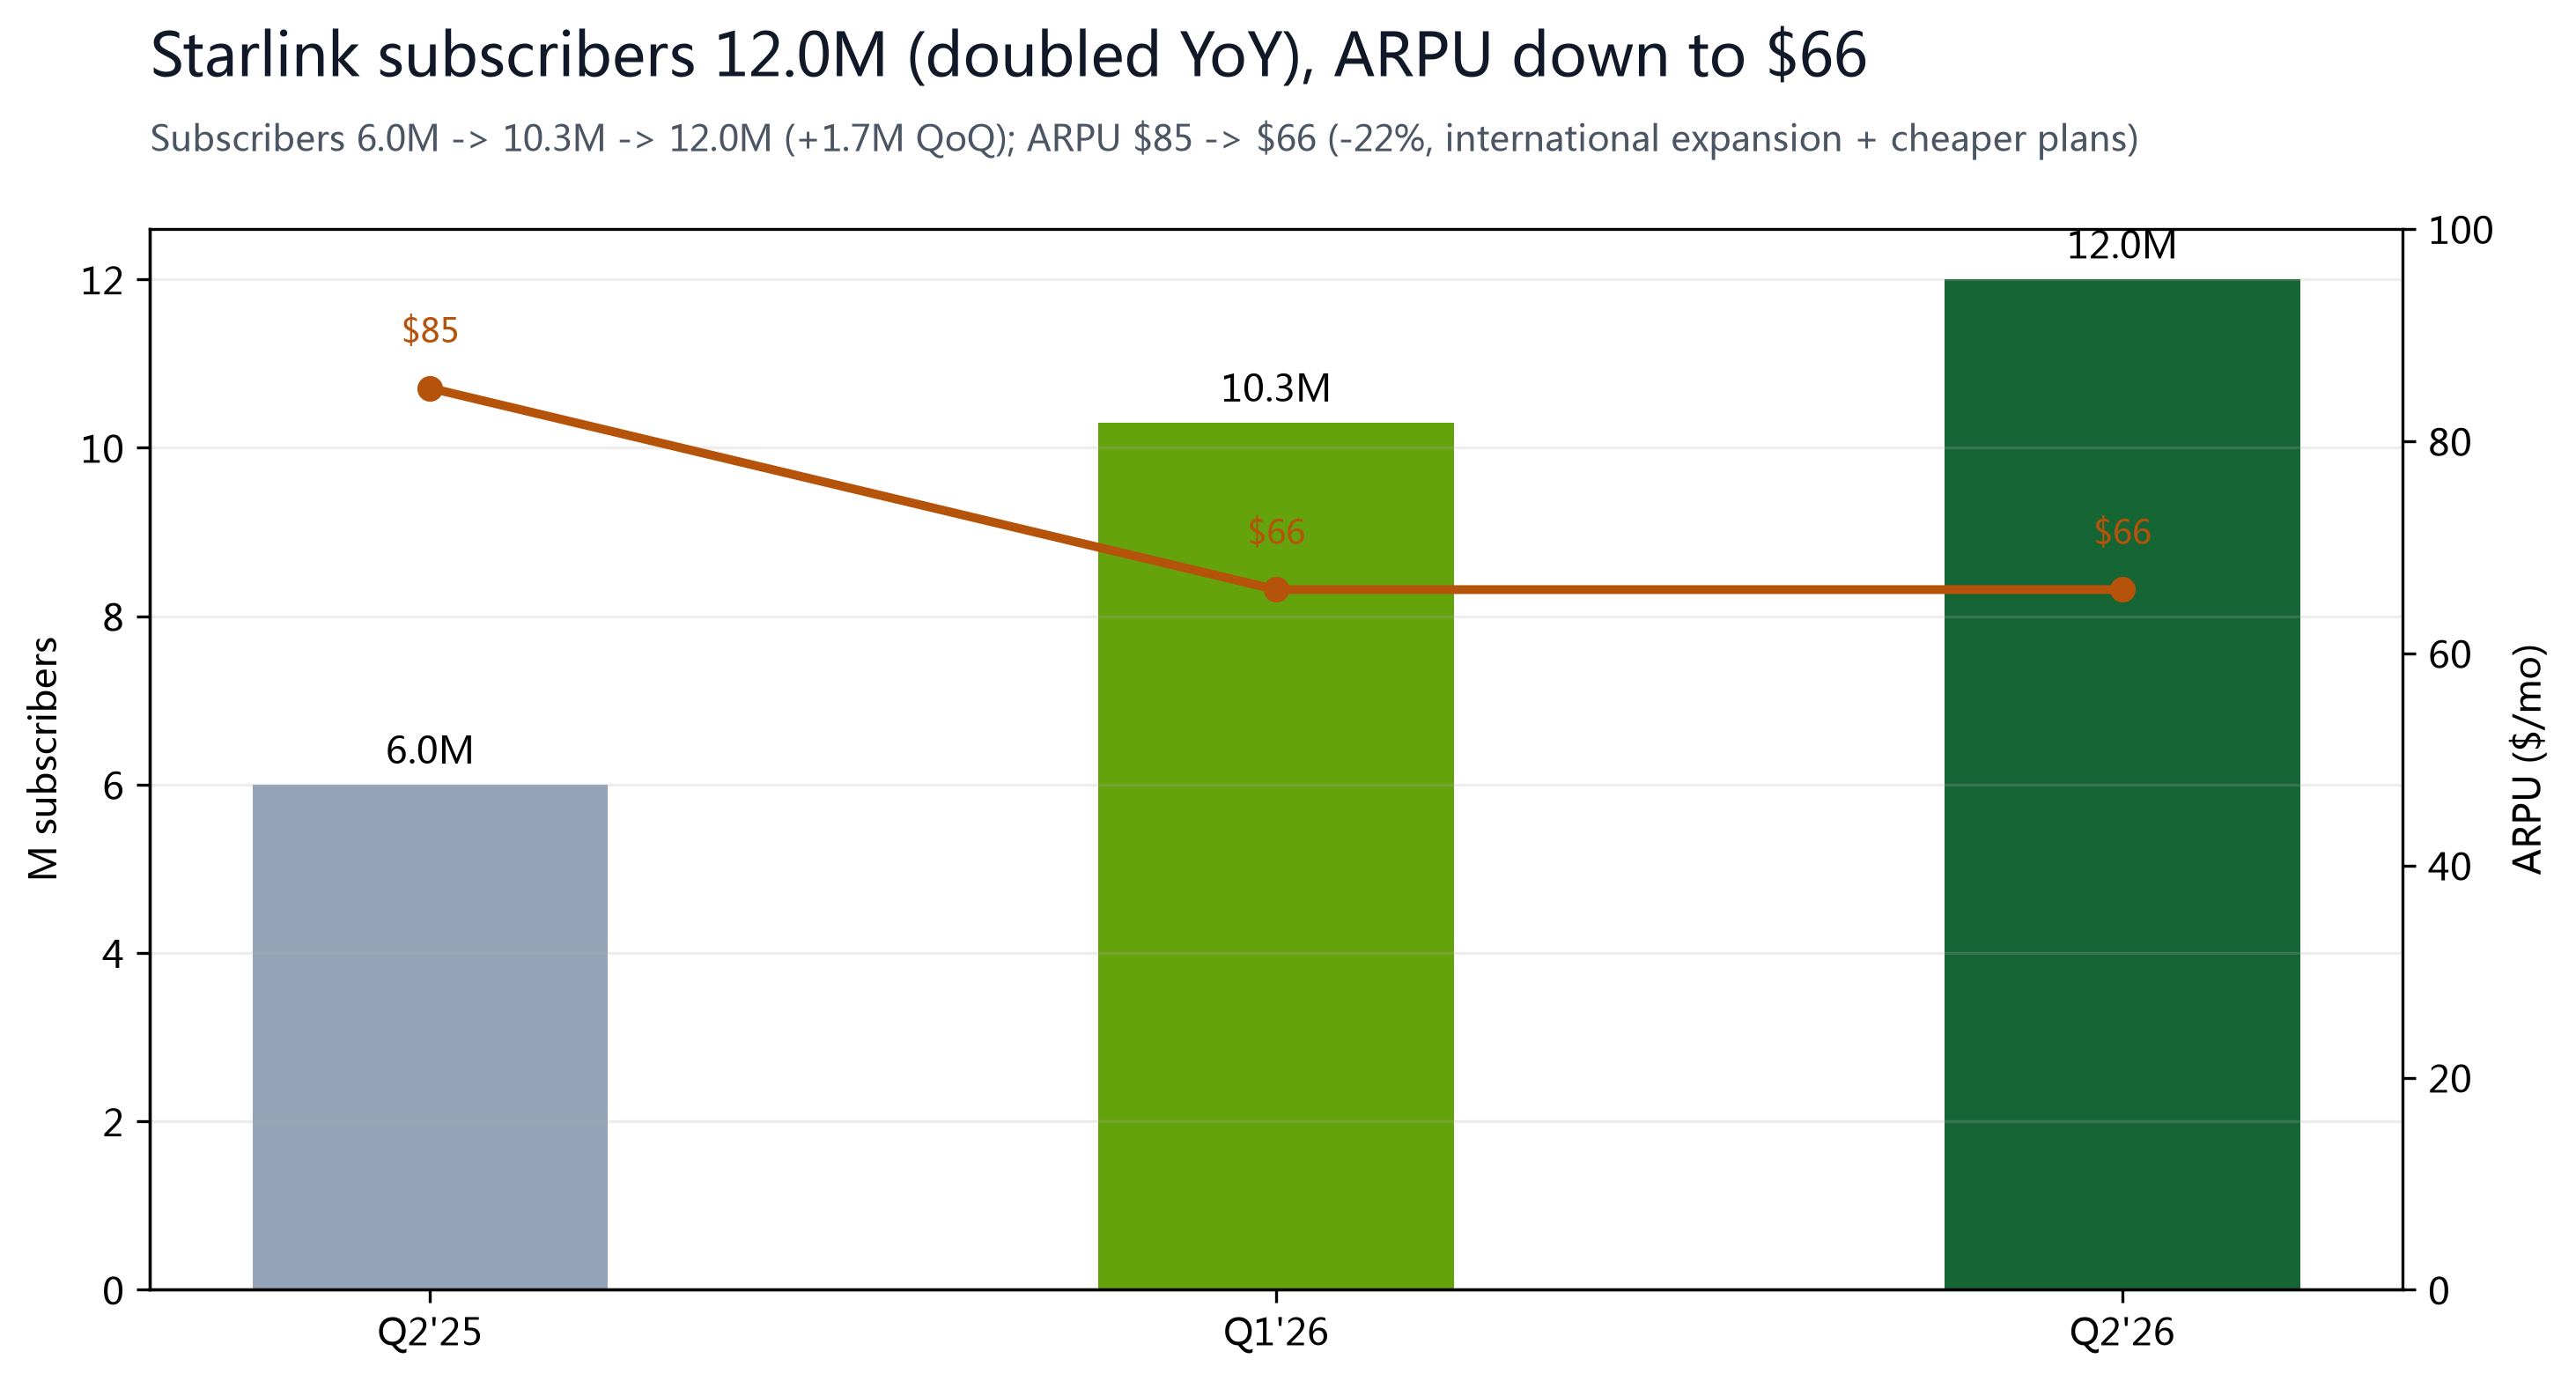
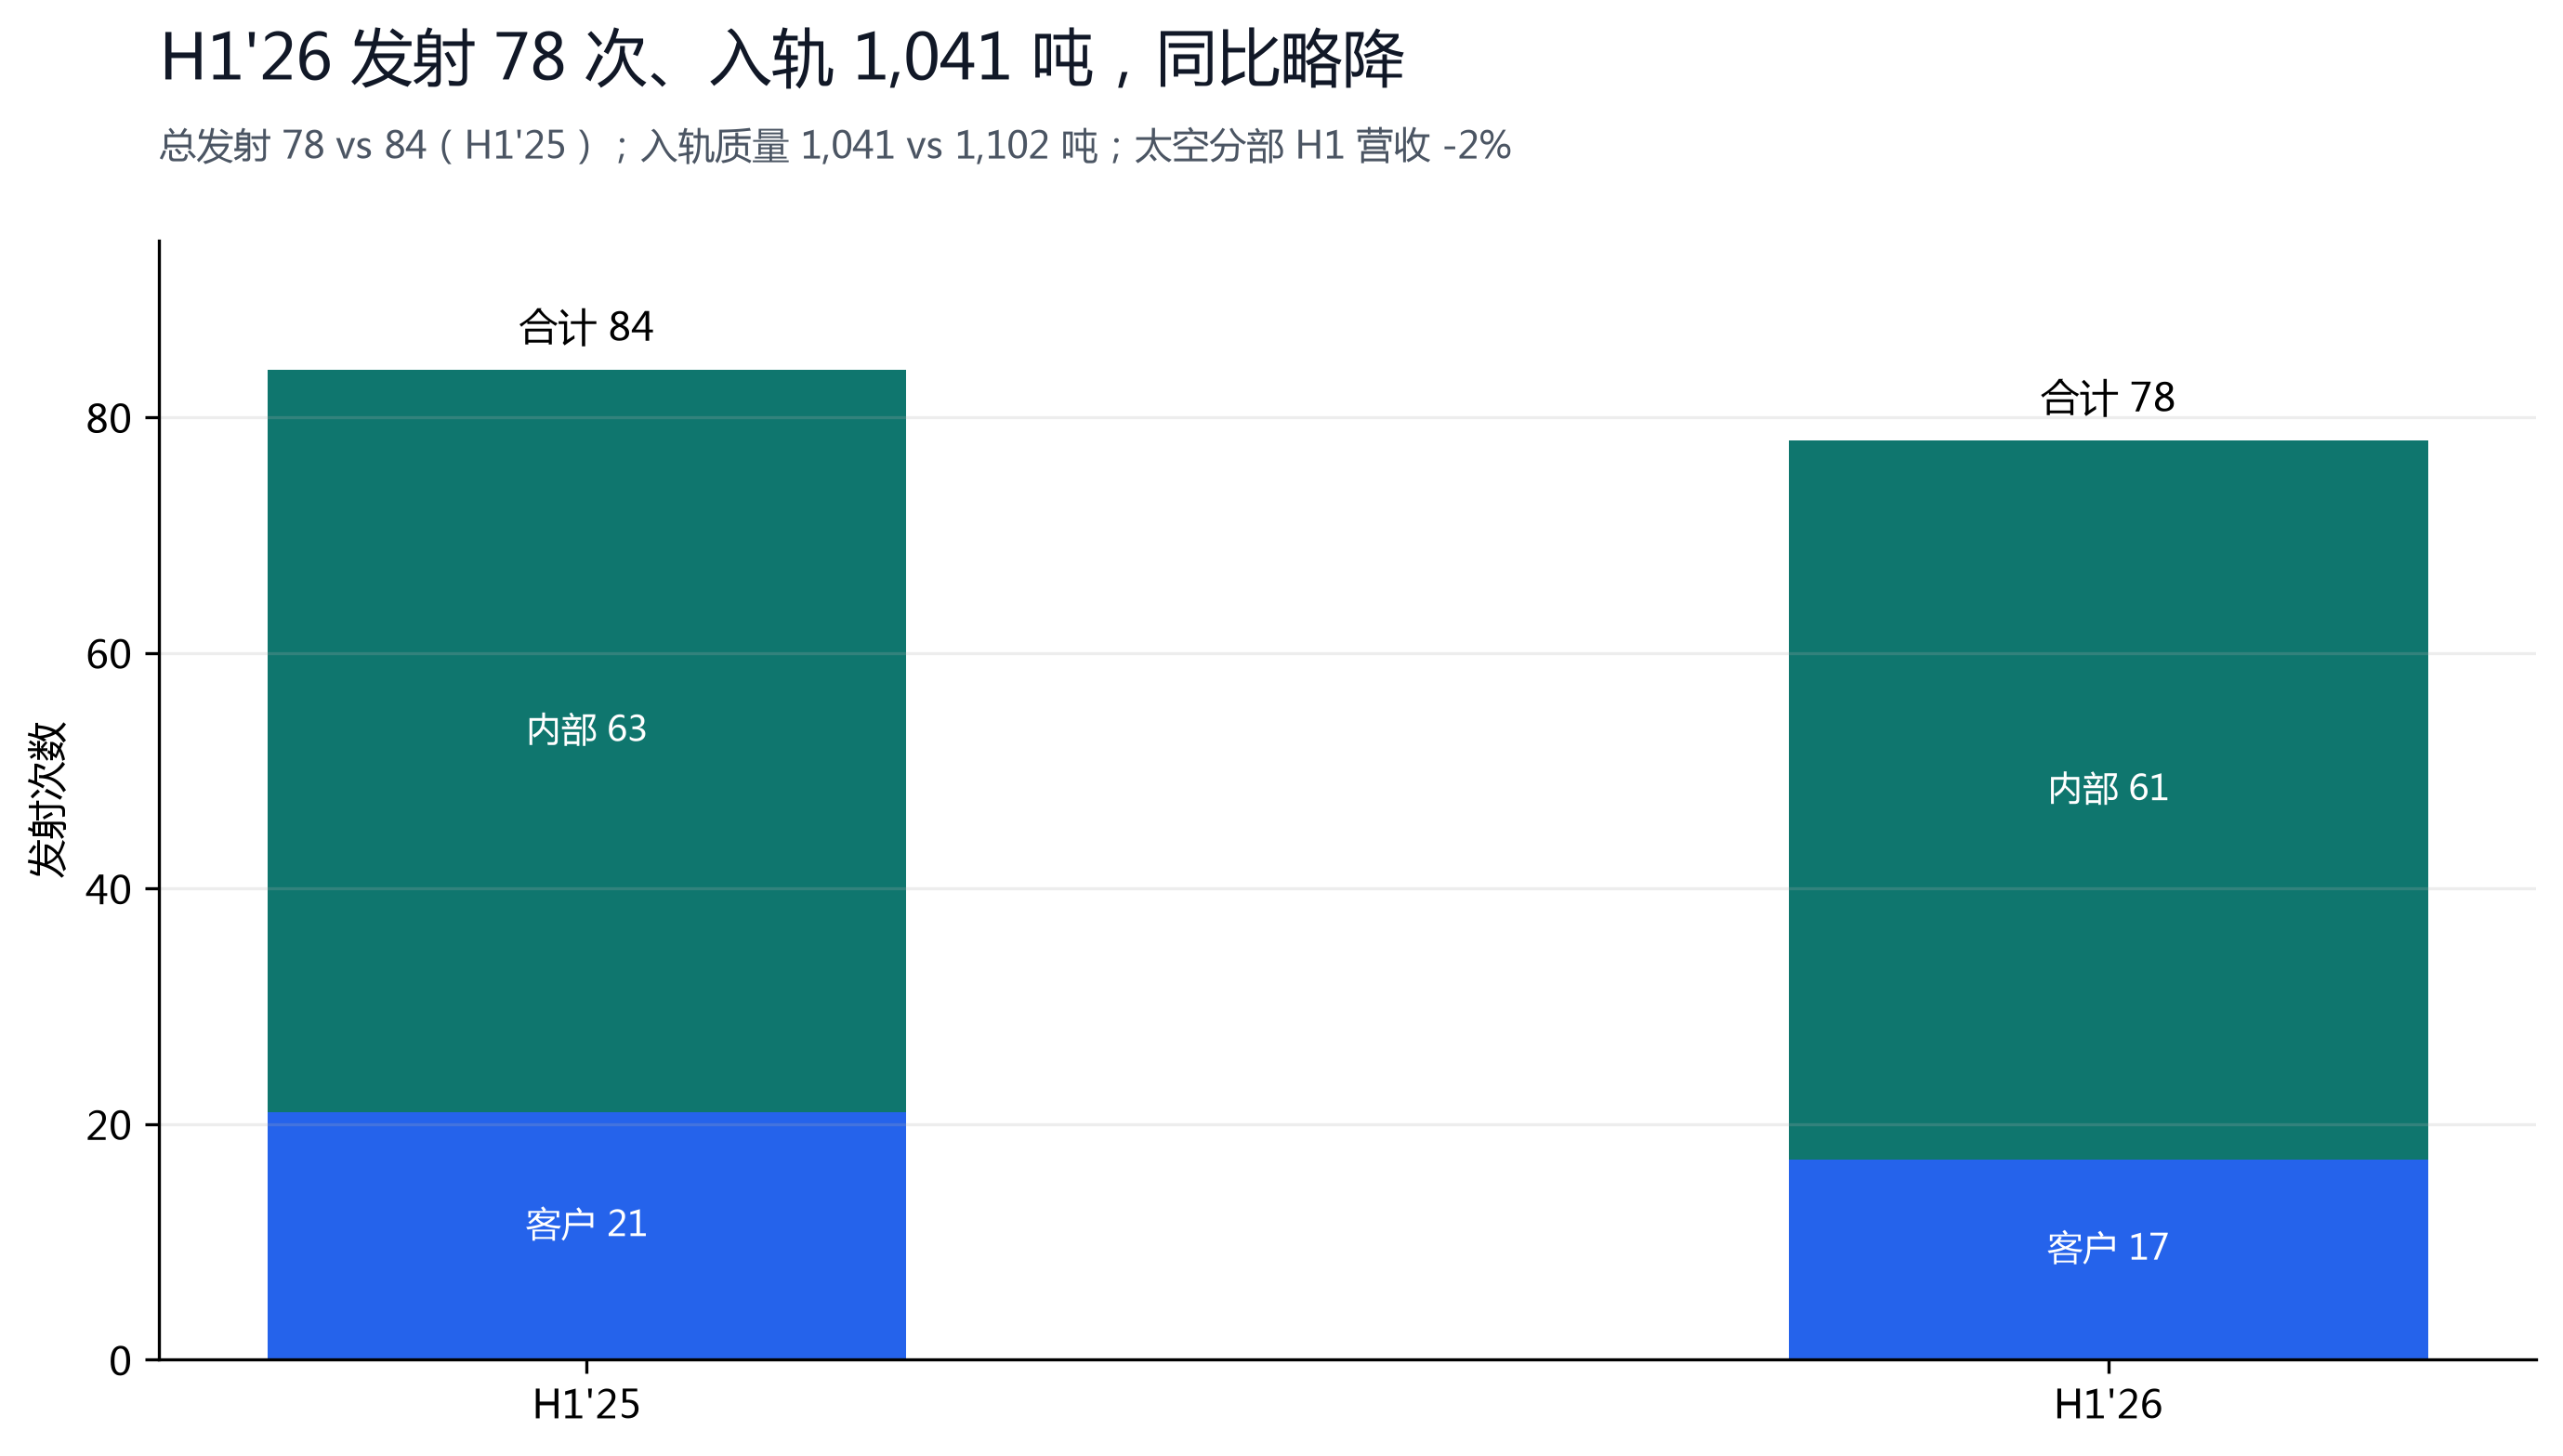
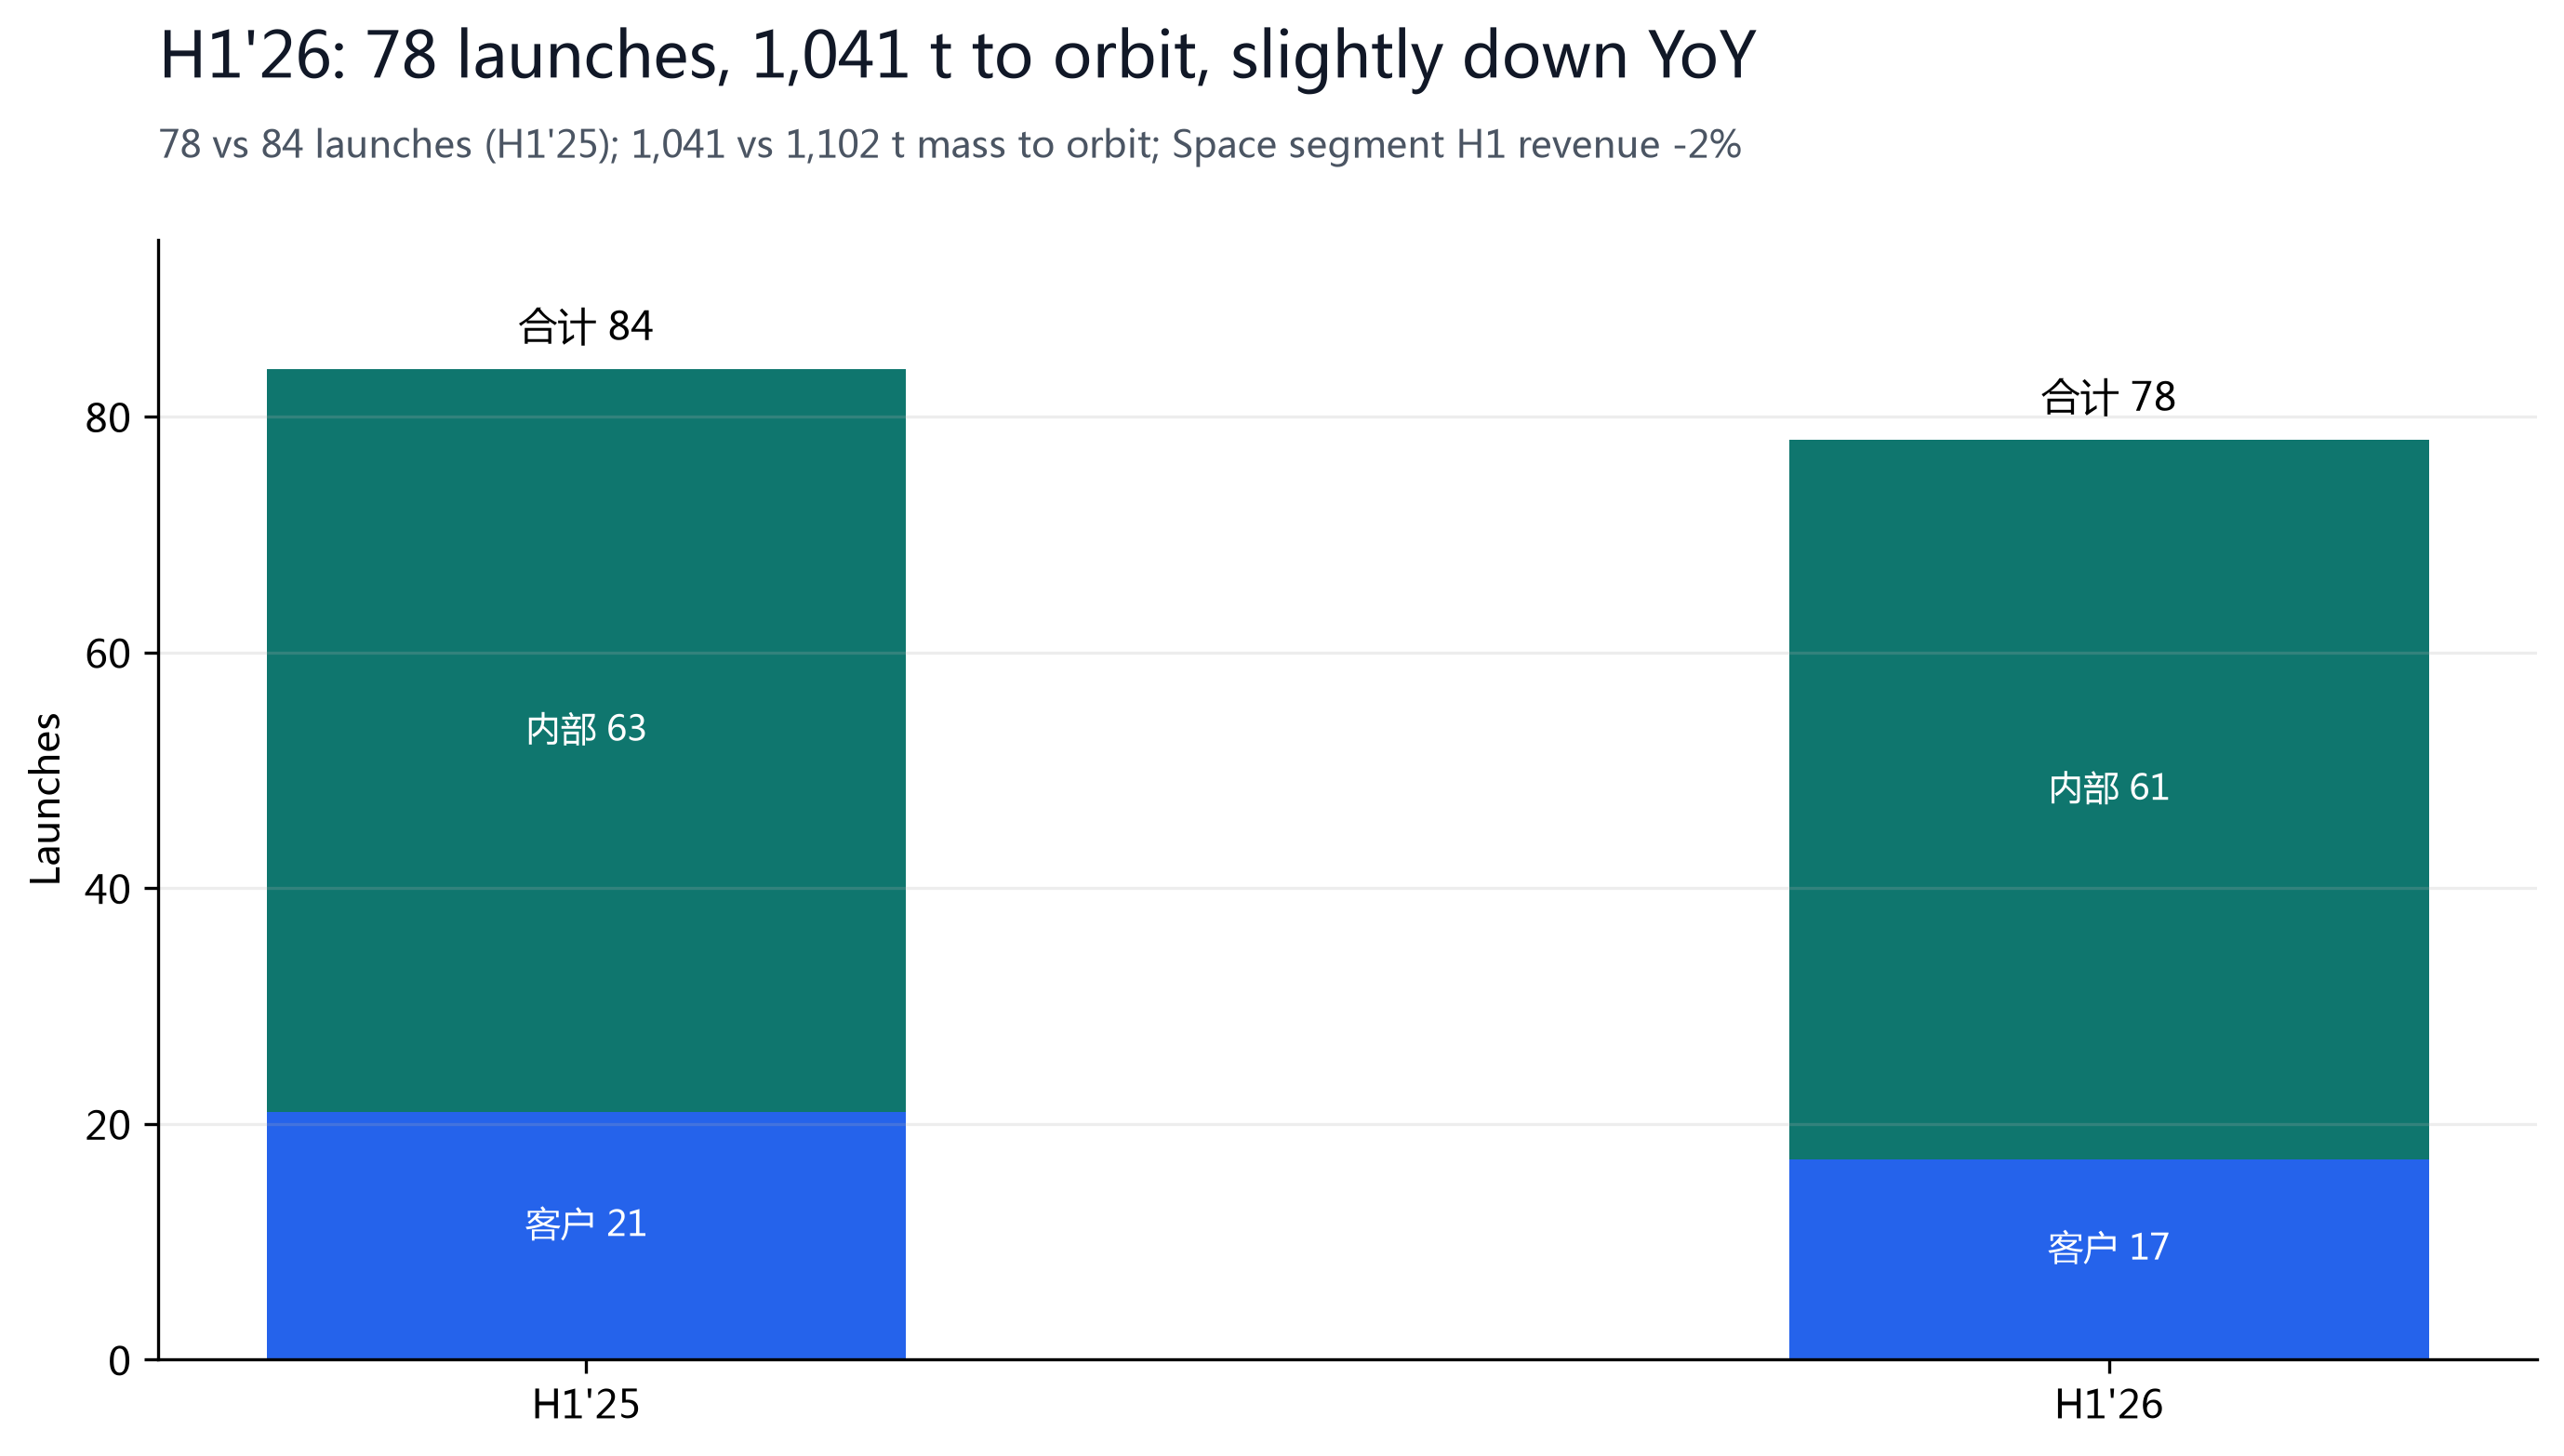
First, supply: a staggered lockup starting Aug 6 expands the float from ~4% to ~40% by Dec 8 — 1.4x the current float in new supply overhangs the tape, and insiders (including RSU holders selling to pay taxes) who become eligible two trading days after earnings have little reason not to sell into any bounce. Second, cash flow: Q2'26 capex was $18.4B, of which AI was $15.8B, and management said Q3/Q4 would run about the same — H1'26 free cash flow was about -$25.0B (calculated) and the Street expects -$28.4B for the year, a burn rate far outpacing operating cash generation (H1'26 CFO of only +$3.5B); the $100B cash pile looks ample but burns through in about three years at this pace. Third, mature-business deceleration: Starlink ARPU fell 22% YoY (international expansion plus cheaper plans), the Space segment's H1 revenue fell 2% YoY — the slowest of the three segments — and H1 launches (78) were six fewer than a year earlier. Fourth, valuation: 42x FY2026E sales is not cheap for a statement with deeply negative free cash flow, and the tiny float amplifies volatility.
§04Financial Truth
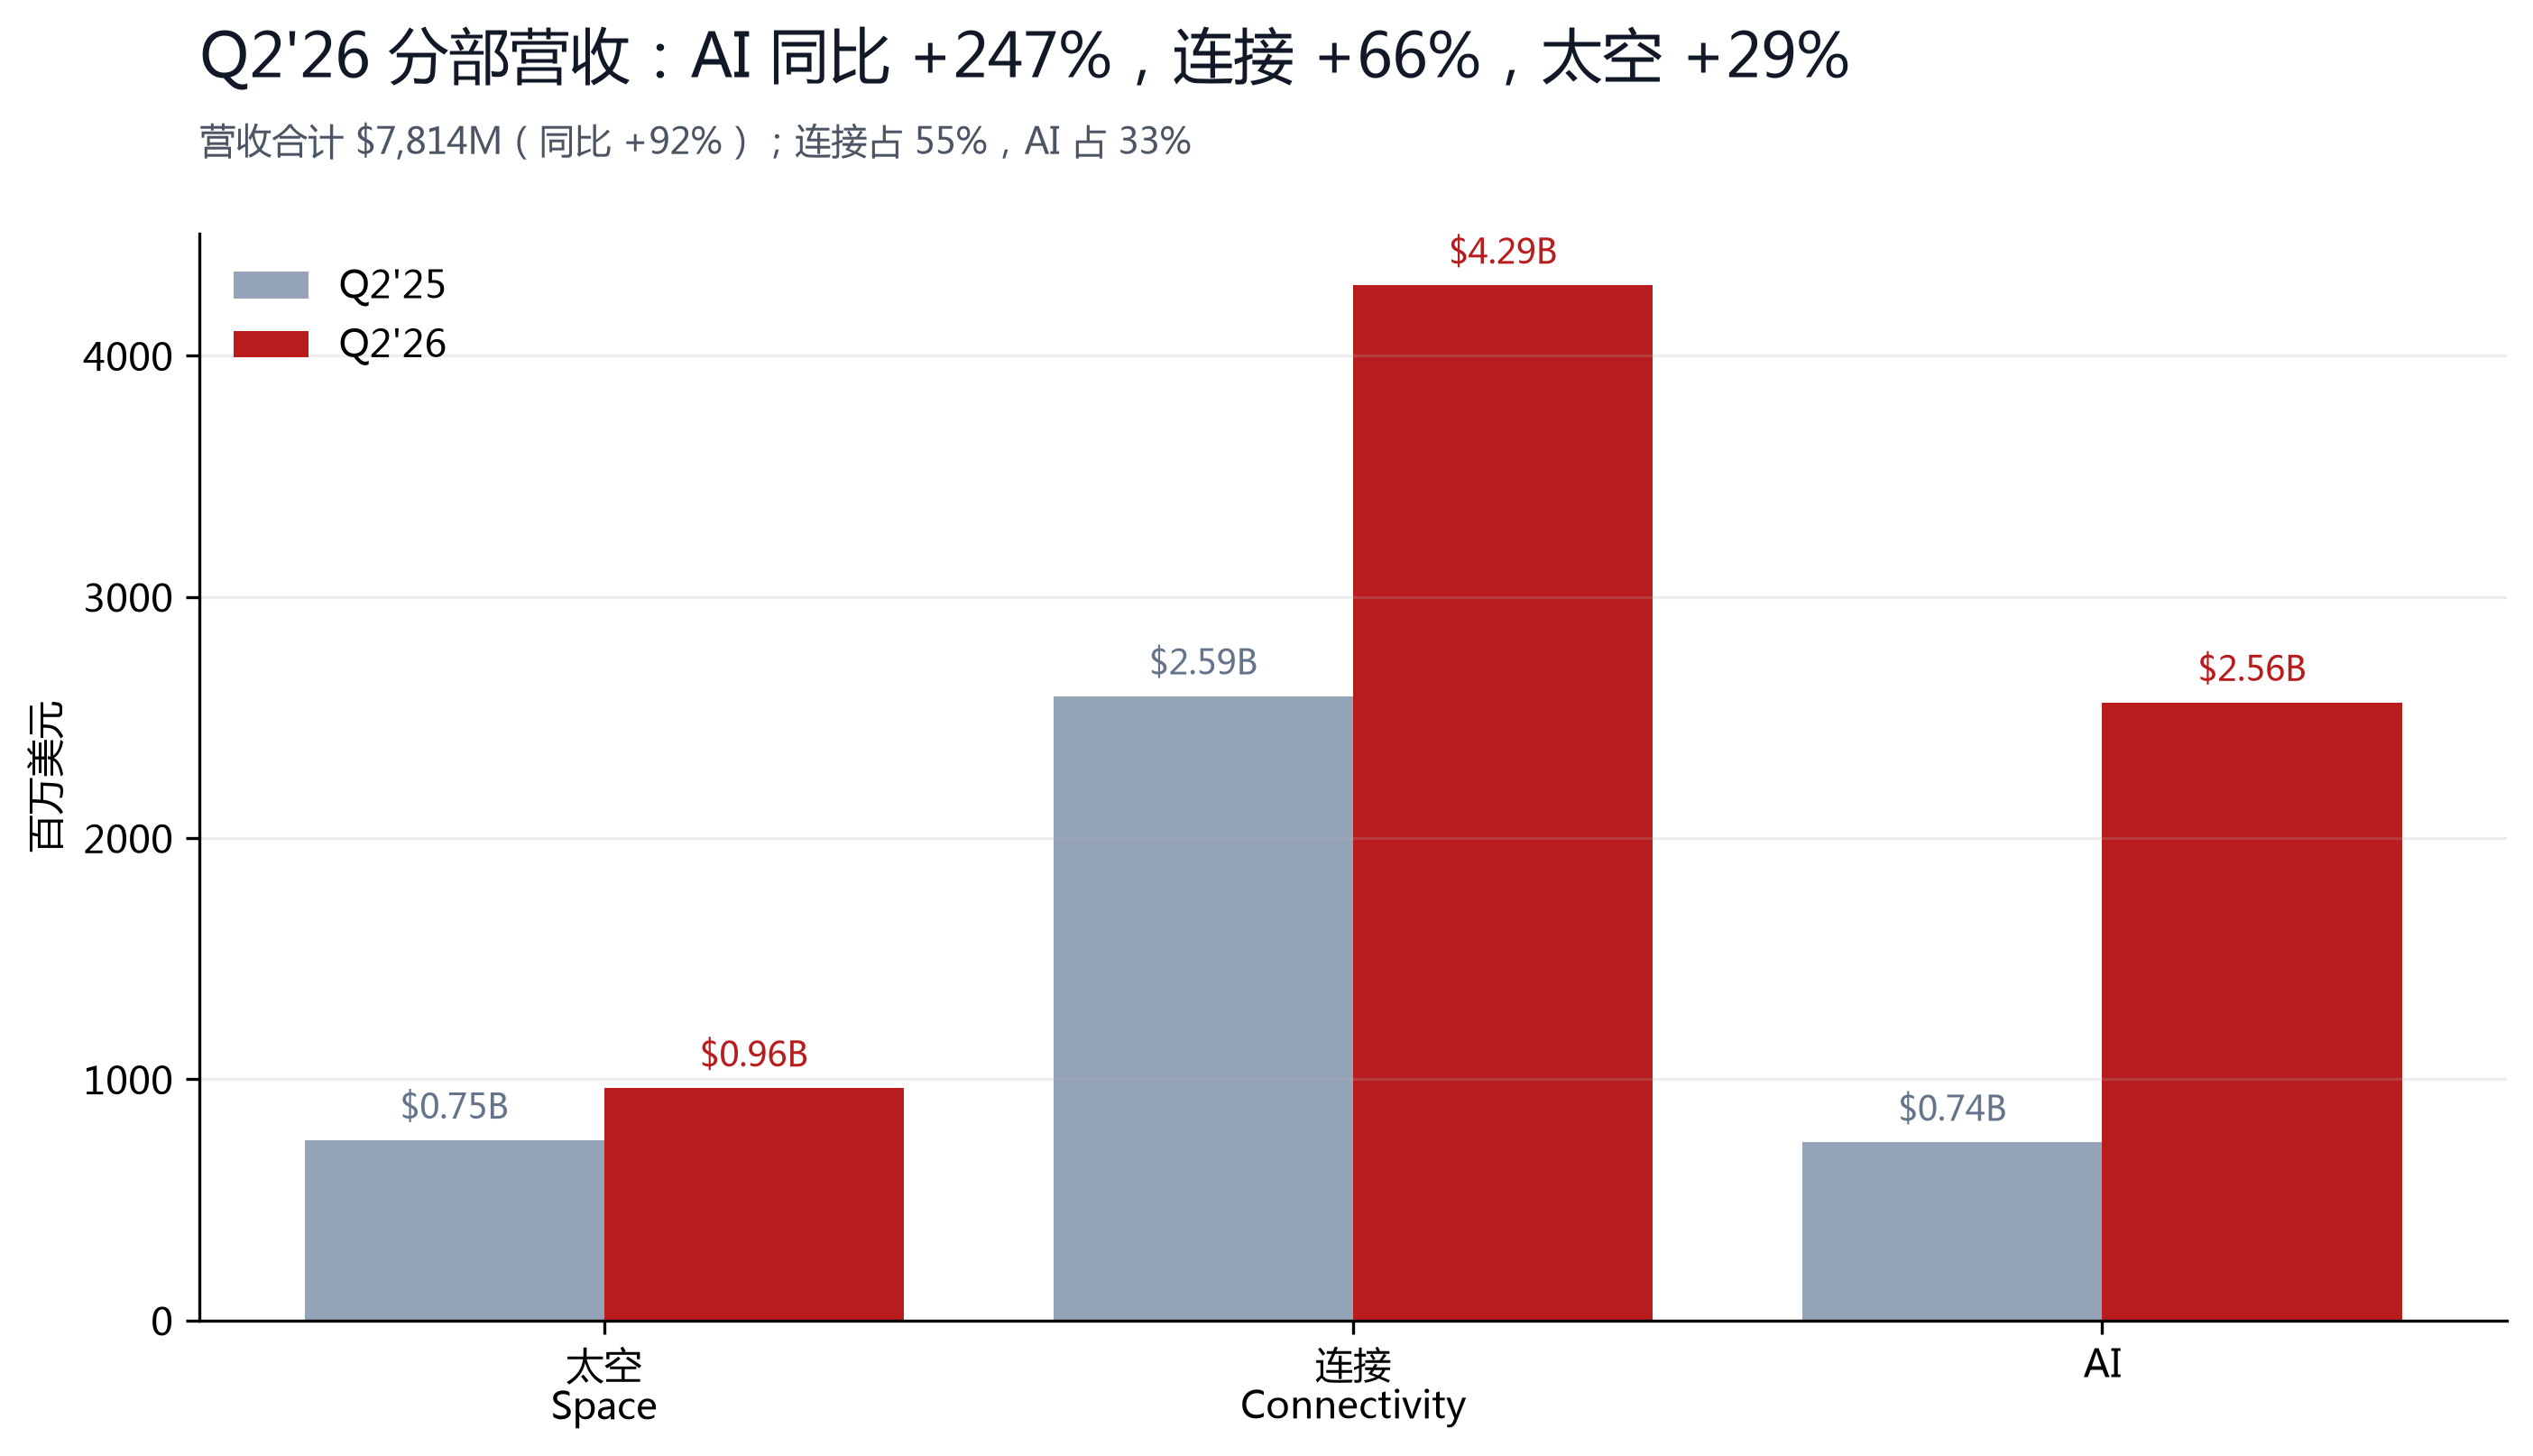
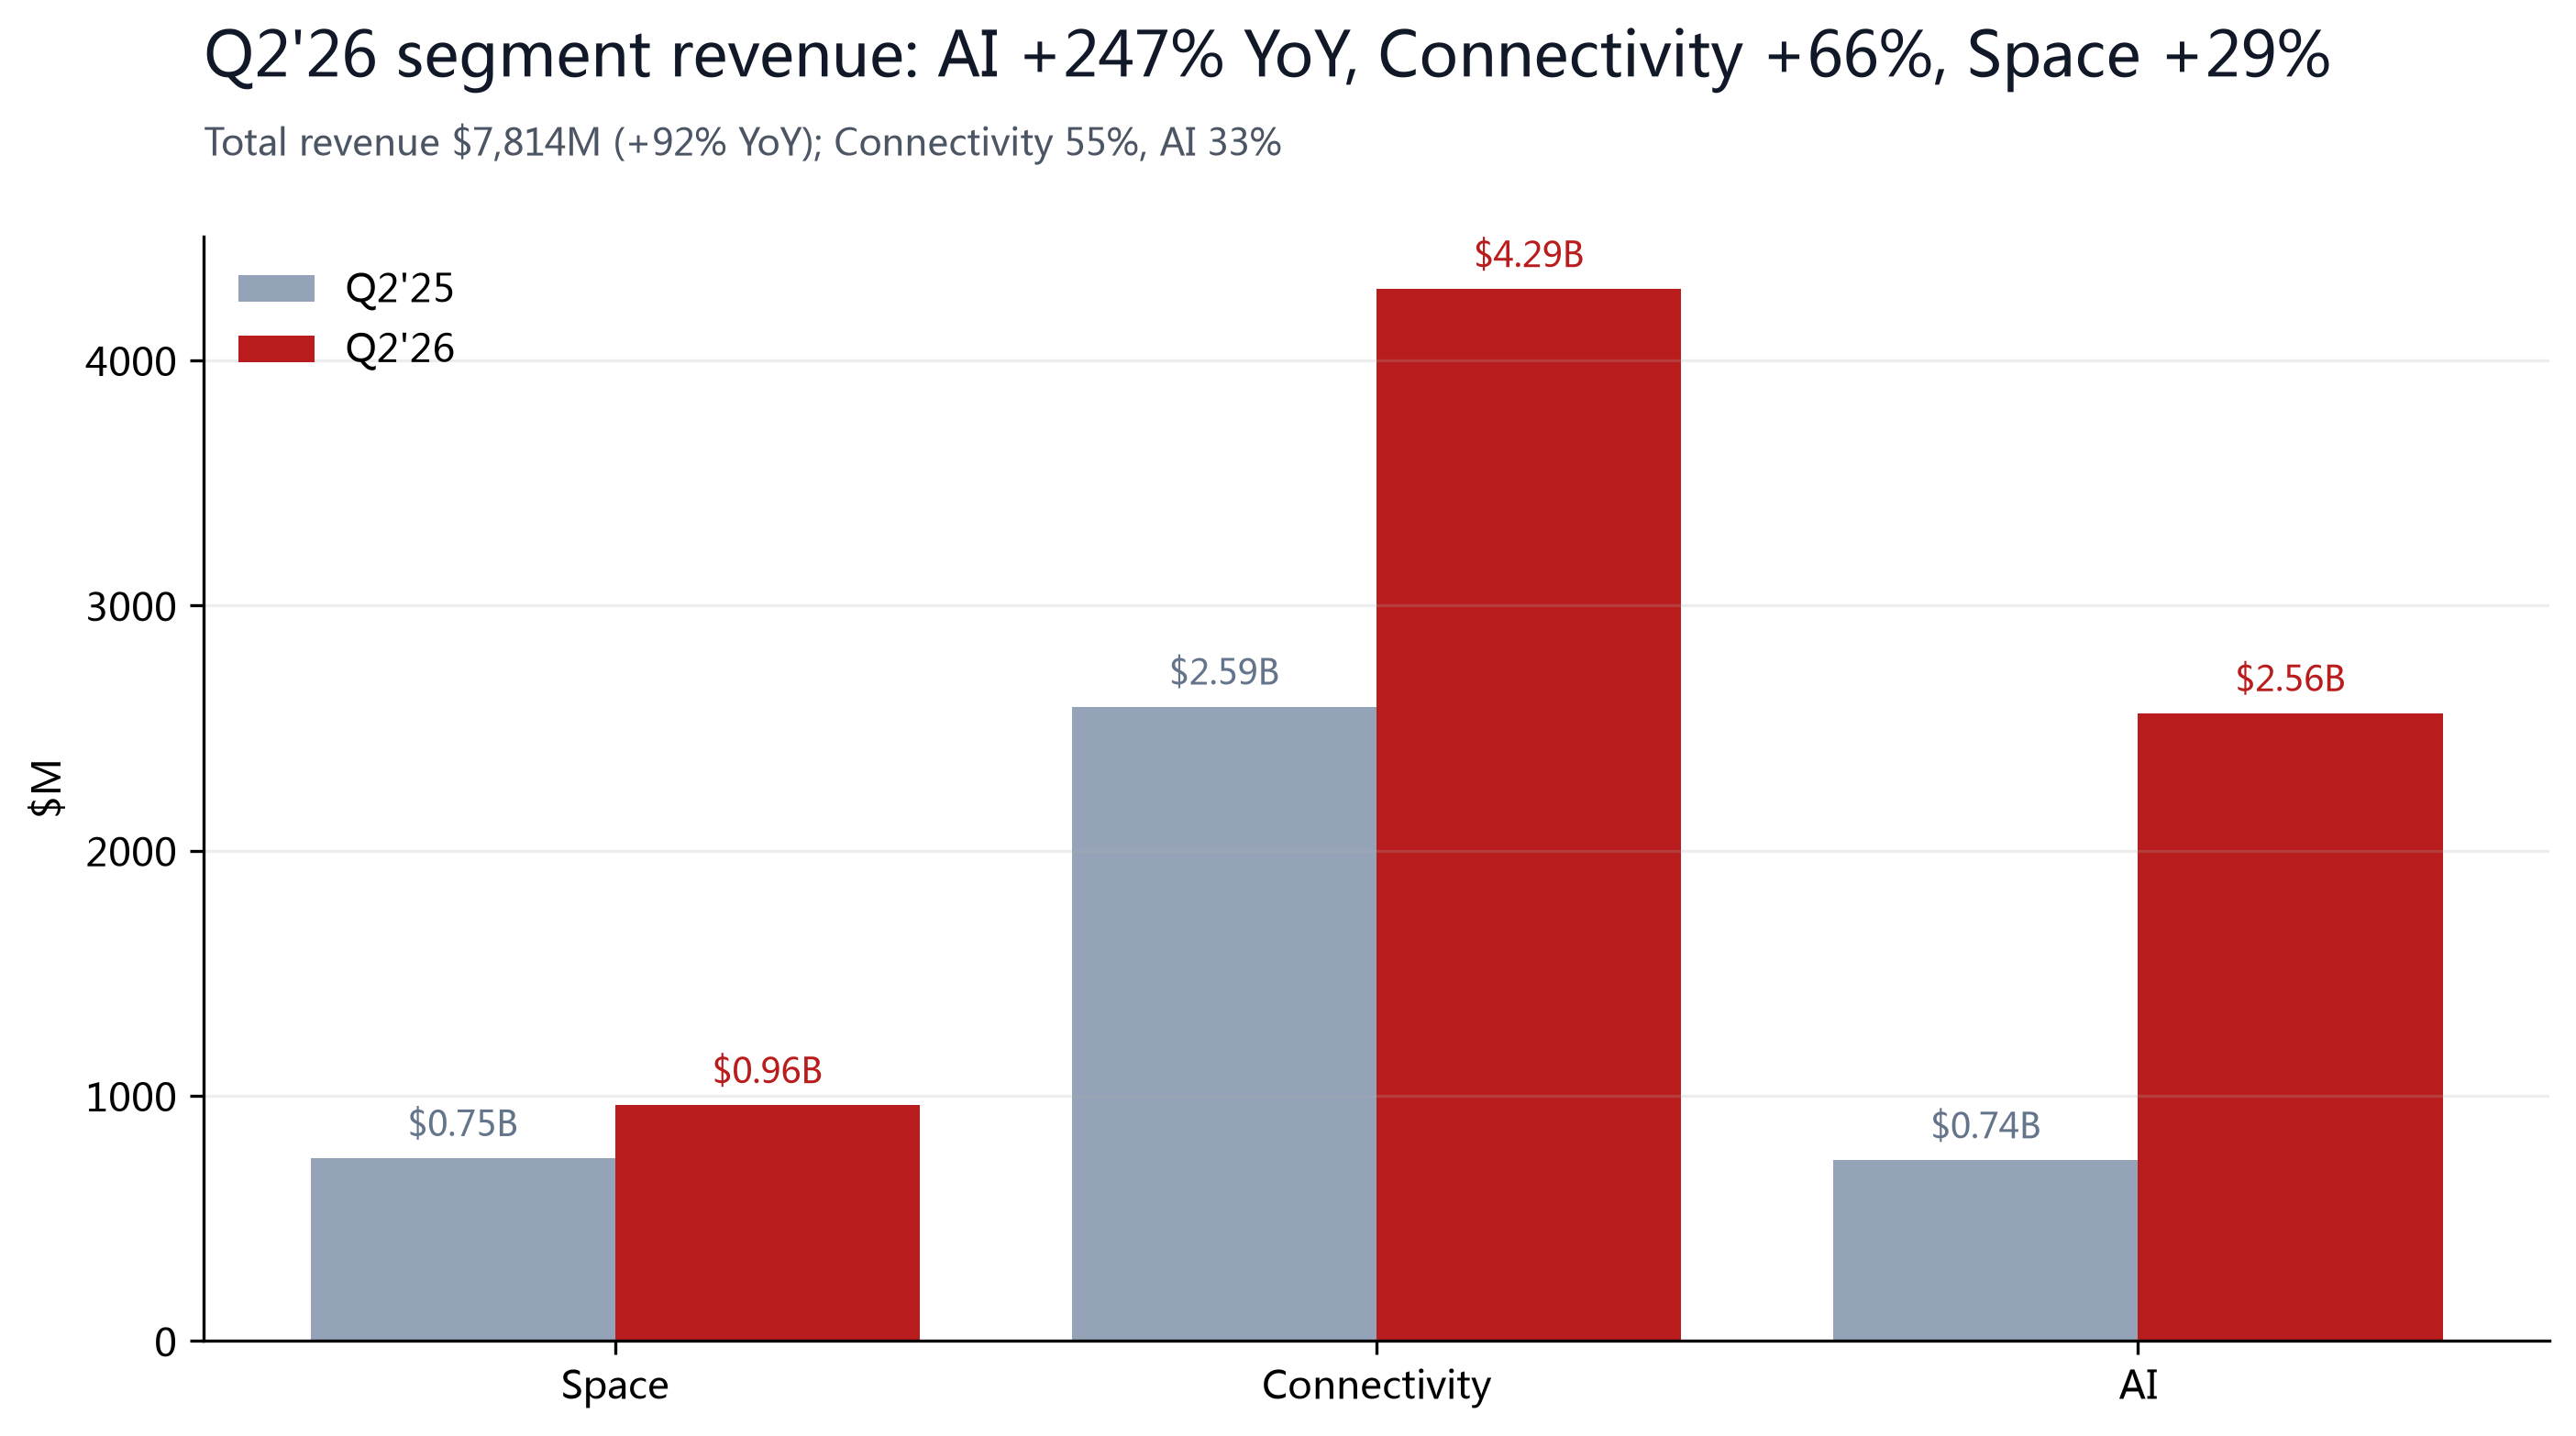
Q2'26 total revenue was $7,814M (+92% YoY), adjusted EBITDA $3,538M (+192% YoY), the operating loss narrowed to $143M (vs -$970M a year ago), net loss $541M (-46% YoY), and EPS -$0.09 (vs -$0.26 expected). Half-year view: H1'26 revenue $12,508M (+54% YoY) and a net loss of $4,817M. Note the measure mix: adjusted EBITDA is a non-GAAP sum of segments at +$3,538M for Q2'26; GAAP net loss is still negative, with the gap mainly R&D and net interest expense (Q2'26 R&D $3,548M, net interest ~$289M).
| Metric (Q2'26) | Actual | Consensus | Diff | Note |
|---|---|---|---|---|
| 总营收 | $78.14 亿 | $69.3 亿 | +12.8% | 同比 +92%(上年 $41 亿) |
| — Space | $9.62 亿 | $8.35 亿 | +15.2% | 同比 +29% |
| — Connectivity | $42.91 亿 | $38.3 亿 | +12.0% | 同比 +66% |
| — AI | $25.61 亿 | $21.8 亿 | +17.5% | 同比 +247% |
| 每股亏损 EPS | -$0.09 | -$0.26 | 好 65% | LSEG 预期 |
| AI 分部运营亏损 | -$12.57 亿 | -$23.9 亿 | 好 $11.3 亿 | 环比减半(Q1'26 -$24.69 亿) |
The AI segment was the biggest beat in this report, but the quality of the narrowing loss needs unpacking: adjusted EBITDA turned positive at +$1,146M mainly on the back of excluding $1.89B of D&A and other non-cash items (that measure was -$609M in Q1'26); GAAP operating loss of -$1,257M still came in far better than the -$2,390M the Street expected. The revenue surge is backed by real contracts: $14.1B of Q2 cloud-service contract sales (including ~$920M/month from Google through mid-2029, with Anthropic and others on similar deals) contributed $1.6B of incremental AI-infrastructure revenue in the quarter; management disclosed on the call that the first weeks of Q3 already added ~$6.7B of new cloud signings (about six months, ramping in October) and guided to roughly $100B of December-annualized revenue (including Cursor) by year-end.
| Metric ($M) | Q2'25 | Q1'26 | Q2'26 | H1'26 |
|---|---|---|---|---|
| Total revenue | 4,071 | 4,694 | 7,814 | 12,508 |
| — Space | 746 | 619 | 962 | 1,581 |
| — Connectivity | 2,588 | 3,257 | 4,291 | 7,548 |
| — AI | 737 | 818 | 2,561 | 3,379 |
| Operating income (loss) | -970 | -1,943 | -143 | -2,086 |
| Adjusted EBITDA (segments) | 1,214 | 1,127 | 3,538 | 4,665 |
| Net loss | -1,008 | -4,276* | -541 | -4,817 |
| Diluted EPS | -$0.34 | — | -$0.09 | -$1.12 |
*Q1'26 net loss is derived as H1'26 $4,817M minus Q2'26 $541M (-$4,276M); Q1'26 EPS is not shown separately because the pre-IPO share base differs from the H1 average. Differences between segment EBITDA and GAAP operating income include inter-segment eliminations and unallocated costs; see the 8-K reconciliation.
| FY2025 segments (S-1) | 营收 | 运营利润 | 调整后 EBITDA |
|---|---|---|---|
| Connectivity(星链) | $113.87 亿(+49.8%) | +$44.23 亿 | +$71.68 亿(利润率 63%) |
| Space(航天) | $40.86 亿 | -$6.57 亿 | +$6.53 亿 |
| AI | $32.01 亿 | -$63.55 亿 | -$12.37 亿 |
| 合并 | $186.74 亿(+33%) | -$25.89 亿 | +$65.84 亿 |
Note: FY2025 segments are per the S-1 prospectus (multiple sources agree); xAI was consolidated on 2026-02-02 at a $250B valuation, which drove the 2025 AI-segment loss of $6,355M and the $4.94B consolidated net loss — a 'Starlink's profits cannot cover AI's burn' pattern that materially improved by Q2'26 (AI segment EBITDA turned positive). FY2025 capex was $20.7B, of which AI was $12.7B (61.4%).
| Balance sheet (Jun 30, 2026) | Amount | Note |
|---|---|---|
| Cash & marketable securities | $100.0B | IPO 募资 $85.7B + 发债 $25B 后 |
| Total assets | $192.8B | vs 2025-12-31 $92.1B |
| Total debt & finance leases | $39.4B | 含 6/26 发行的 $25B 债券(5.855%) |
| Net cash (计算) | $60.6B | 现金 $100.0B - 债务 $39.4B |
| Shareholders' equity | $127.2B | vs 2025-12-31 $2.6B(IPO 后膨胀) |
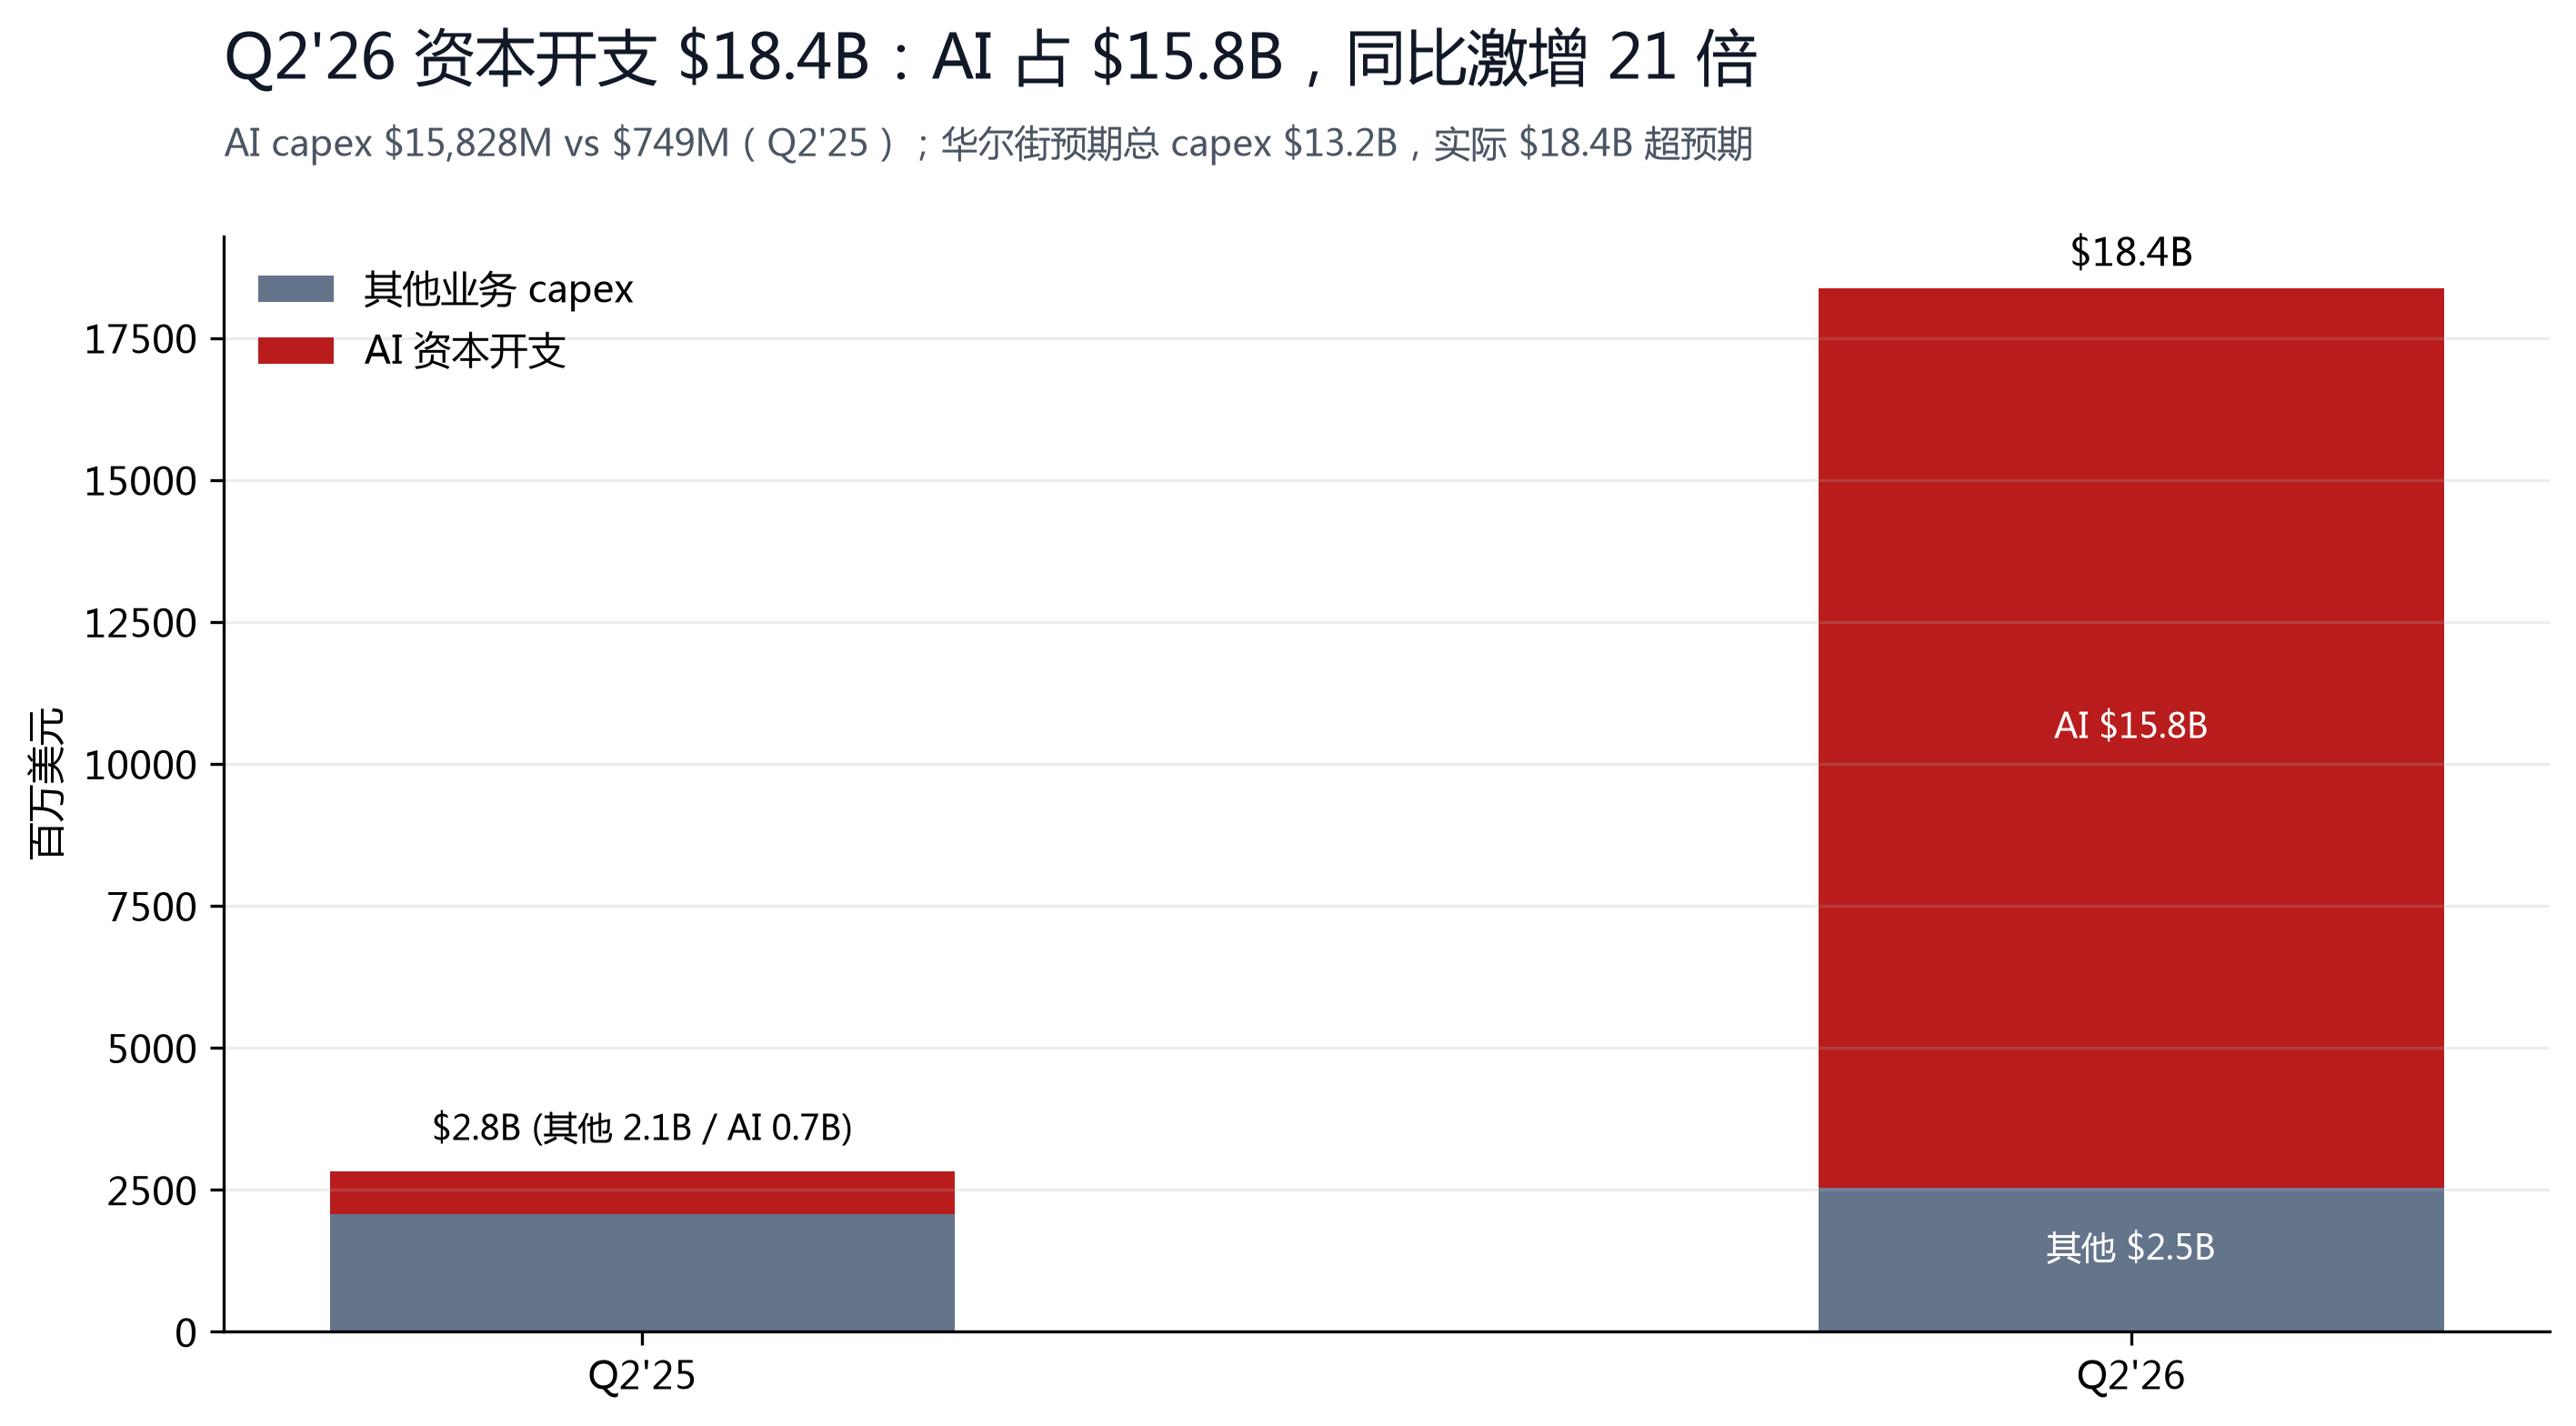
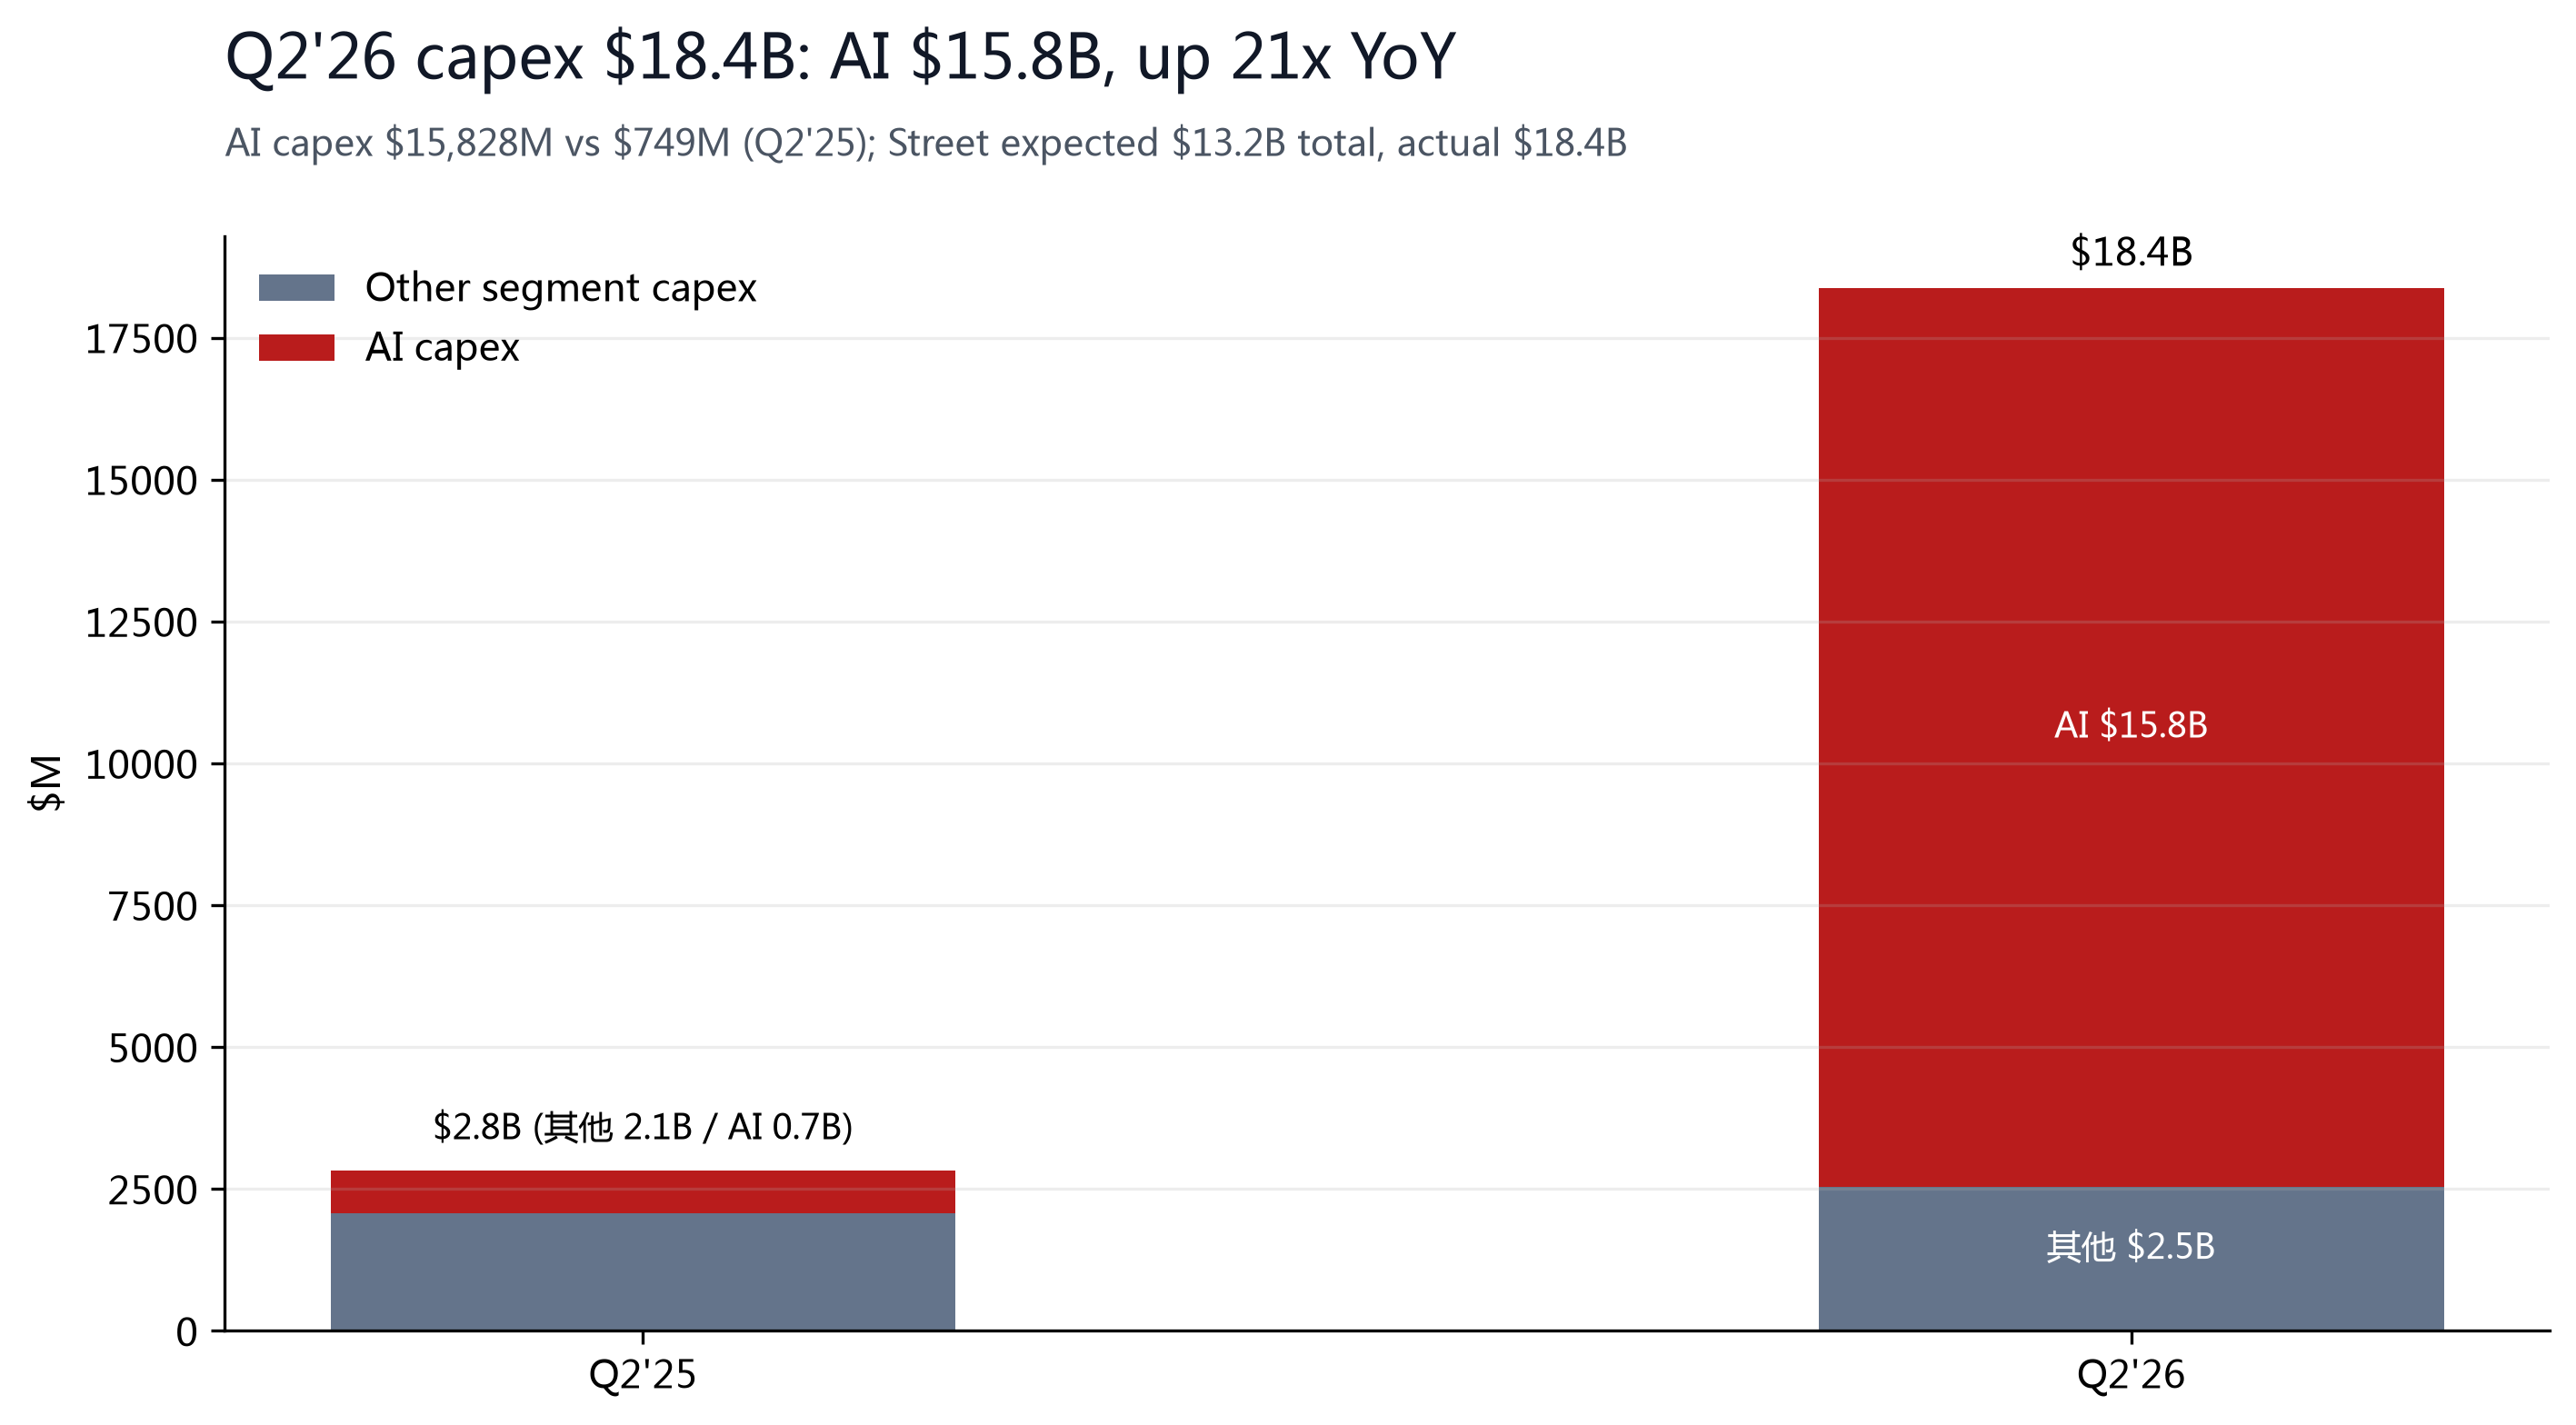
Cash flow is the most glaring part of this report: H1'26 operating cash flow was +$3,466M (vs +$351M a year ago — real improvement), but capex was $28,476M (of which AI was $23,551M) — free cash flow of about -$25,010M (calculated). The burn is entirely AI-infra-driven (Q2'26 AI capex $15,828M vs $749M a year ago, a 21x jump), management said Q3/Q4 AI capex would run about the same, and the Street expects >$45B of total capex for the year. The $100B cash-and-securities pile covers roughly three years at the current rate, but IPO proceeds and the $25B bond issue are the main sources — two orders of magnitude separate operating cash generation from AI capex.
§05Peer Comparables
SpaceX has no perfect peer: its three segments fight in different arenas — Space (launch) vs Rocket Lab (RKLB) and ULA, where SpaceX dominates with a world-leading 78 launches in H1'26 but saw segment revenue -2% YoY; Connectivity (Starlink) vs terrestrial telecom and OneWeb/Iridium, at 12.0M subscribers and $66 ARPU, expanding via 'lower prices for volume' plus enterprise/government revenue +108%; and the AI segment (xAI/Grok/X/data centers) vs OpenAI, Anthropic and Google — at 1.4GW of compute, a $60B Cursor acquisition, and a '$1T revenue by 2030' goal, it sits at the most aggressive end of the AI arms race. The market prices SPCX at about 42x FY2026E / 23x FY2027E sales — between mature blue chips and pure AI concepts: well below hyperscaler earnings-quality premiums, far above any traditional space stock. The following multiples are qualitative references only; source timings differ.
| SPCX's own multiples | Value | Note |
|---|---|---|
| P/S (TTM, $19.3B) | ~85x | computed |
| P/S (FY2026E, $39.1B) | 0x | consensus rev. |
| P/S (FY2027E, $73.2B) | 0x | consensus rev. |
| P/E (TTM) | n/a | 亏损 |
| EV / Sales (FY2026E) | ~26x | EV = 市值 - 净现金 $60.6B |
| Dividend yield | 0% | 无股息 |
Street-views supplement (measures differ, flagged): Deutsche Bank argues that at a $1.4T market cap, Space plus Connectivity already covers essentially the whole stock price, putting AI at ~zero — 'unduly punitive'; Morgan Stanley maintains Overweight on an SOTP at a $225 target (its maintained pre-earnings level). This is directionally consistent with our framework: spot trades at ~3x the floor of current businesses, while the AI growth option is under-appreciated.
§06Ownership and Lockup
The IPO used a dual-class structure: Class A (7,696.3M shares as of Jul 28, 2026) plus Class B (5,485.5M shares) total about 13.18B shares; Elon Musk holds roughly 6.4B shares (12.3% of Class A plus 93.6% of Class B, 10 votes each), over 40% of the company with about 85%+ of voting power and absolute control retained, and his stake is locked for 366 days (to 2027-06-12), outside the normal 180-day lockup. The IPO placed only 638.9M shares and raised net proceeds of $85.7B, leaving a float of about 555.6M shares, ~4.2% of the company — the structural reason post-IPO price swings are amplified.
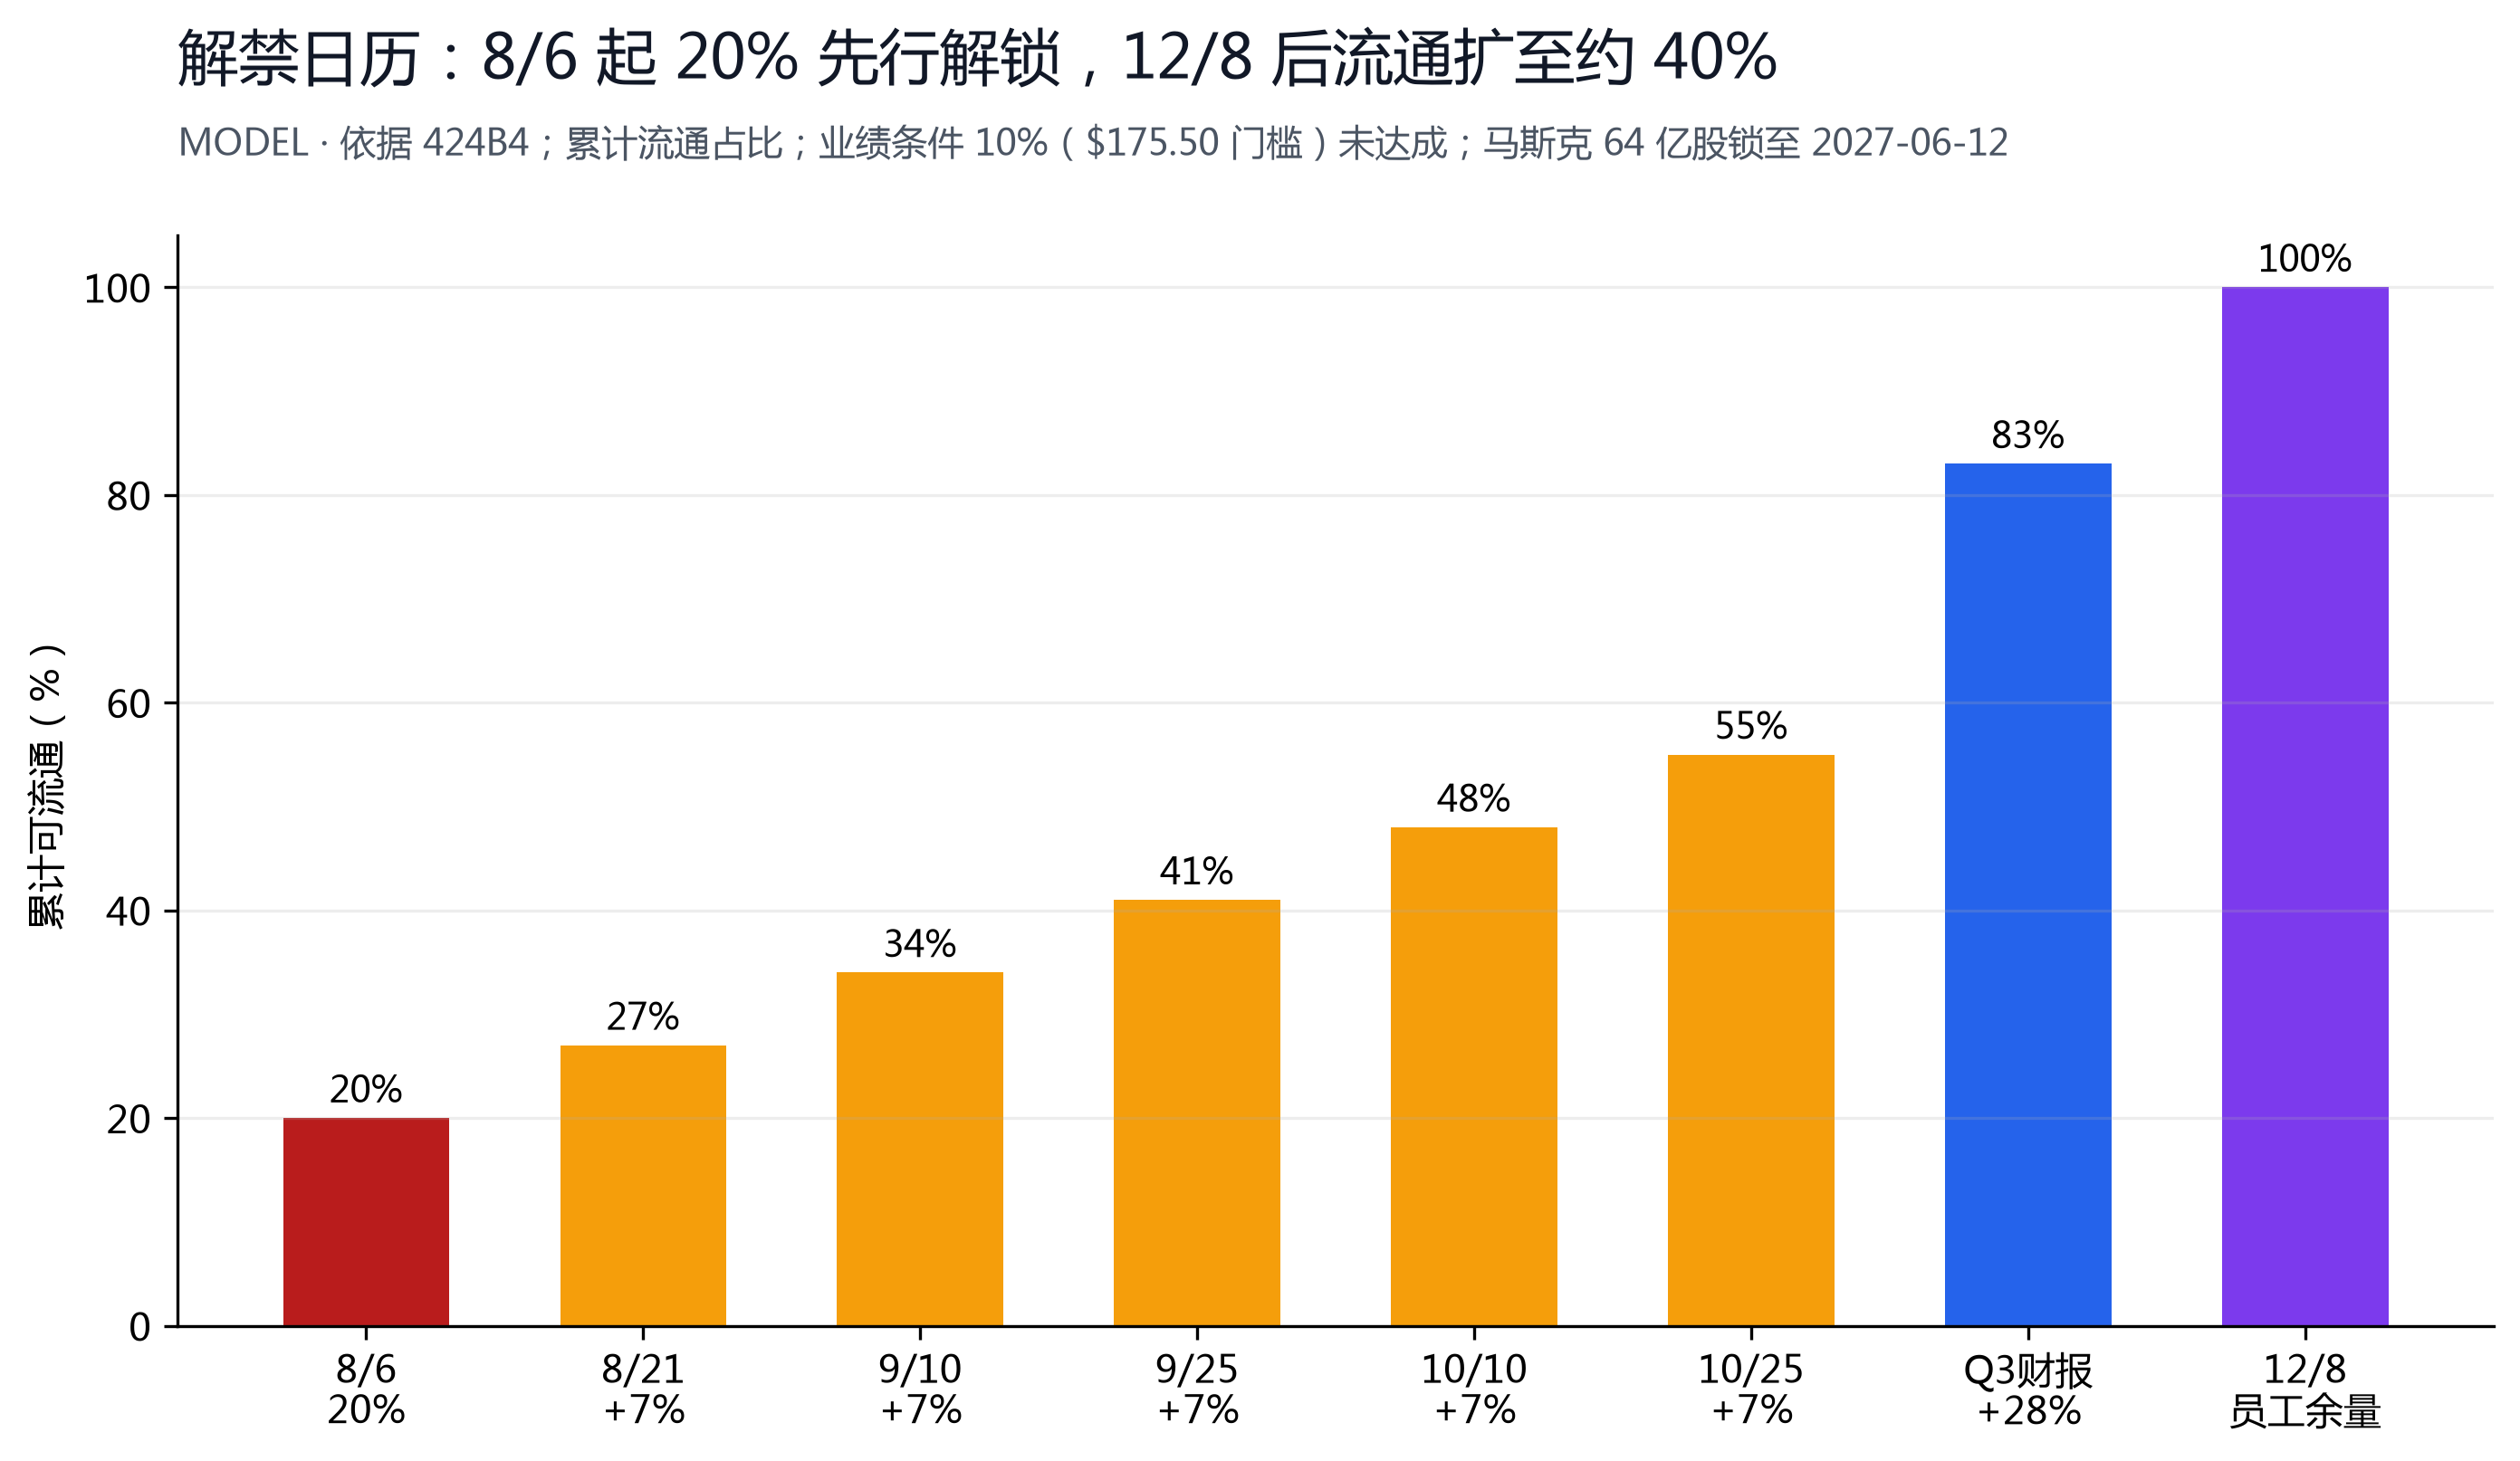
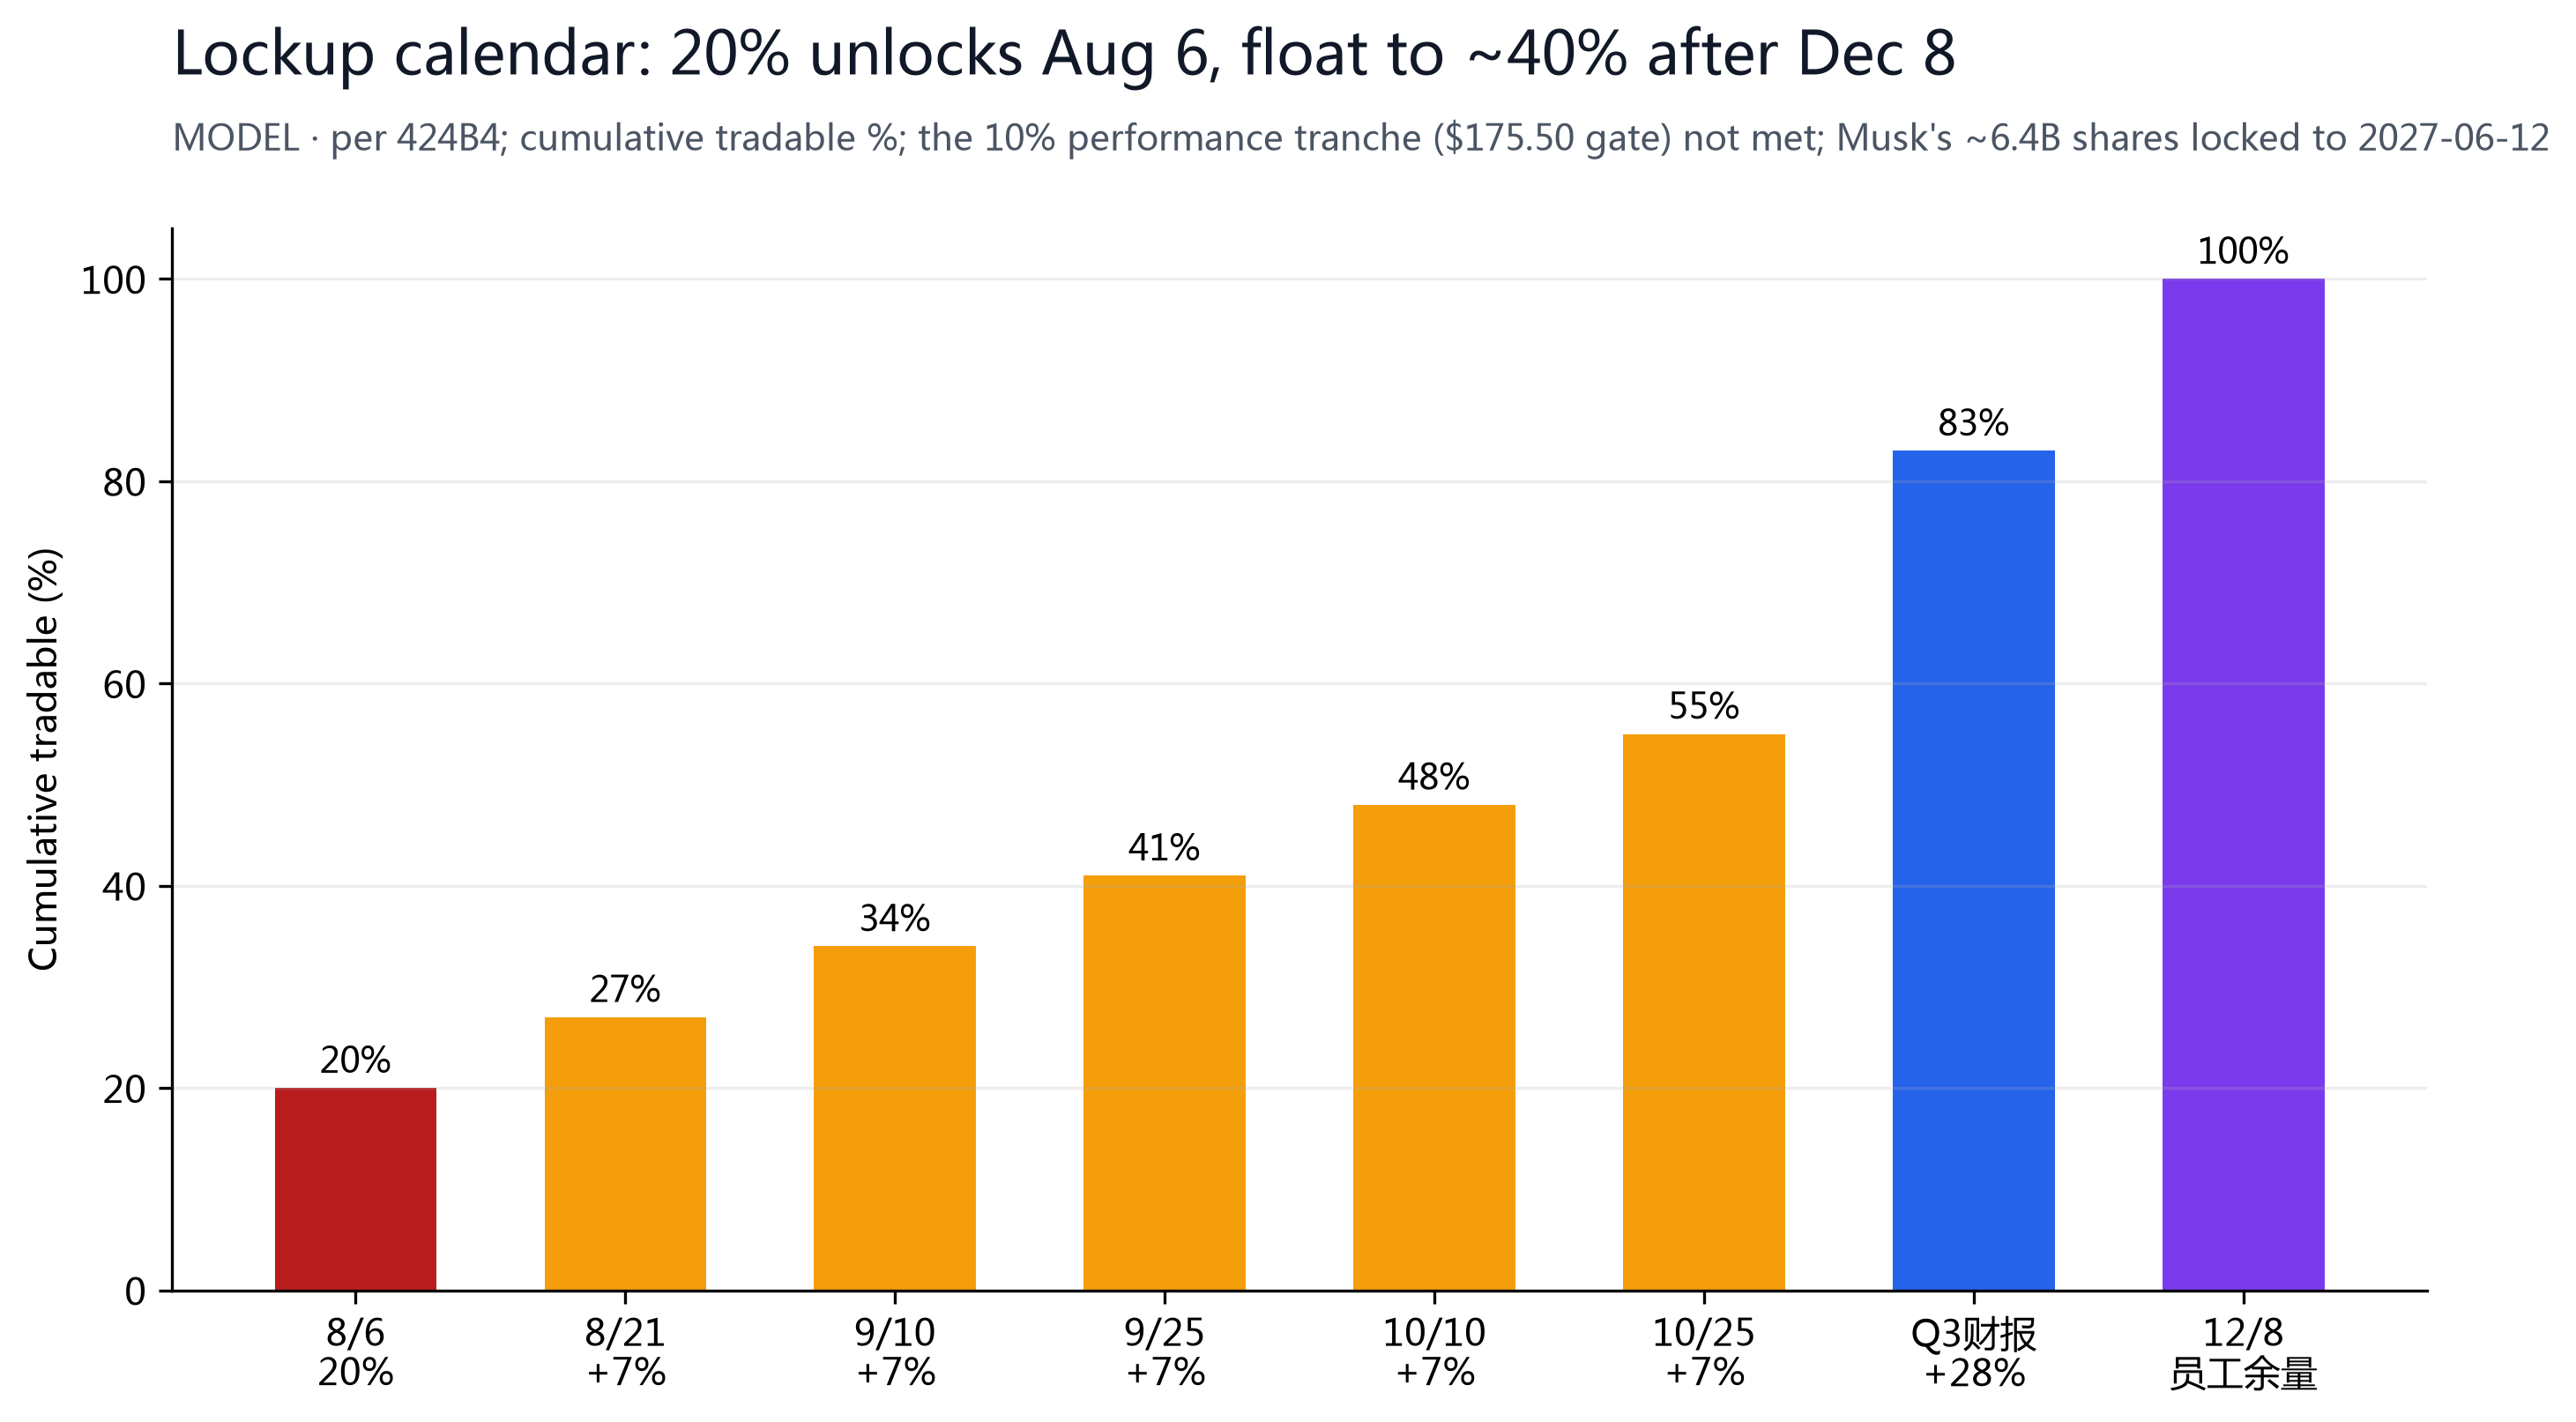
Instead of a standard 180-day cliff, SpaceX engineered a 16-date staggered 'release valve': on August 6 (two trading days after Q2 earnings) about 911.5M shares unlock first (~20% of insider holdings, worth ~$113B at $123.54), then 7% each on 8/21, 9/10, 9/25, 10/10 and 10/25, 28% after Q3 earnings, and the employee remainder by 12/8 (day 180) — the float expands from ~4% to ~40%. A separate 10% performance tranche (requiring 5 of 10 trading days to close at or above $175.50, i.e. IPO +30%, before the earnings date) will not be met at prices around $114-125 in early August. Historical reference: META fell nearly 50% into its first 90-day lockup after its 2012 IPO — a similar pattern to SPCX — but unlock eligibility is not an obligation to sell: Musk is publicly bullish and employee cost bases are far below the spot price, so there is also a hold-the-line logic.
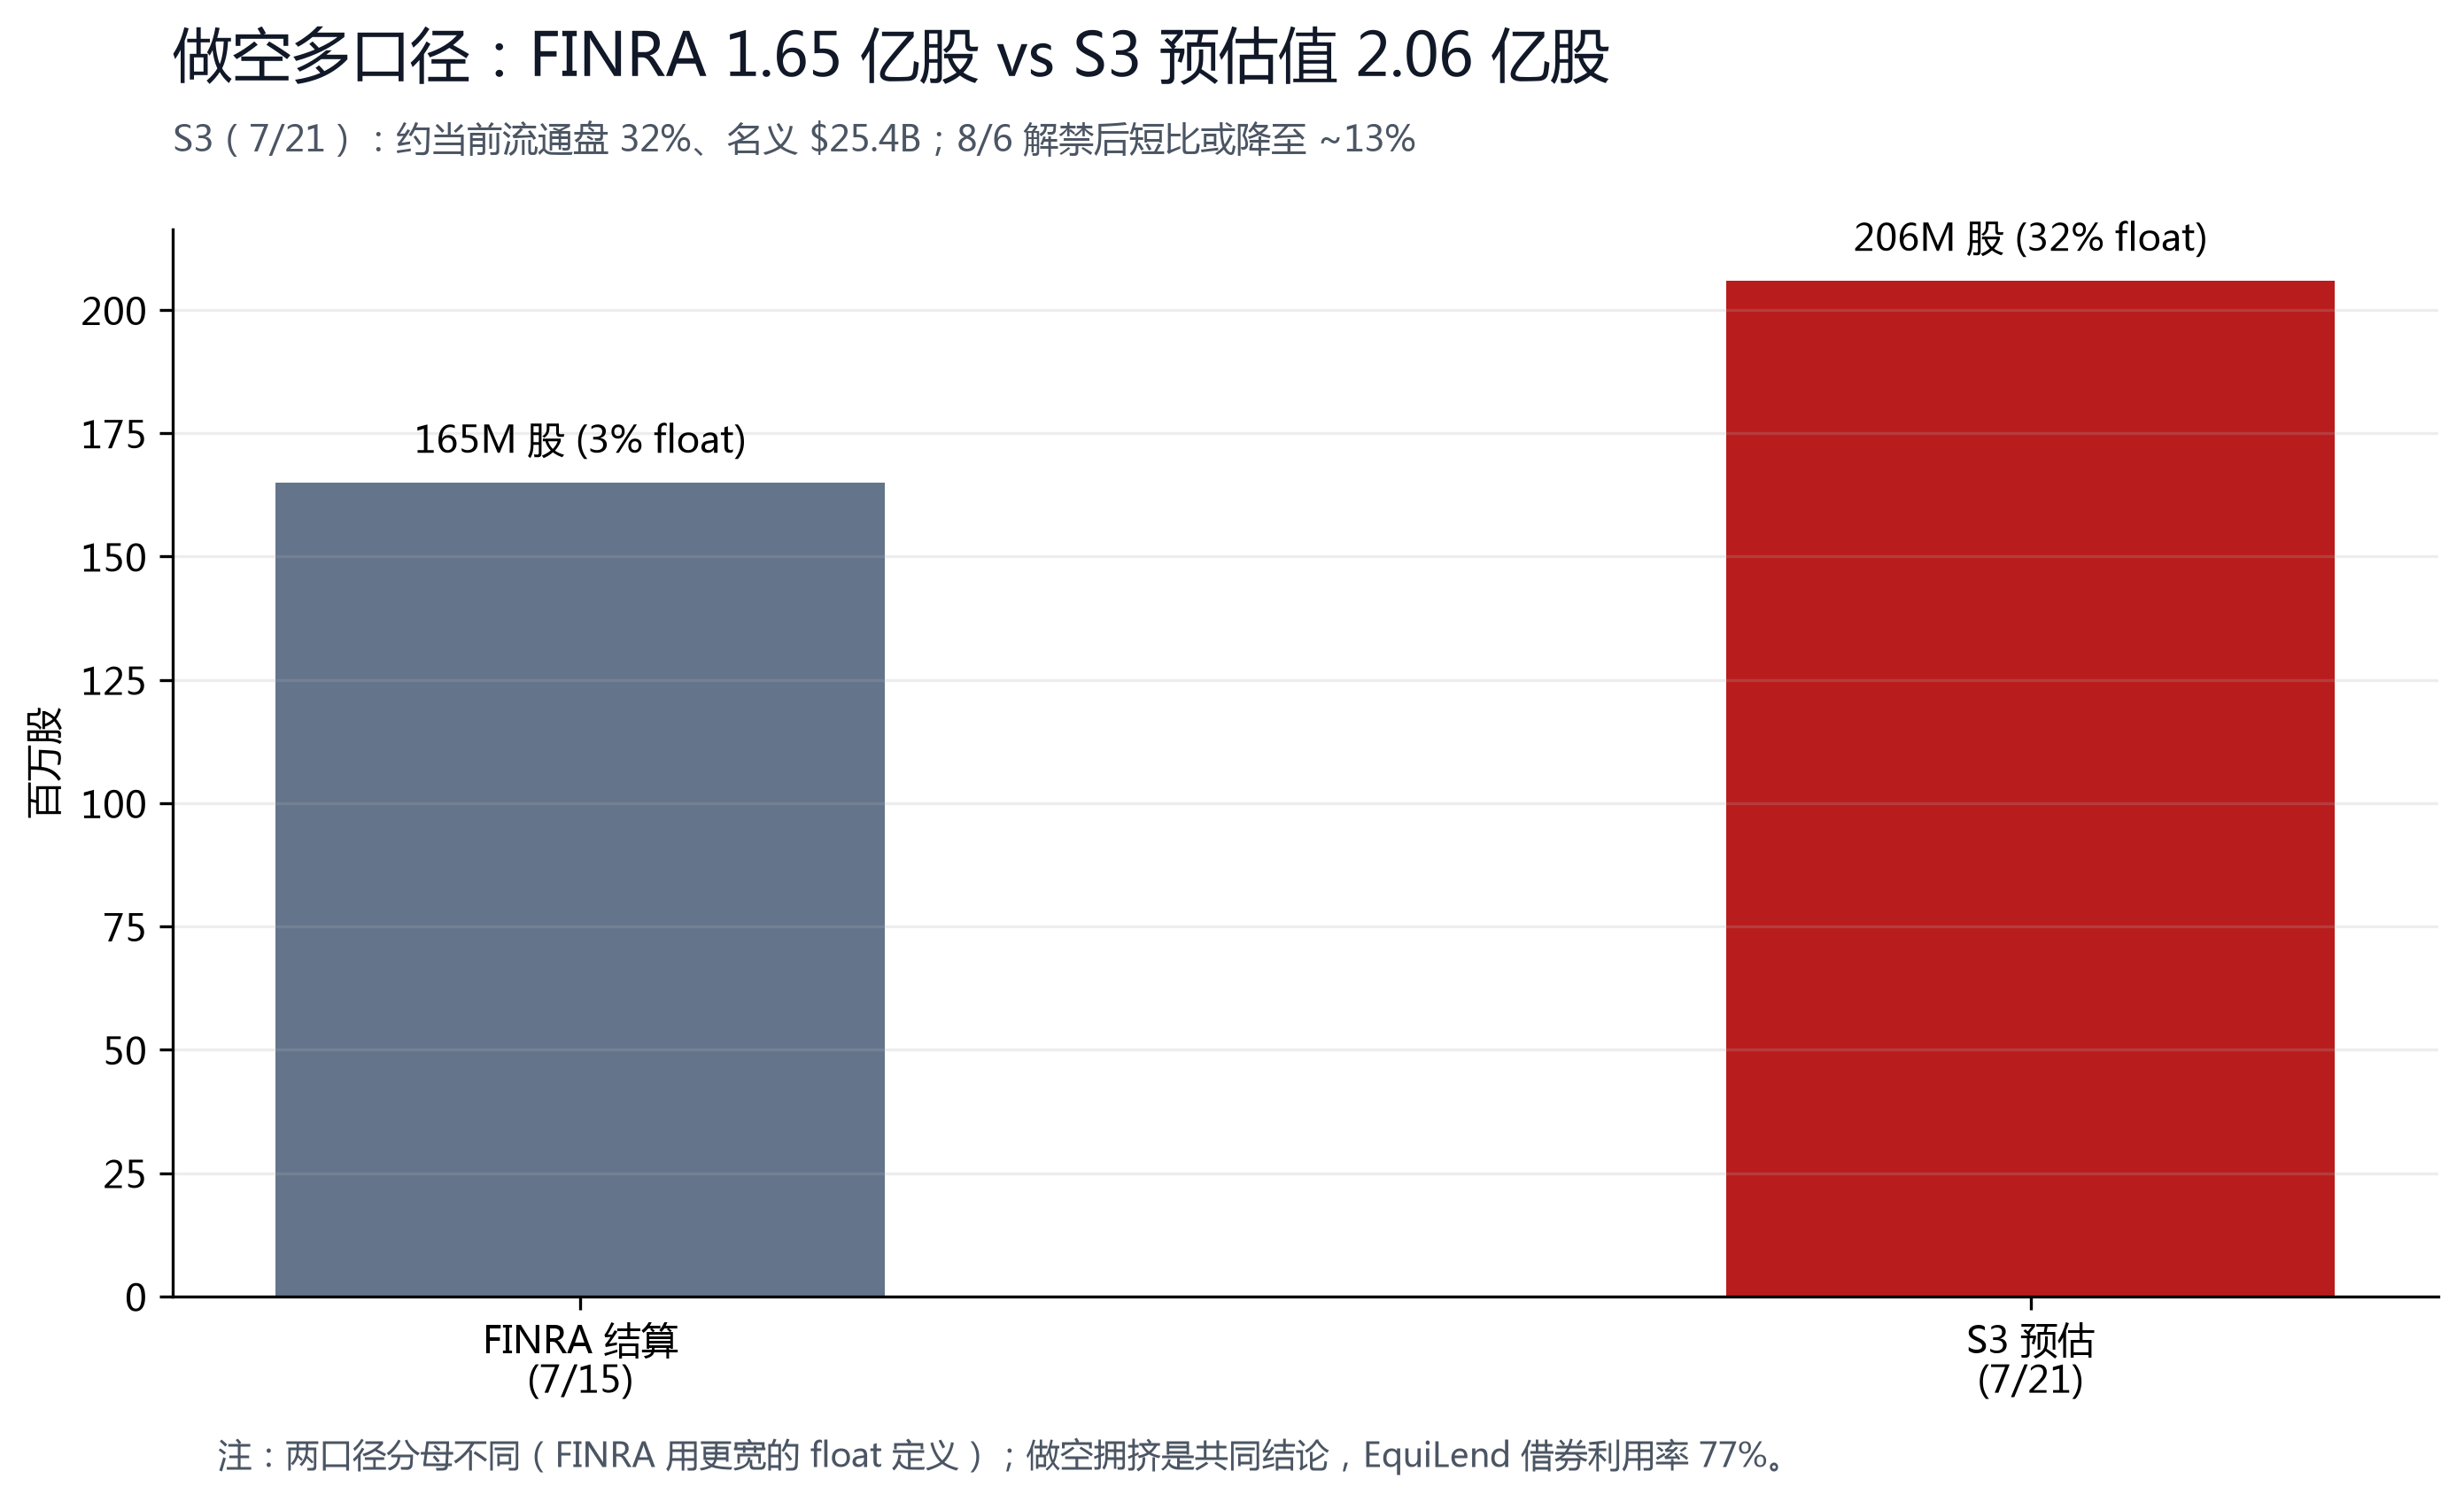
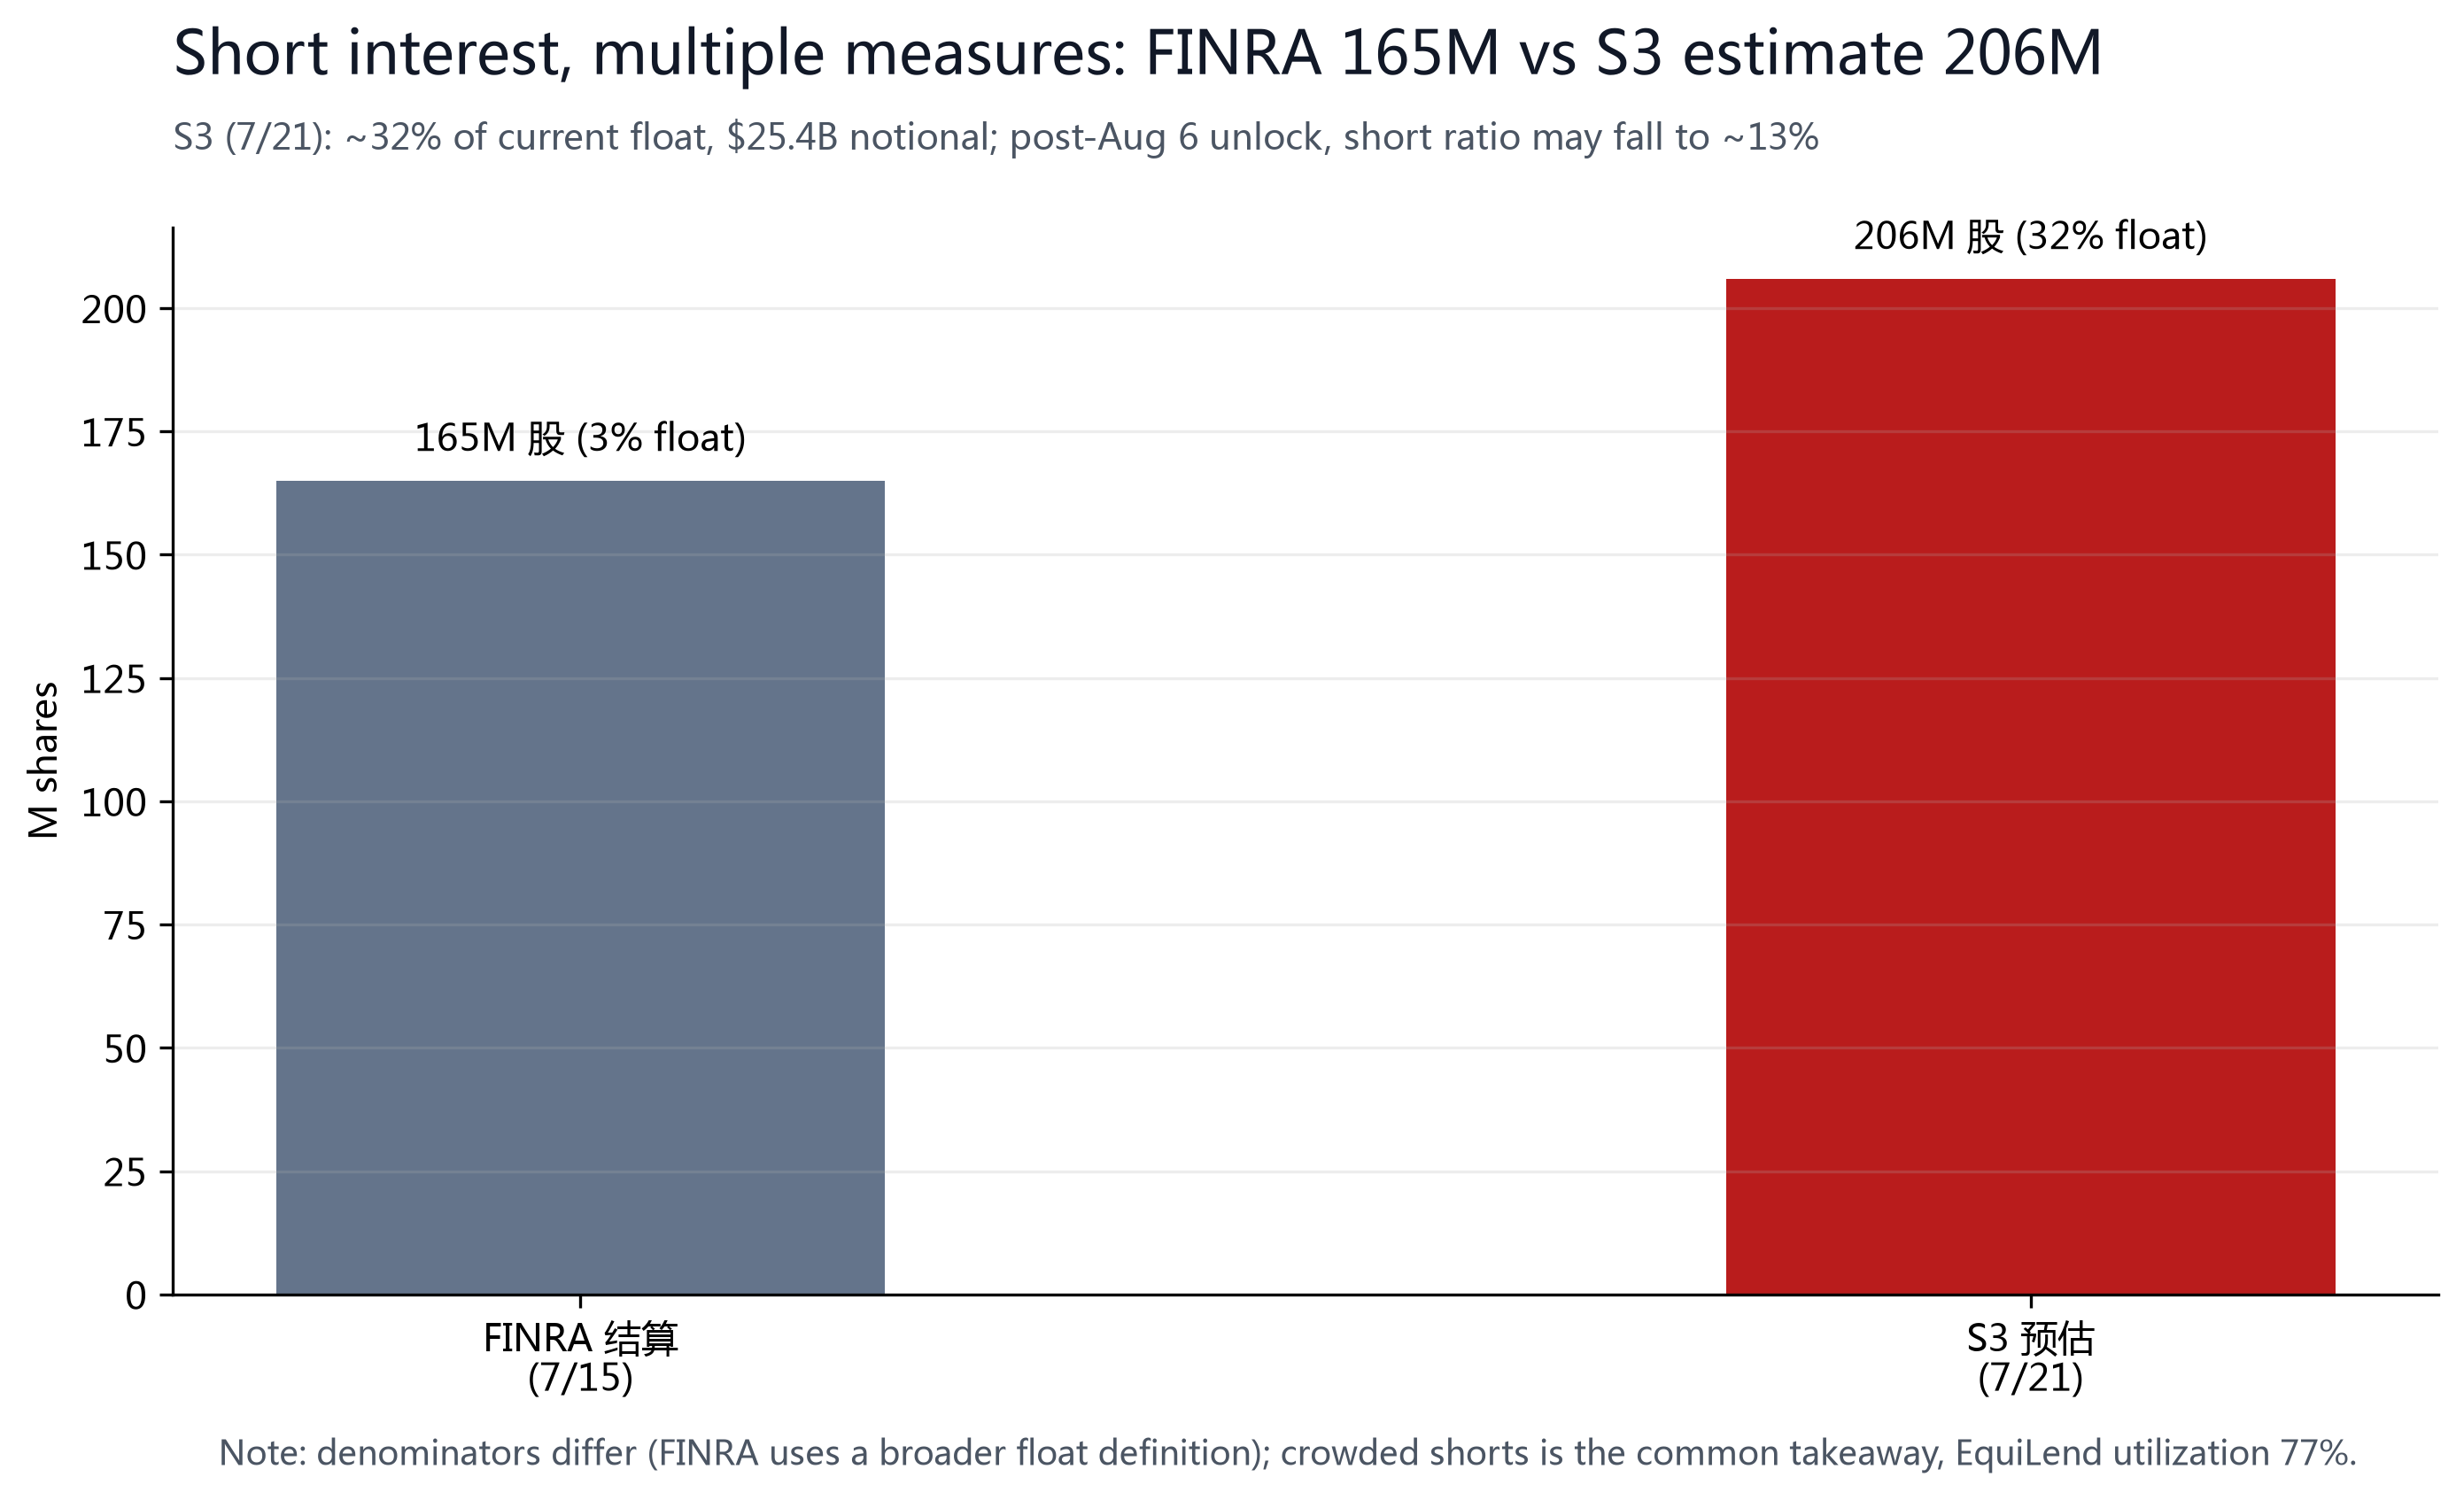
On the short side: S3 Partners estimated (Jul 21, 2026) about 206M shares short, ~32% of the current float and $25.4B notional; the FINRA settlement measure (Jul 15) is 165M shares (~2.7% of a broader float definition) — different denominators, same conclusion: crowded shorts. EquiLend borrow utilization of 77% corroborates tight supply. After the Aug 6 unlock of 911.5M shares, even without covering, the short ratio would mechanically fall to ~13% as the denominator expands. Musk said on X in late July that 'the survival probability of firms that maintain a significant short position in SpaceX over time is very low' — both sides are positioning for the post-lockup direction.
§07Valuation and Price Target
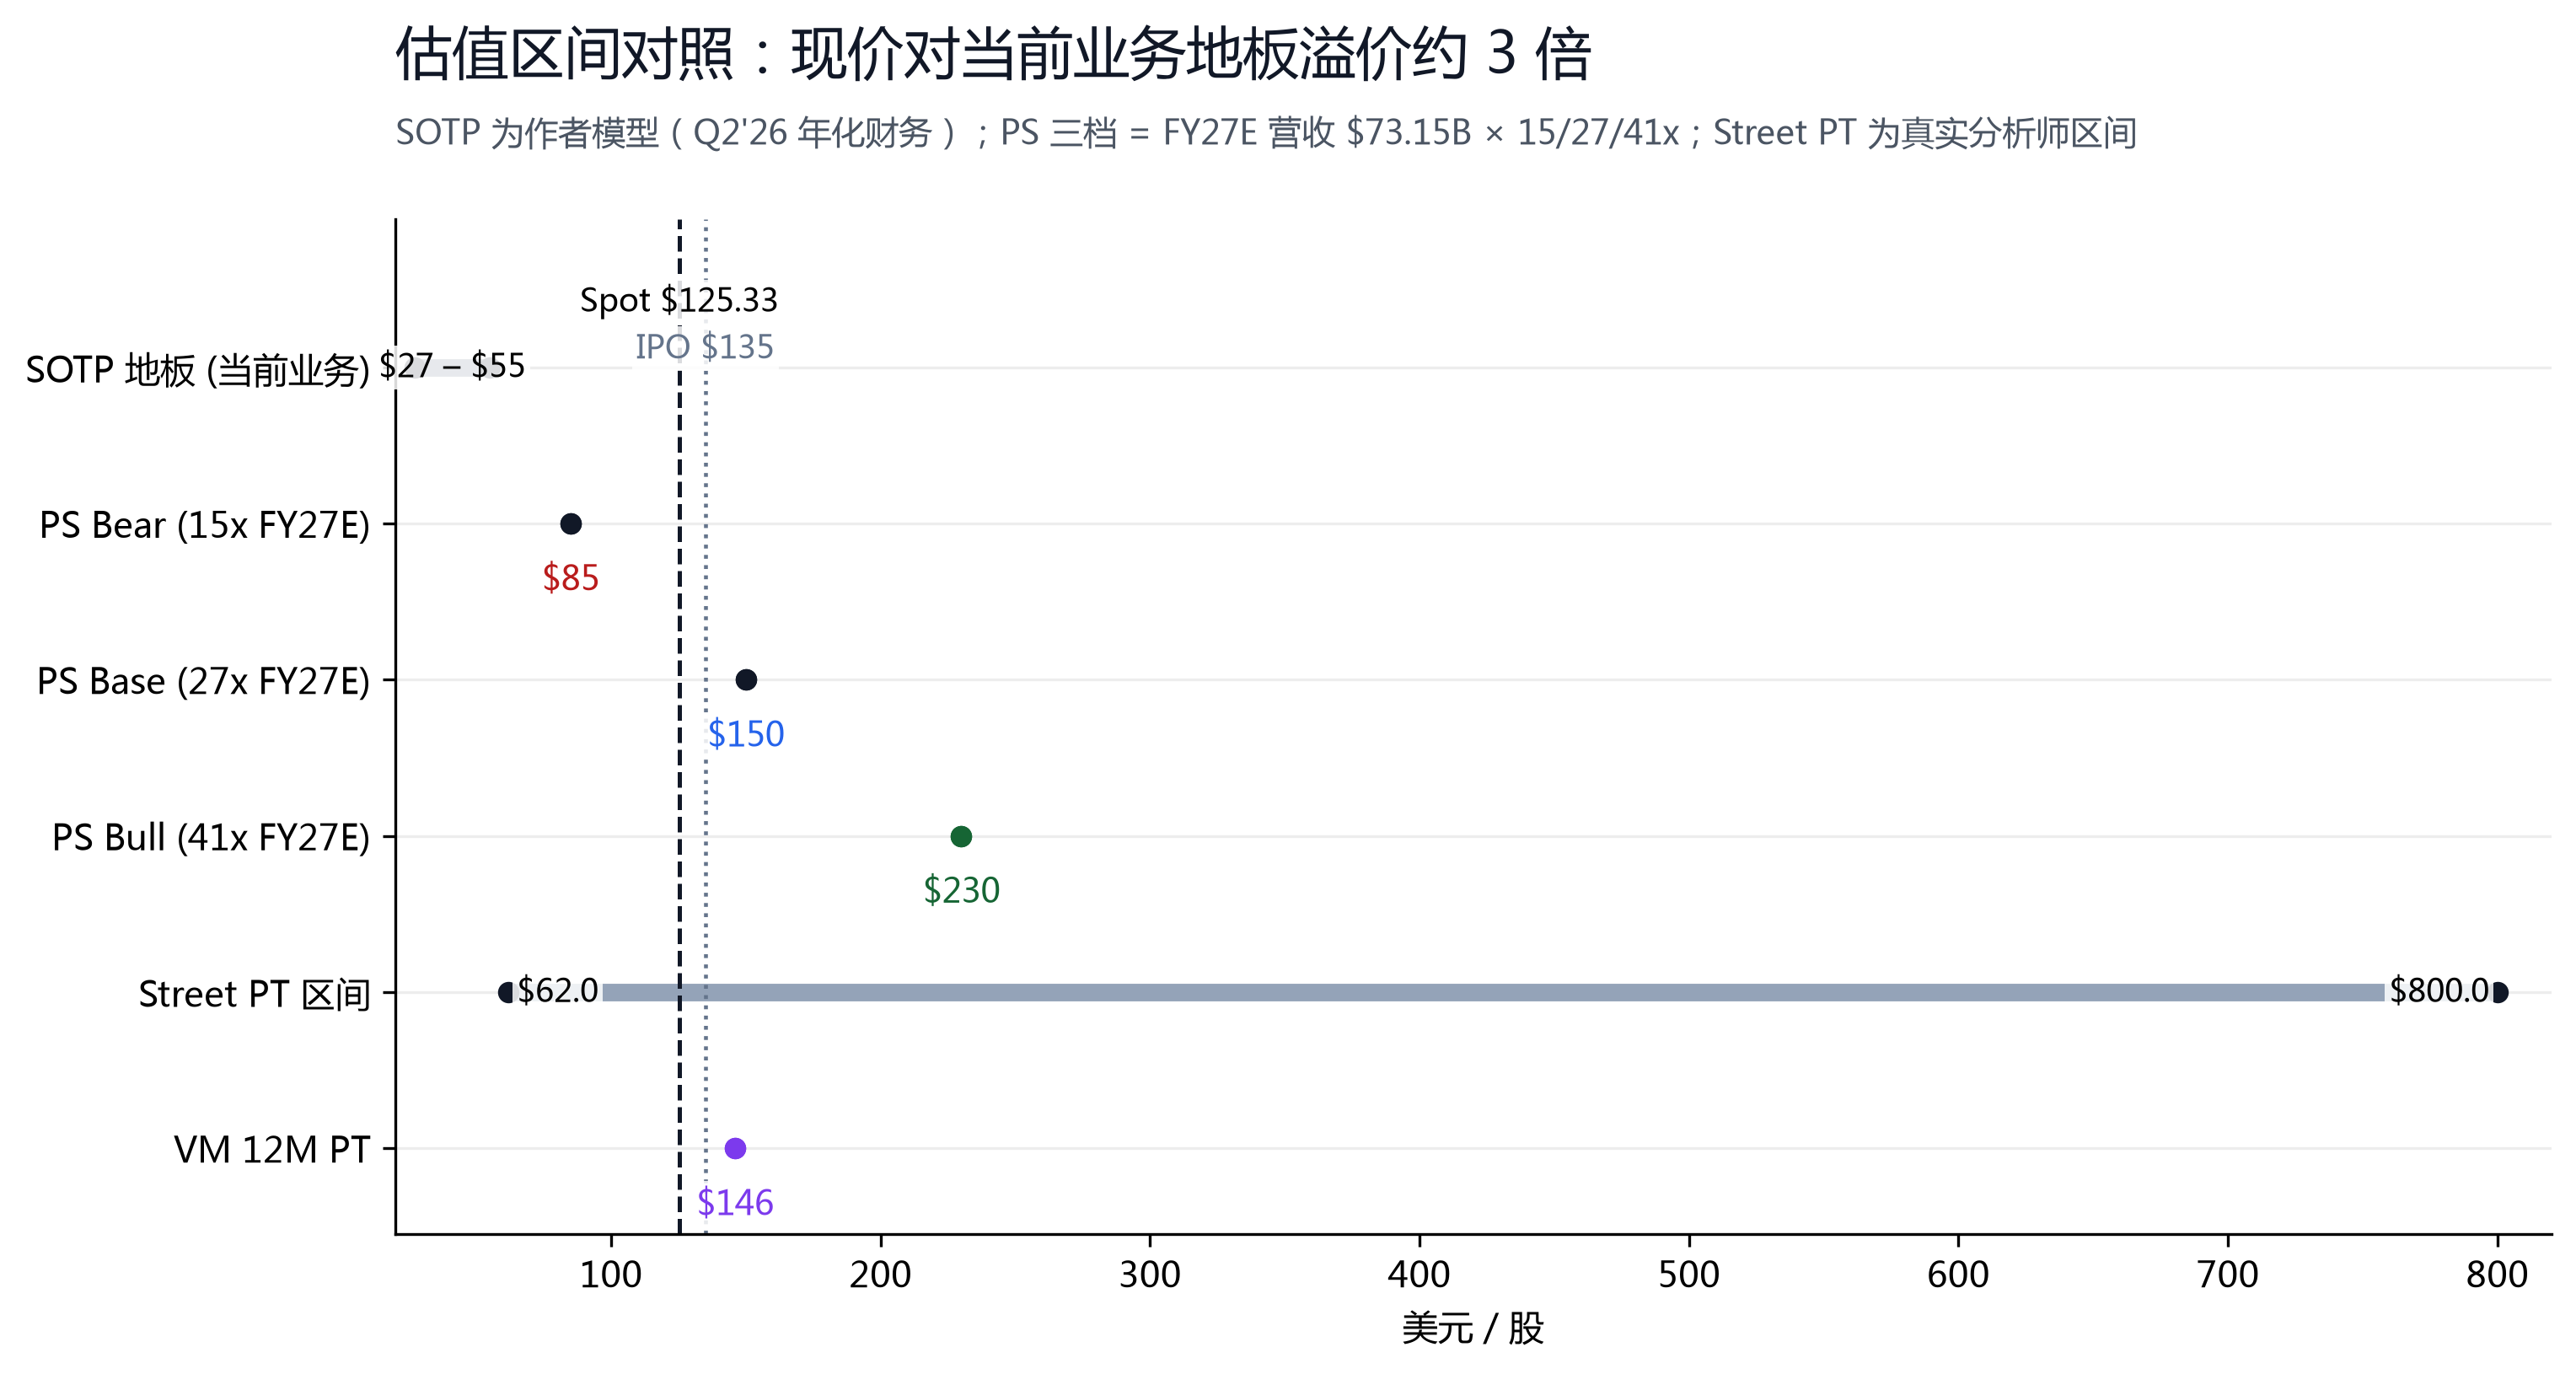
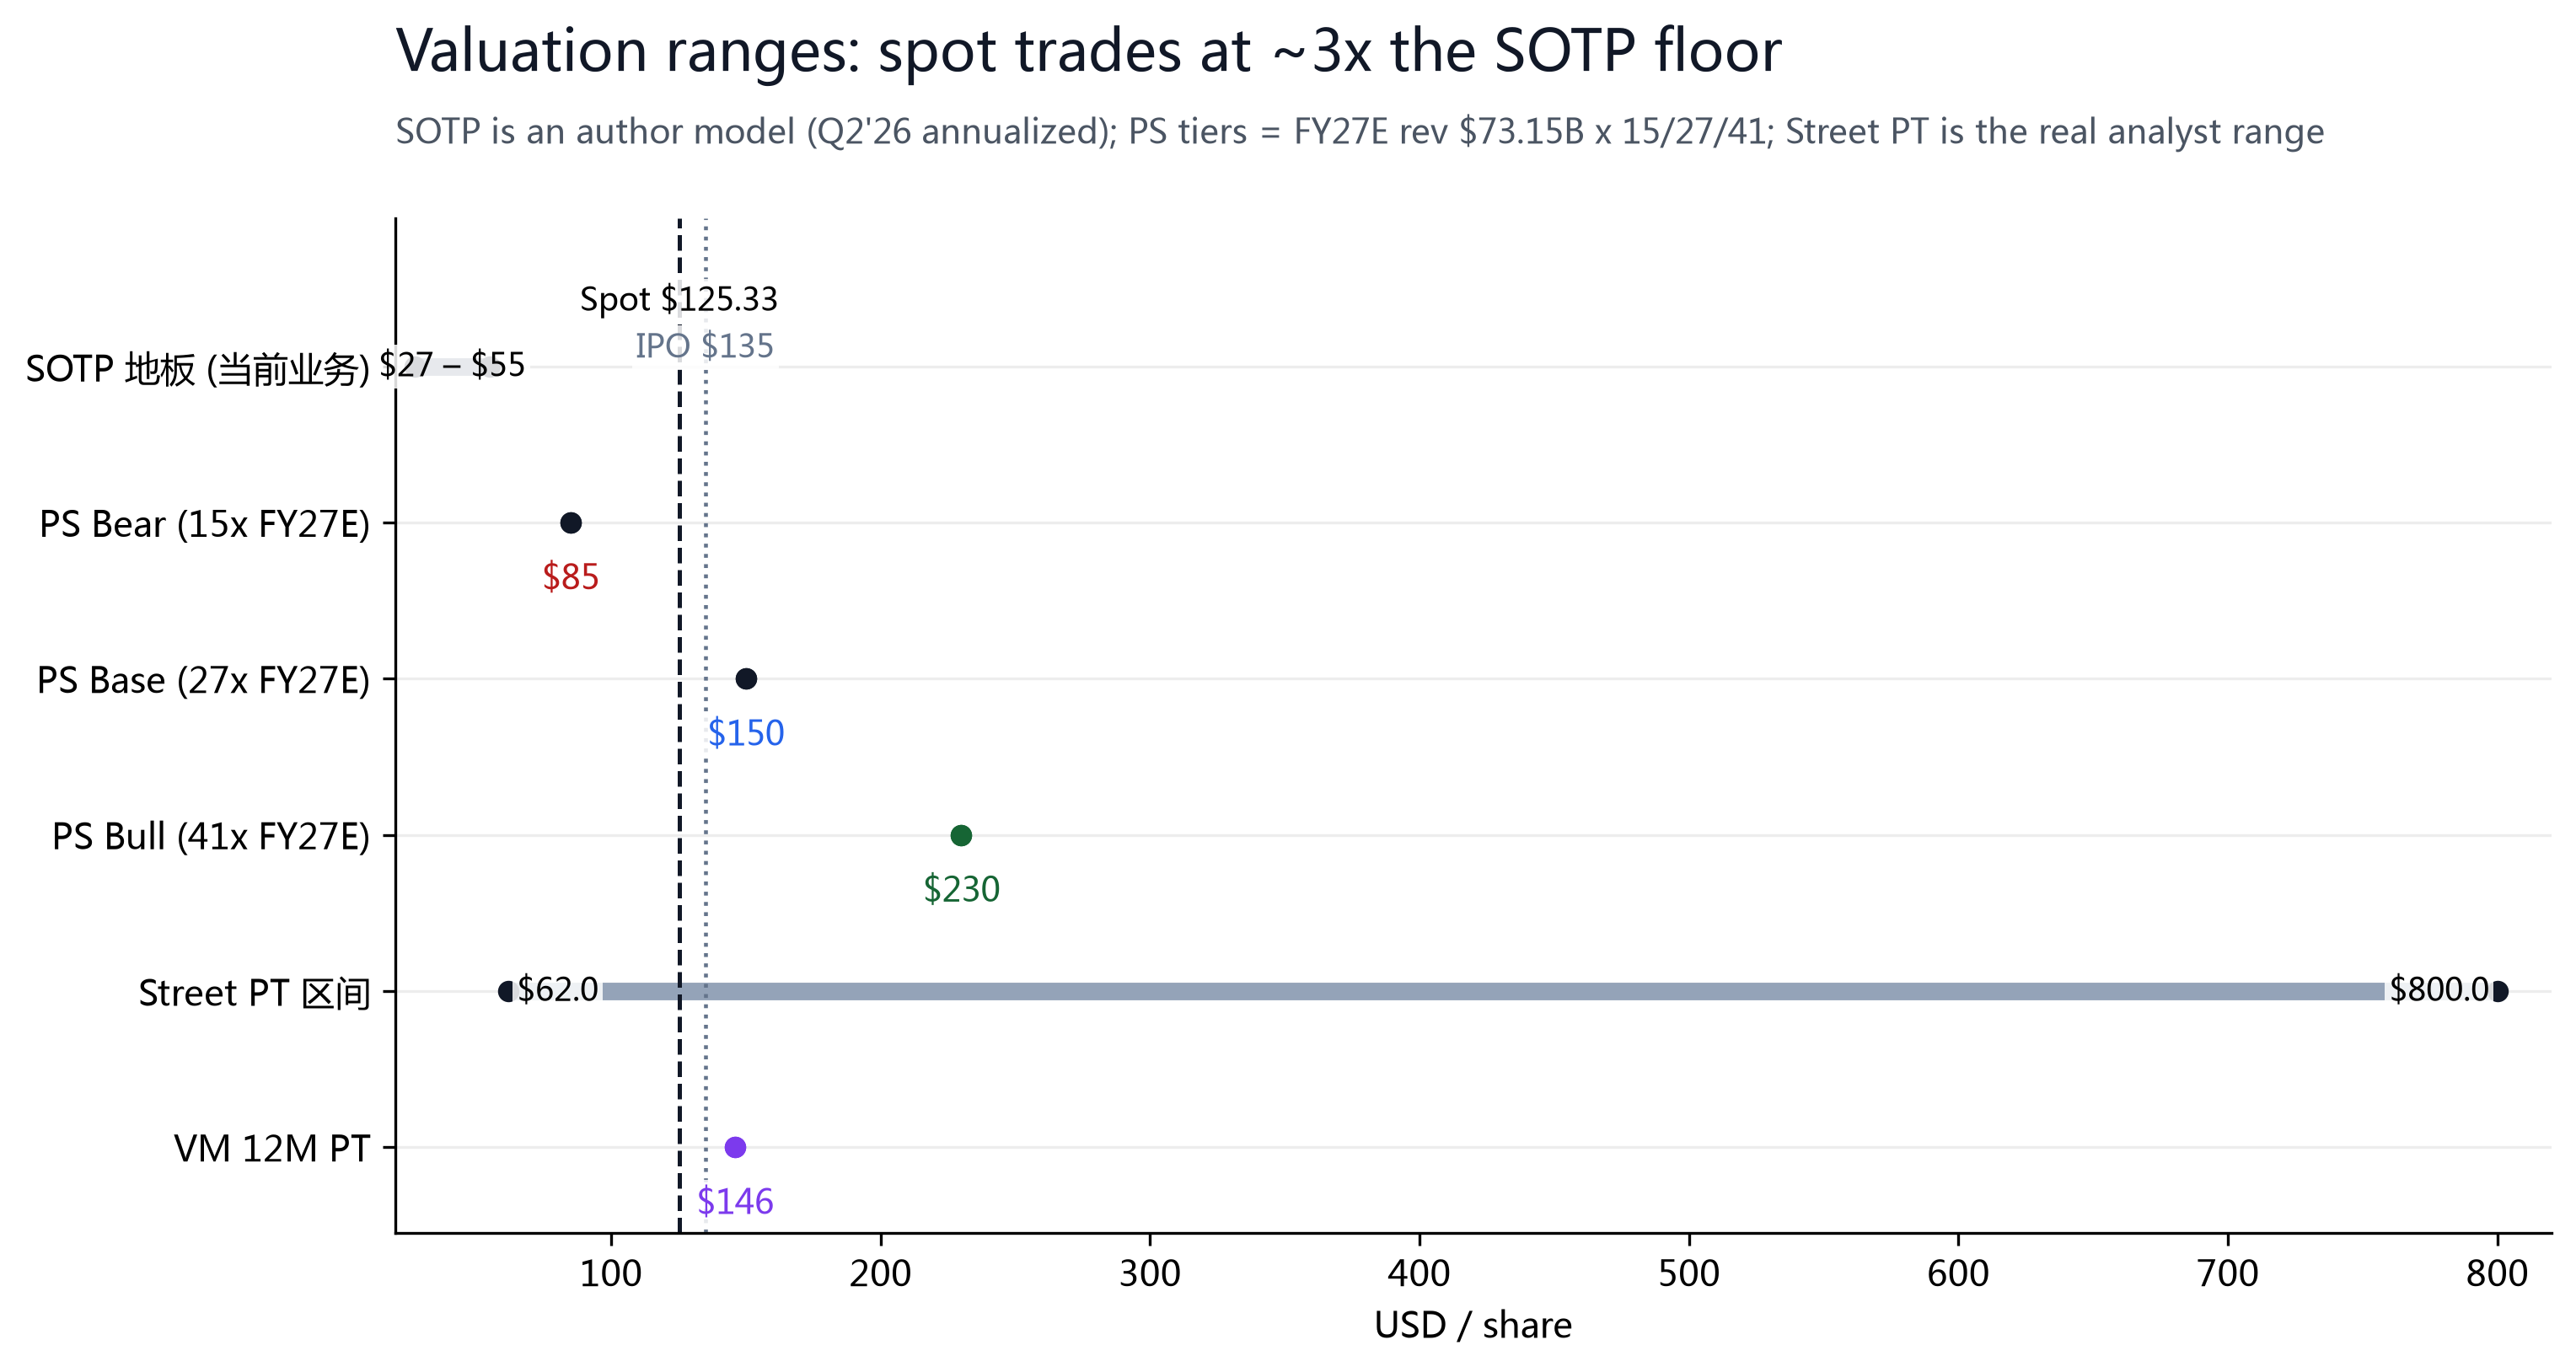
SpaceX is loss-making on a GAAP basis (Q2'26 net loss of $541M), so P/E fails; we value it on two legs: first a 'floor of current businesses' SOTP, then FY27E P/S scenario tiers for growth. SOTP floor (author model, Q2'26 annualized): Connectivity annualizing $17.2B revenue and $6.6B operating profit -> EV $140-220B (10-13x annualized revenue); Space annualizing $3.8B -> EV $20-45B; AI annualizing $10.2B revenue and $4.6B adj. EBITDA -> EV $100-250B (including 1.4GW compute and the Cursor option); Starship and orbital services option $30-150B; plus net cash of $60.6B -> equity value of $350-725B -> $27-55 per share (midpoint ~$40). Conclusion: at $125.33 (market cap $1.65T) the spot price trades at about 3x the floor of the current businesses — the market is paying heavily for 3-5 year AI and space growth, which is exactly why valuation views diverge so wildly (analyst targets span 13x, from $62 to $800).
§08Catalysts and Risks
| Date / Window | Event | Direction |
|---|---|---|
| 2026-08-06 | First unlock: ~911M shares (20% of insider holdings) sellable | Supply headwind; watch Form 4s and volume |
| 2026-08-07 / 08-12 | Payrolls / July CPI | Rate path affects long-duration growth valuations |
| Ongoing | Starship: next flight attempts tower catch + first V3 Starlink batch | Milestone positive; failure (e.g. 7/16 abort) negative |
| Late Aug | Starship: earliest catch attempt this month; catch booster+ship this year | Milestone positive; goal ~daily launches within a year |
| End 2026 | Starmind orbital AI compute (NVIDIA Vera Rubin) progress; Grok 5 launch; compute >2GW | AI narrative positive; execution & regulatory risk |
| 2027 | Artemis III crewed lunar landing (scheduled); institutional 100% unlock (Feb-Aug) | LT narrative positive; supply headwind |
| 2026 Q3 | Close $60B Cursor deal; Grok 4.5 commercialization | AI monetization and product-matrix positive |
| 2026-09-16 | FOMC (now 3.50%-3.75%, three members leaning to hike) | A break above 10Y 4.68% pressures multiples |
| Late Oct / early Nov | Q3 earnings + 28% unlock (key test: AI capex conversion) | Earnings decide the direction; supply headwind |
| 2026-12-08 | Day-180 unlock: float to ~40% | Largest supply event; or the overhang clears |
(1) Lockup supply: Aug 6-Dec 8 staggered unlocks expand the float to ~40% (1.4x current), with real insider/tax-driven selling;
(2) Deeply negative FCF: ~-$25.0B in H1'26 (calculated), -$28.4B expected by the Street for the year, no cap on AI capex (Q3/Q4 in line with Q2), $100B cash burns through in ~3 years;
(3) Mature-business deceleration: Starlink ARPU -22%, Space H1 revenue -2%, fewer H1 launches;
(4) Valuation: 42x FY26E sales is not cheap against deeply negative FCF, and the tiny float amplifies swings;
(5) Execution: Starship progress (the 7/16 abort), $60B Cursor integration, regulation (xAI operations, launch licenses);
(6) Rates: 10Y at 4.68%, a Fed hike would pressure long-duration growth;
(7) Governance: concentrated Musk narrative (40%+ voting power), Tesla-merger speculation adds uncertainty.
Upside risk: if Q3 earnings prove AI capex converts to enterprise revenue fast (the $47.5B backlog), the unlock is absorbed by fresh demand, and Starship catch milestones land, the market could re-classify SPCX from 'burner' to 'monetizer', re-rating to 35-41x FY27E PS — the $230 bull case (+84% vs spot).
§09Sources, Limits and Disclosure
- SpaceX Q2 2026 earnings release (8-K, 2026-08-04): segment revenue/op. income/adj. EBITDA/capex/launches/subscribers/ARPU/balance sheet/cash flow (SEC EDGAR)
- SpaceX Form 10-Q (period ended 2026-06-30): share counts (Class A/B), cash and debt, cash flow, MD&A
- S-1 / 424B4 prospectus: IPO at $135, lockup schedule, 2023-2025 historicals, share counts
- Price and quotes: stockanalysis.com / Longbridge / quote feed (2026-08-04); 52W range, market cap, volume
- Analyst ratings and consensus: S&P Global / TipRanks (2026-08-04, 35 analysts, avg $223, range $62-800); individual: Clear Street $217, DB $255, Bernstein $239, RBC $225, Susquehanna $170, Macquarie $250, Morgan Stanley OP $225 (SOTP), HSBC Hold ~$115
- Lockup calendar: 424B4 / Nasdaq.com / tesorb (20% from 2026-08-06, float ~40% after 12/8)
- Short interest: FINRA (7/15 settlement 165M) / S3 Partners (7/21 estimate 206M, ~32% of float) / EquiLend (borrow utilization 77%)
- Macro and market: Jin10 / Wall Street CN / ATB Weekly (2026-08-04): 10Y 4.68%, Fed 3.50%-3.75%, MSFT/AMZN/META post-earnings divergence
Limitations: spot is the 2026-08-04 close (after-hours $115.98 moved on earnings); Beta has no reliable source (n/a); options IV term structure, 13F institutional holdings (not yet filed in the first post-IPO quarter) and insider Form 4s (no material filings before the unlock) are marked DATA UNAVAILABLE; the SOTP floor, three P/S tiers and the net-cash add-back are author models; H1'26 FCF (-$25.0B) and Q1'26 net loss (-$4,276M) are derived, not company-disclosed; short-interest ratios use two different denominators (FINRA 1.3%-2.7% vs S3 32%); FY2026E/FY2027E revenue and EPS are S&P Global consensus. This report is not investment advice.