Palantir Technologies Inc.NASDAQ:PLTR
Published 2026-08-05, with market data as of the 2026-08-04 close. Financials are sourced from Palantir's Q2 2026 report (issued after market close on 2026-08-03) and public filings.
Palantir crushed the bears with a report that beat across the board and raised guidance sharply: Q2'26 revenue of $1,935M (+93% YoY), GAAP net income of $1,062M (+225%, per 10-Q), EPS of $0.41 (a 17.1% beat); U.S. commercial revenue of $764M (+149%) and U.S. commercial RDV of $6.24B (+124%). Management raised FY26 revenue guidance from $7.65B to $8.15-8.16B (+82%), and CEO Alex Karp said the momentum 'looks set to last at least 18 months.' On August 4 the stock soared 29.45% to close at $162.66 in an epic short squeeze (shorts marked-to-market losses of ~$3B in a day), its biggest single-day gain since February 2024.
But we caution: the stock got more expensive after the surge — about 47.9x FY26E sales and 139x trailing GAAP EPS ($1.17), a valuation that assumes 80-90%+ growth with little room for error. We rate PLTR Buy with Medium conviction and a 12-month target of $180 (+10.7% vs spot): U.S. commercial growth of +149% and U.S. commercial RDV +124% are real (sovereign AI plus the AIP Evolve product line), but weak international growth (19% of revenue, +33.7%), the 139x P/E, and the potential disruptive threat of large models (OpenAI/Anthropic) on the application layer cap the upside.
§01Investment Summary
Palantir's Q2'26 report settled the debate over whether enterprise AI has crossed the pilot phase: revenue +93%, U.S. commercial +149%, U.S. commercial RDV +124%, guidance raised by $0.5B — hard proof that its AIP platform is converting large models into auditable, executable production actions (the 'last mile from model to business value'). The single-day +29.45% on August 4 was both a fundamental re-rating and a mechanical short squeeze (shorts went from ~$2.7B paper gains to ~$3B paper losses in a day). We cross-check three FY26E-revenue P/S scenarios (35/53/68x) to a probability-weighted 12-month target of $180.
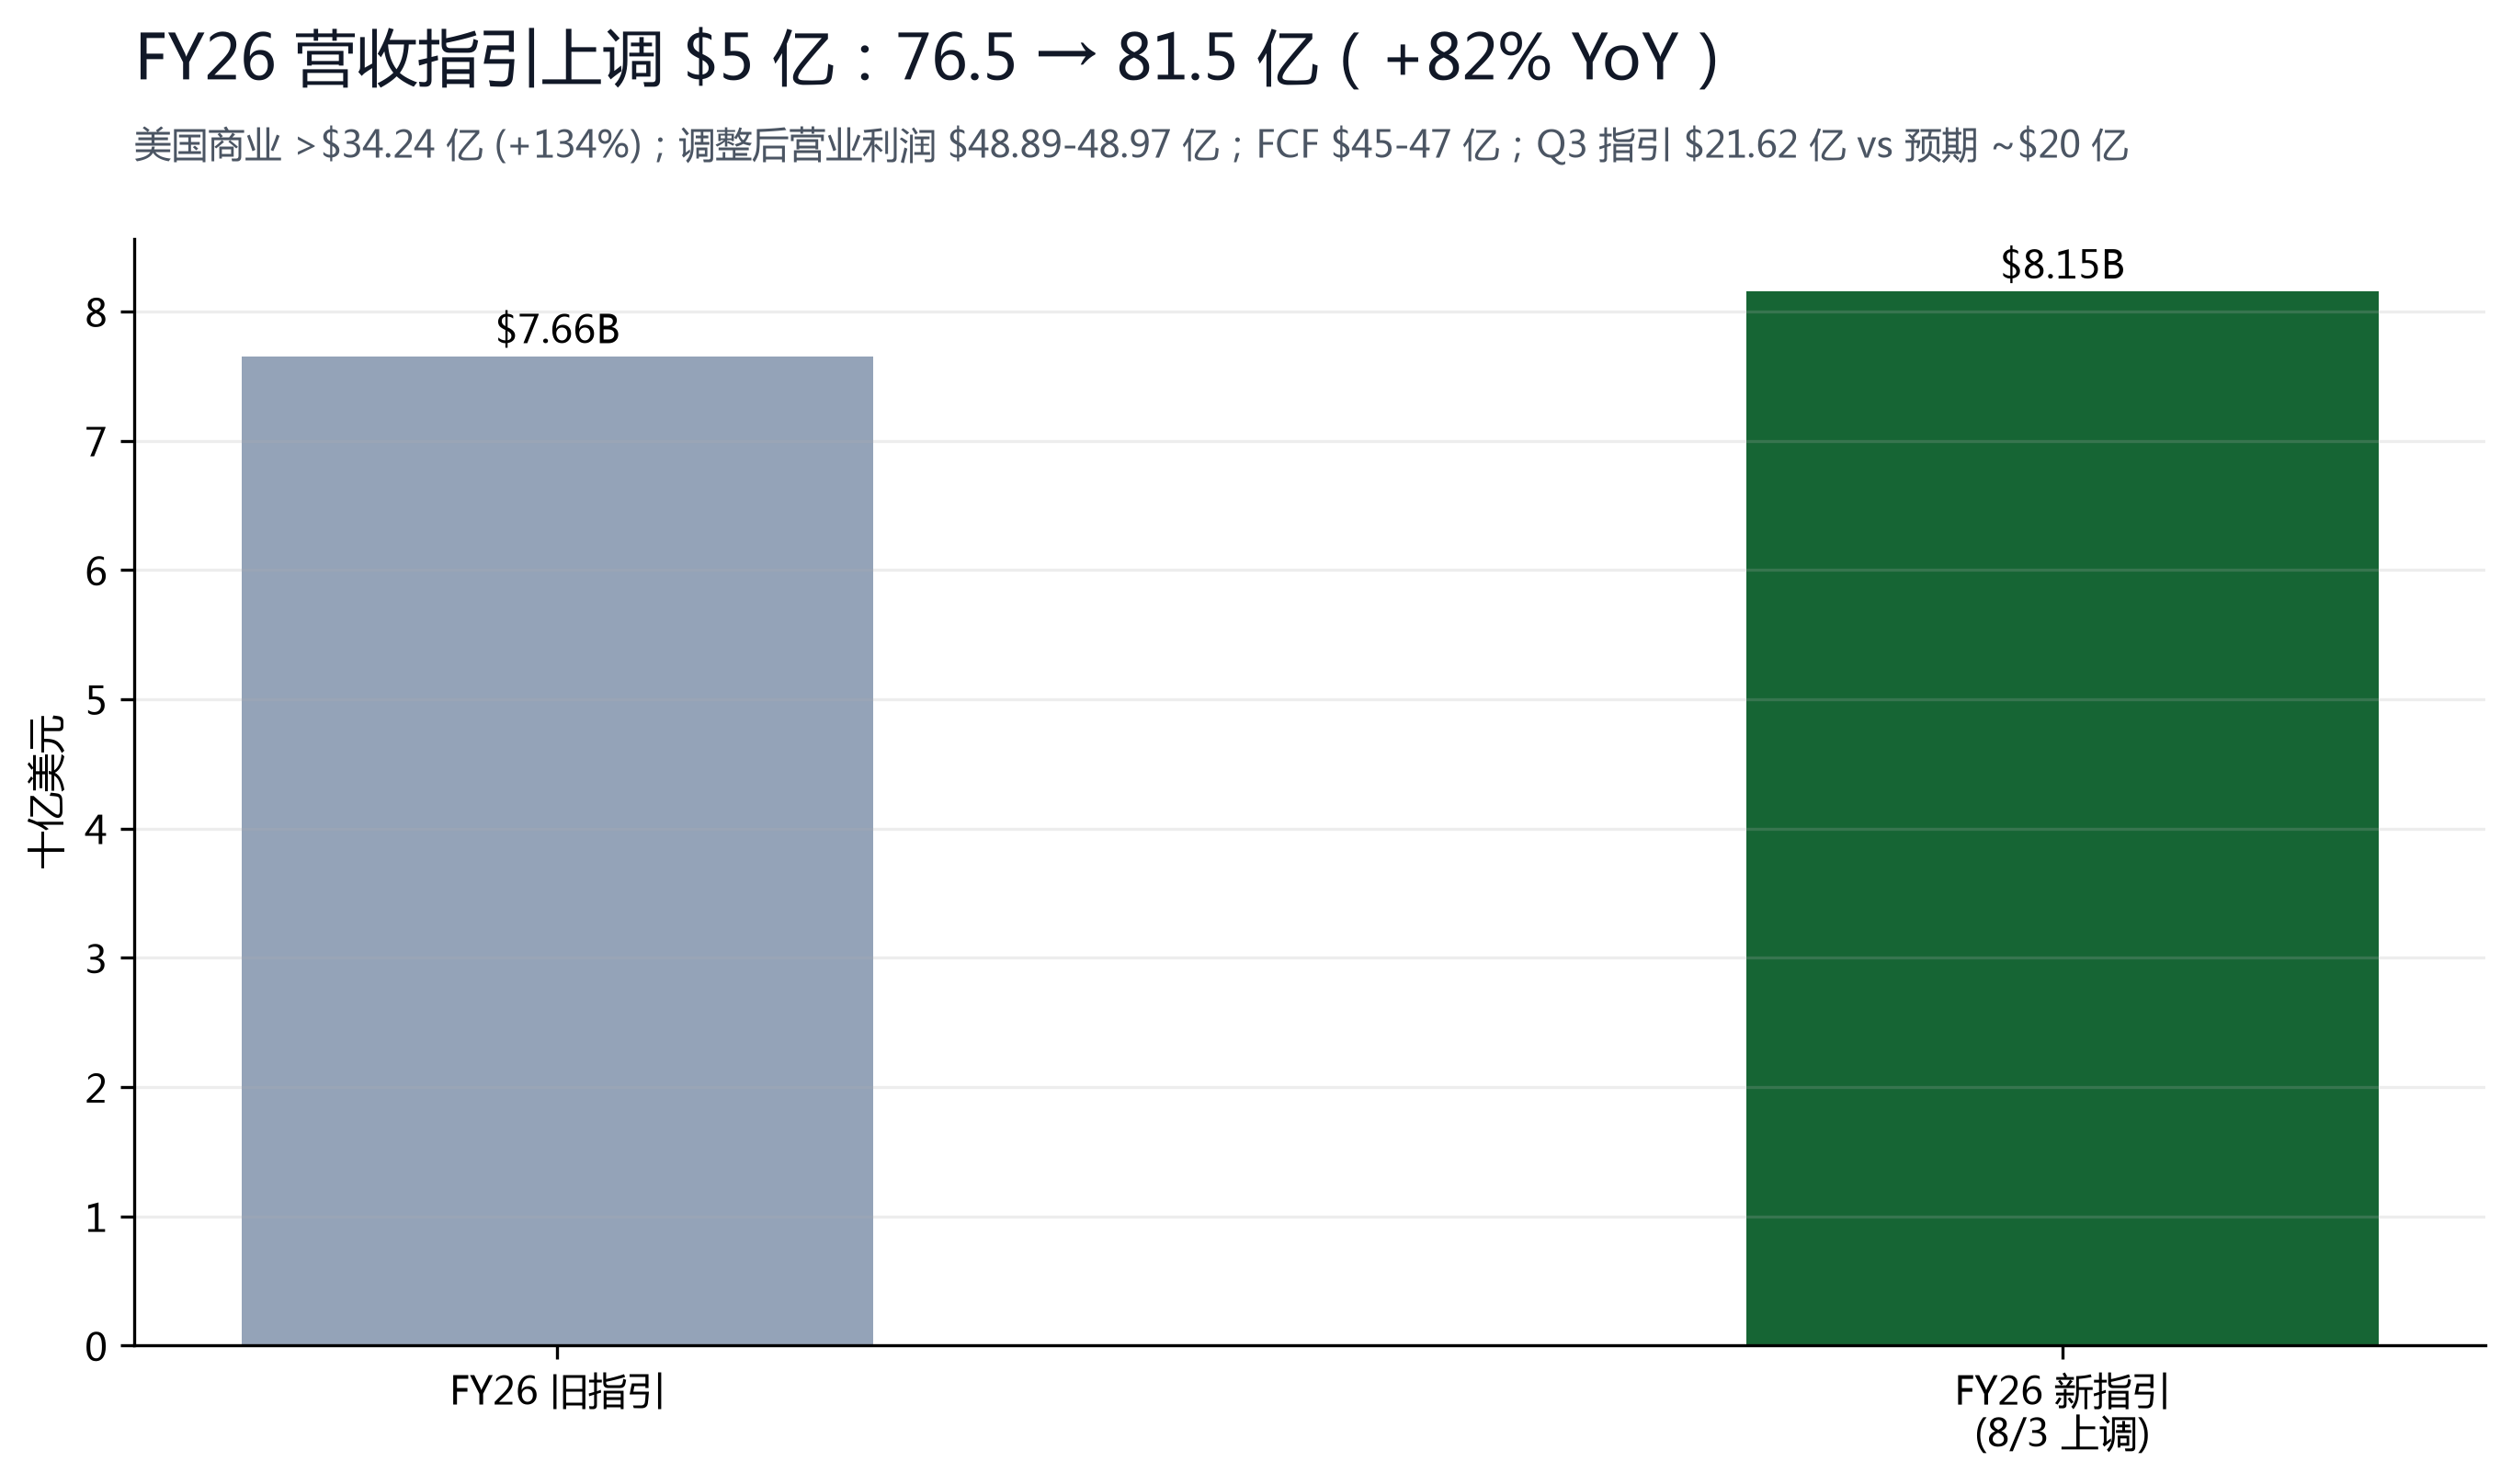
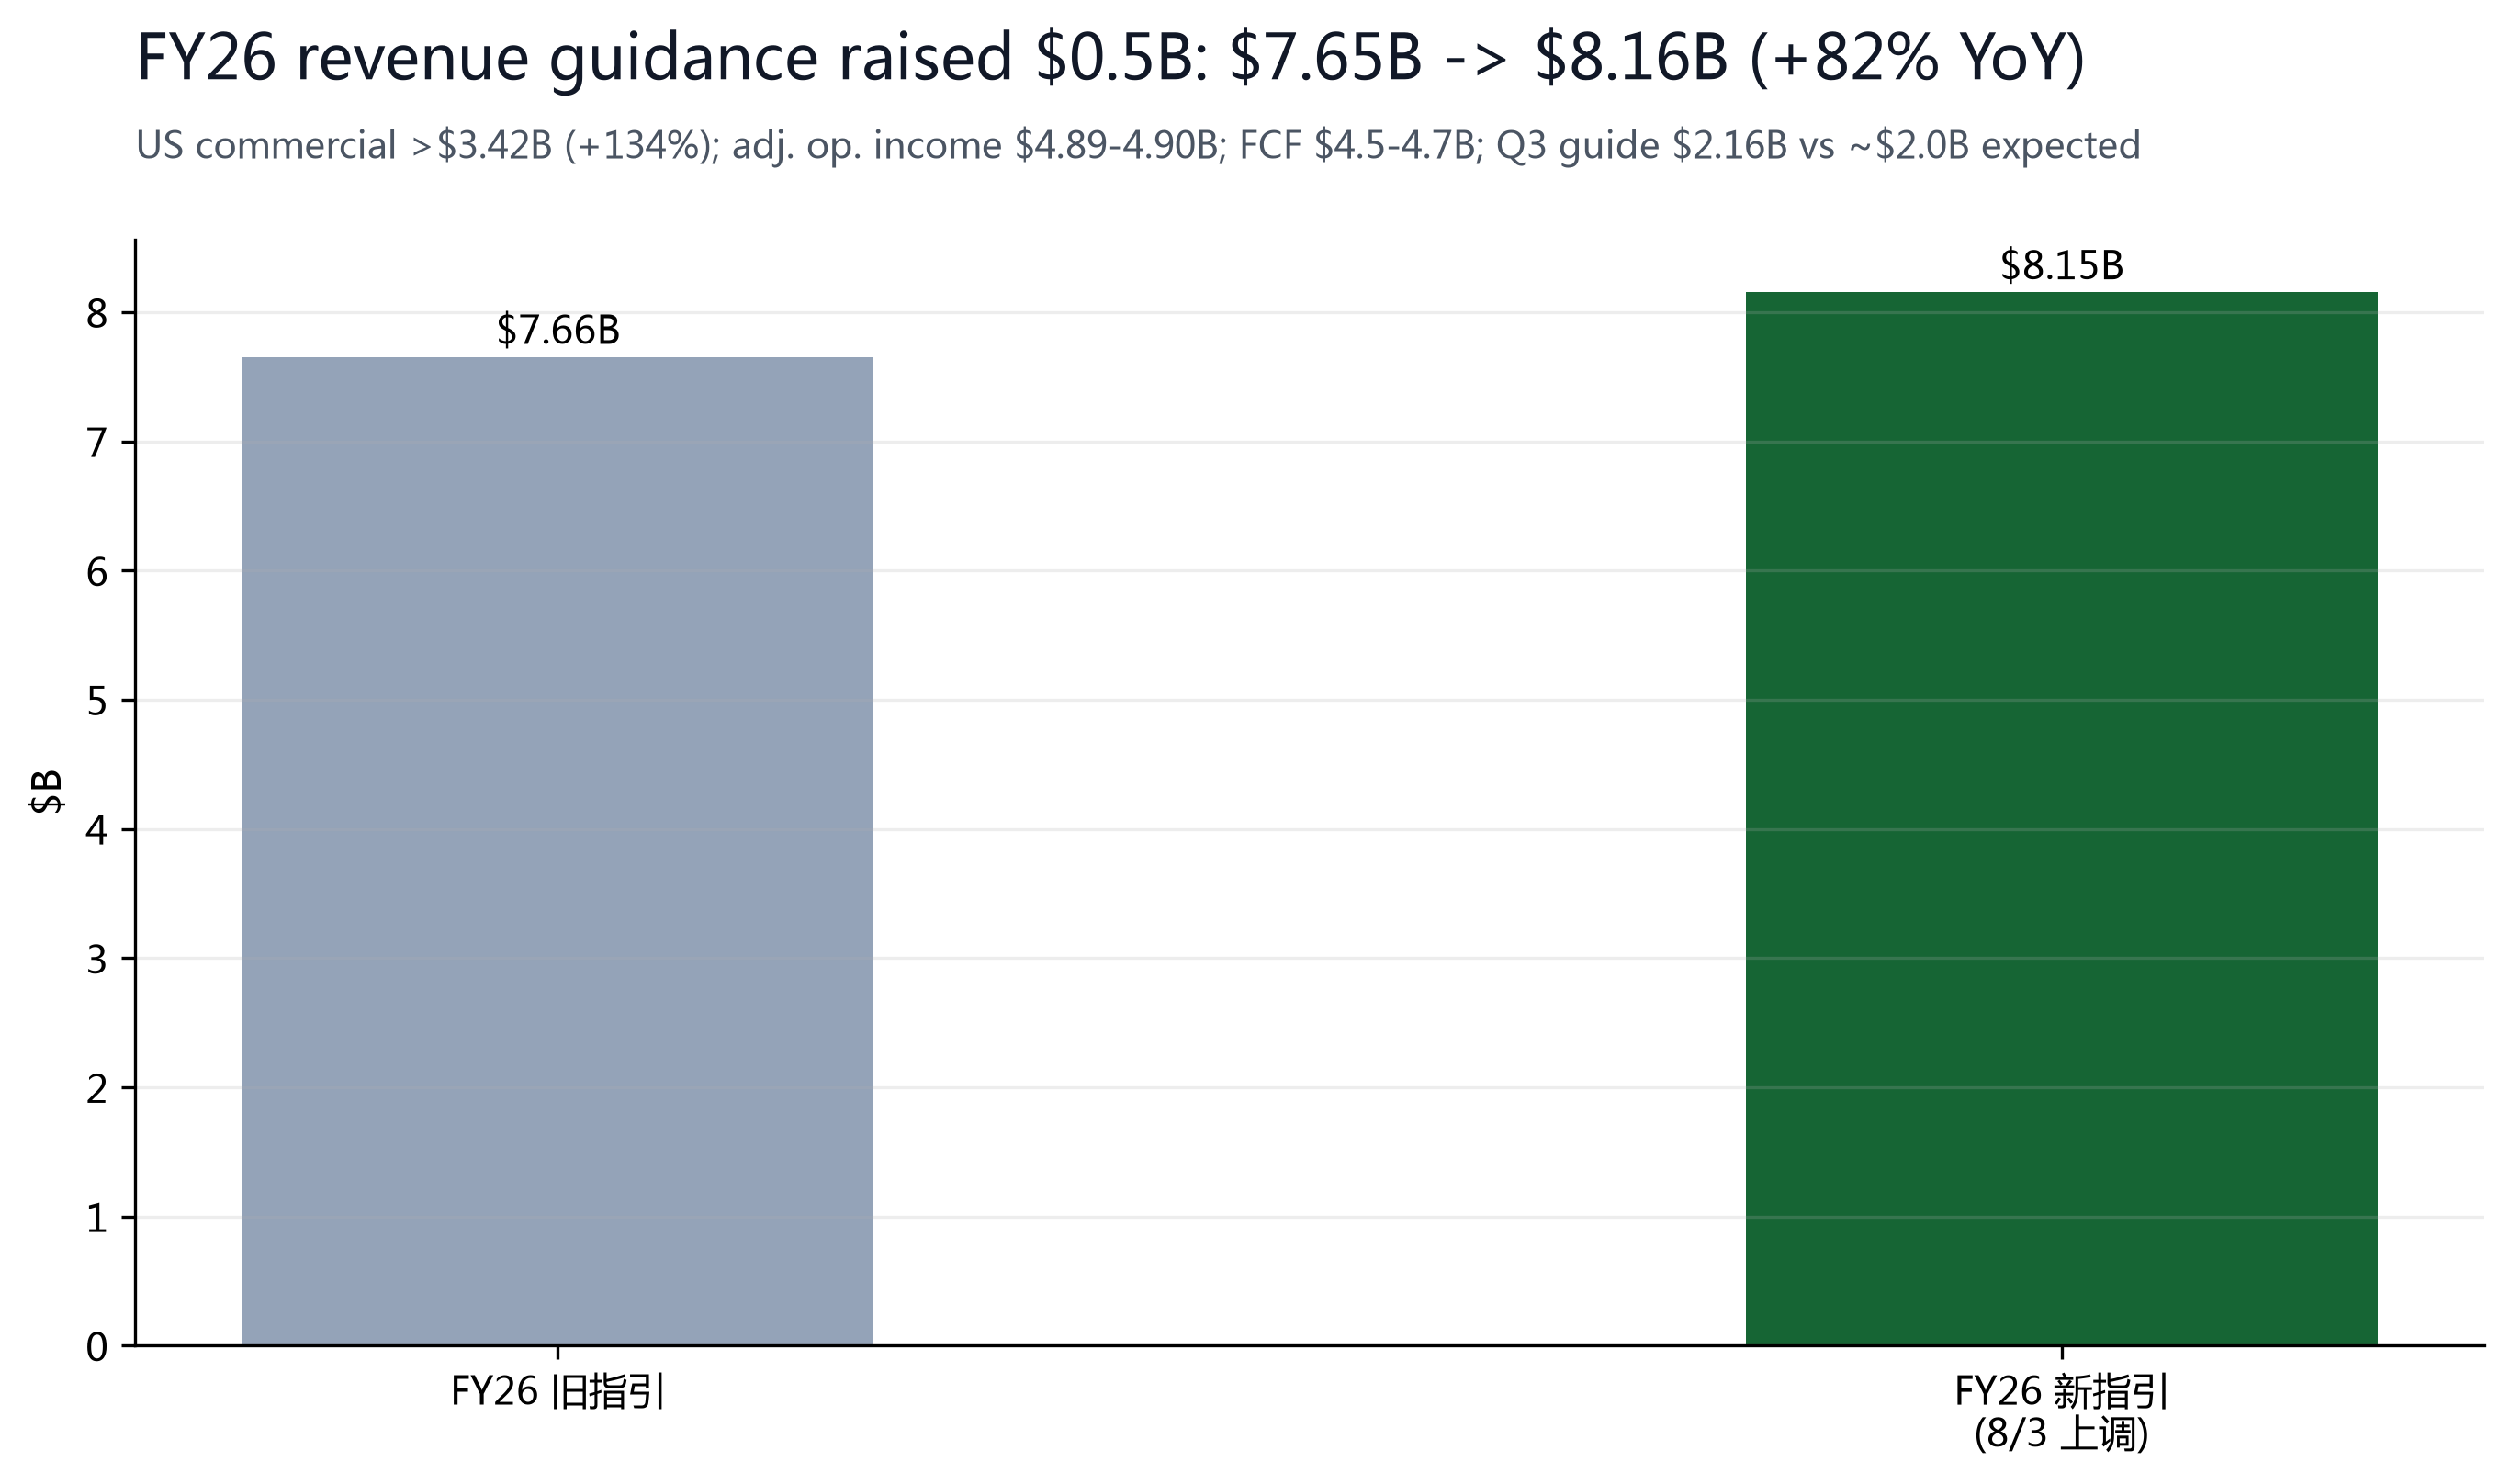
Three reasons to Buy: (1) Q2'26 beat across the board and FY26 guidance was raised by $0.5B (+82%), with Q3 guidance of $2.16B well above the ~$2.0B expected; (2) U.S. commercial +149% and U.S. commercial RDV of $6.24B (+124%), with sovereign AI (customers own and control data/models/infra) and AIP Evolve (AI agents optimizing compute cost) forming a differentiated product story, and the CEO saying momentum lasts at least 18 months; (3) crowded shorts (pre-earnings paper gains of $2.7B) have already suffered one squeeze, and the fundamentals-driven re-rating may continue.
Three key risks: (1) extreme valuation — 139x trailing P/E and 47.9x FY26E P/S embed 80-90%+ sustained growth; any U.S. slowdown or international disappointment triggers a double de-rate; (2) international is only ~19% of revenue (10-Q, +33.7%) and growing weakly, with monetization scale unproven; (3) OpenAI/Anthropic and other model labs pushing down the stack could erode AIP's differentiation (Benchmark's Hold is built on this doubt). This is also why we set $180, below the $188.83 consensus.
§02Price and Street View
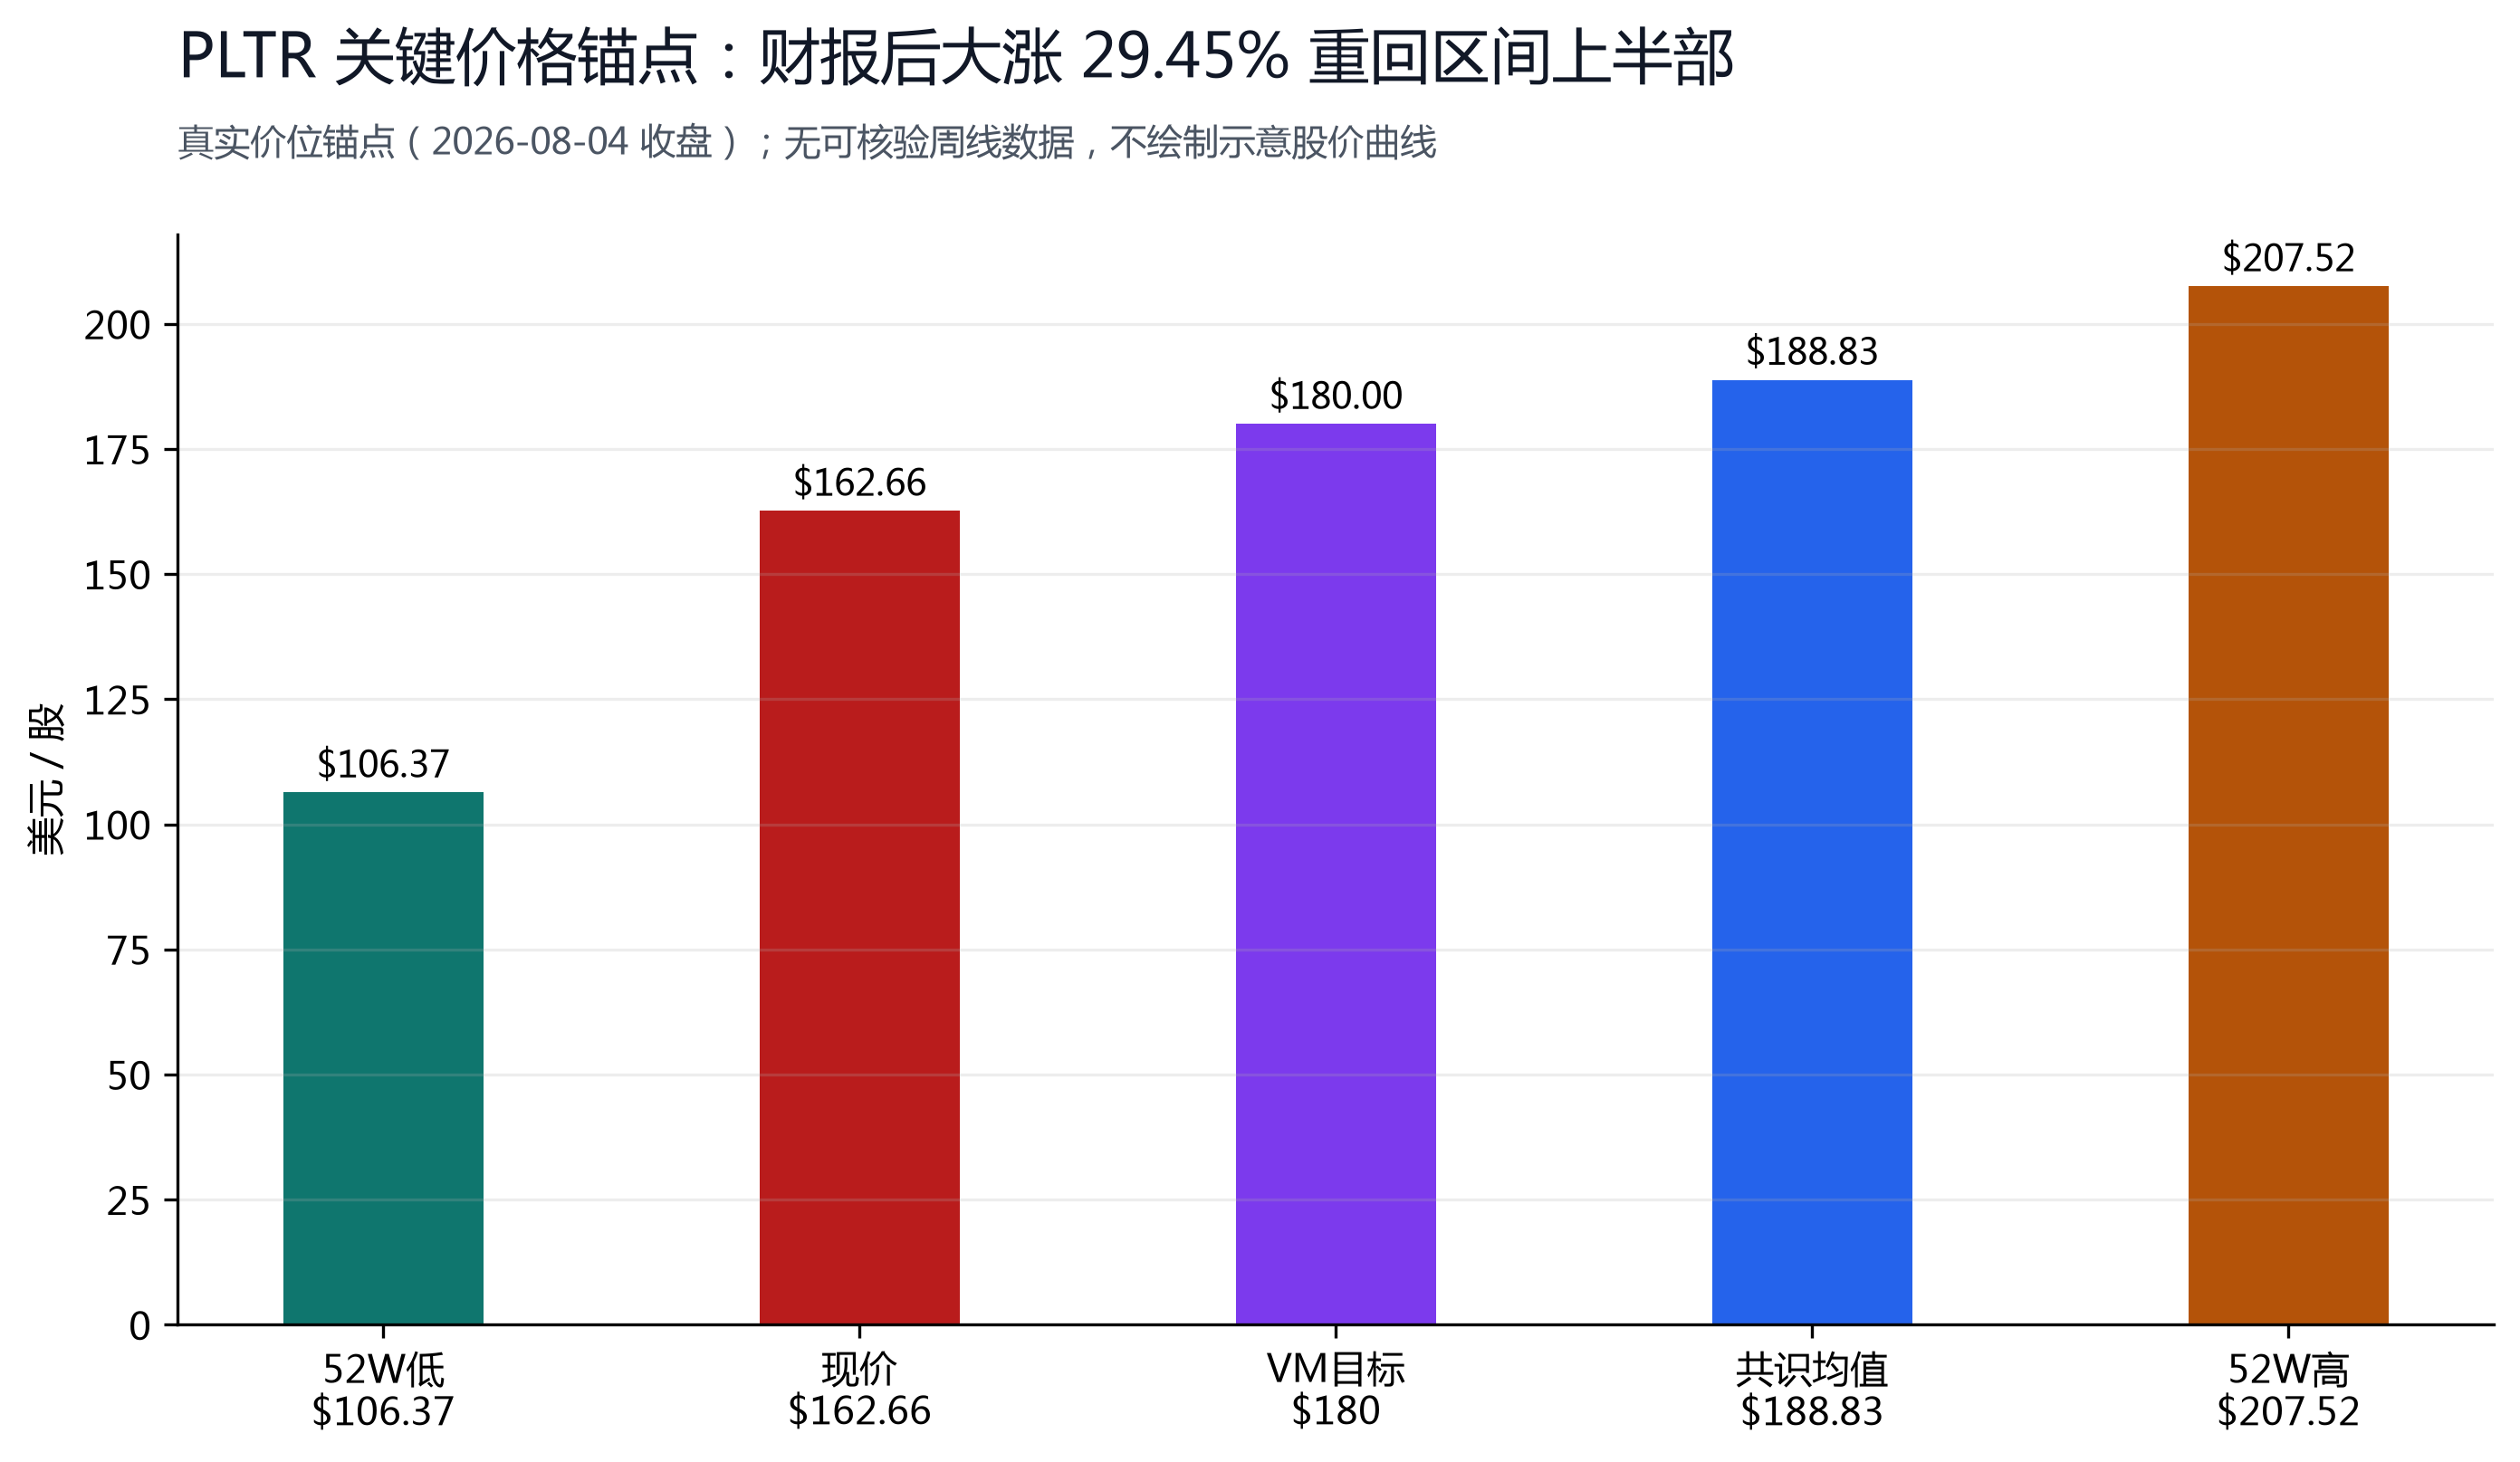
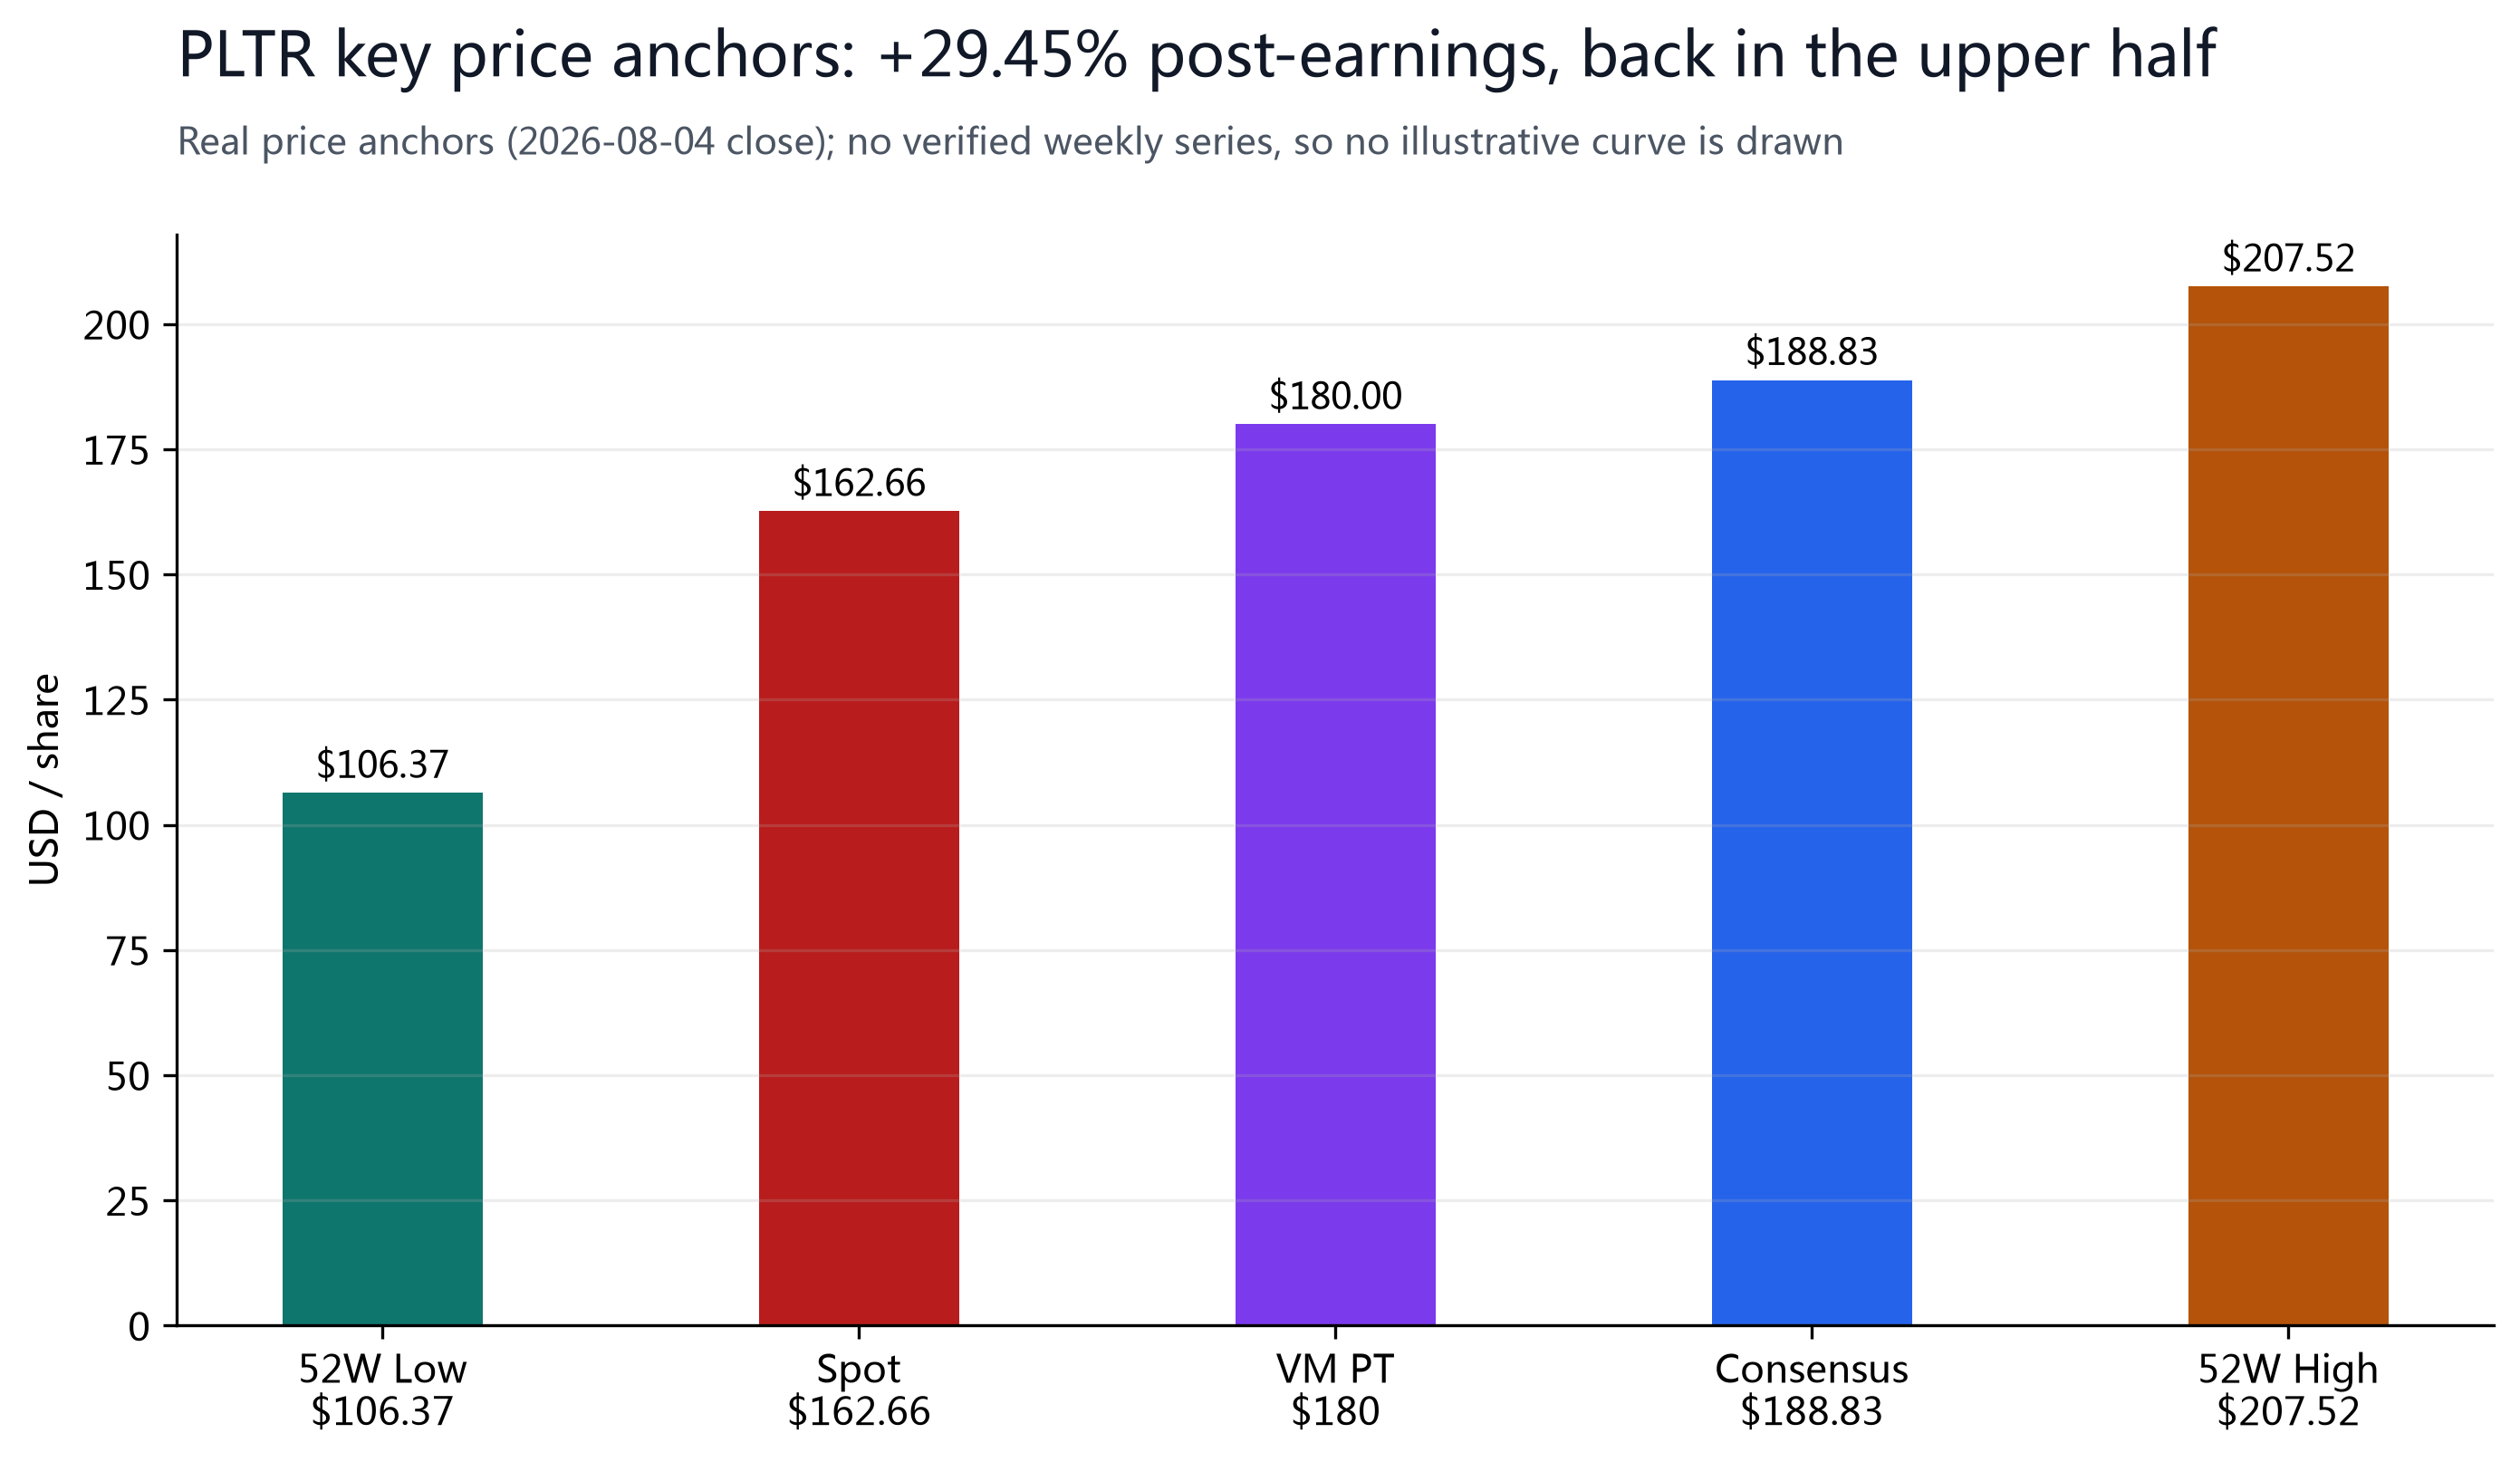
On August 4 PLTR soared 29.45% to close at $162.66 (intraday high $164.52, low $143.28), its biggest single-day gain since February 6, 2024 (+30.8%), on volume of 174M shares (~7.3% turnover) — the earnings beat plus guidance raise triggered a re-pricing of profit estimates, amplified mechanically by short covering (shorts went from ~$2.7B paper gains to ~$3B paper losses in a day). Before the report PLTR was down as much as 25% YTD (from the Jan 7 high of $207.52 to the June low of $106.37, a ~49% drawdown), with the market worrying about disruption from model labs like OpenAI and Anthropic.
| Metric | Value | Source / Note |
|---|---|---|
| Current price | $162.66 | 2026-08-04 收盘 (+29.45%);盘后 $160.38 (-1.40%) |
| Market cap | $390.9B | 162.66 x 2.40B shares (stockanalysis) |
| 52W range | $106.37-$207.52 | 低点 2026-06-25 / 高点 2026-01 |
| YTD | 约 -11% | 2026 年初 $180.84 → 8/4 $162.66 |
| Volume (8/4) | 174.4M | 换手率约 7.3% |
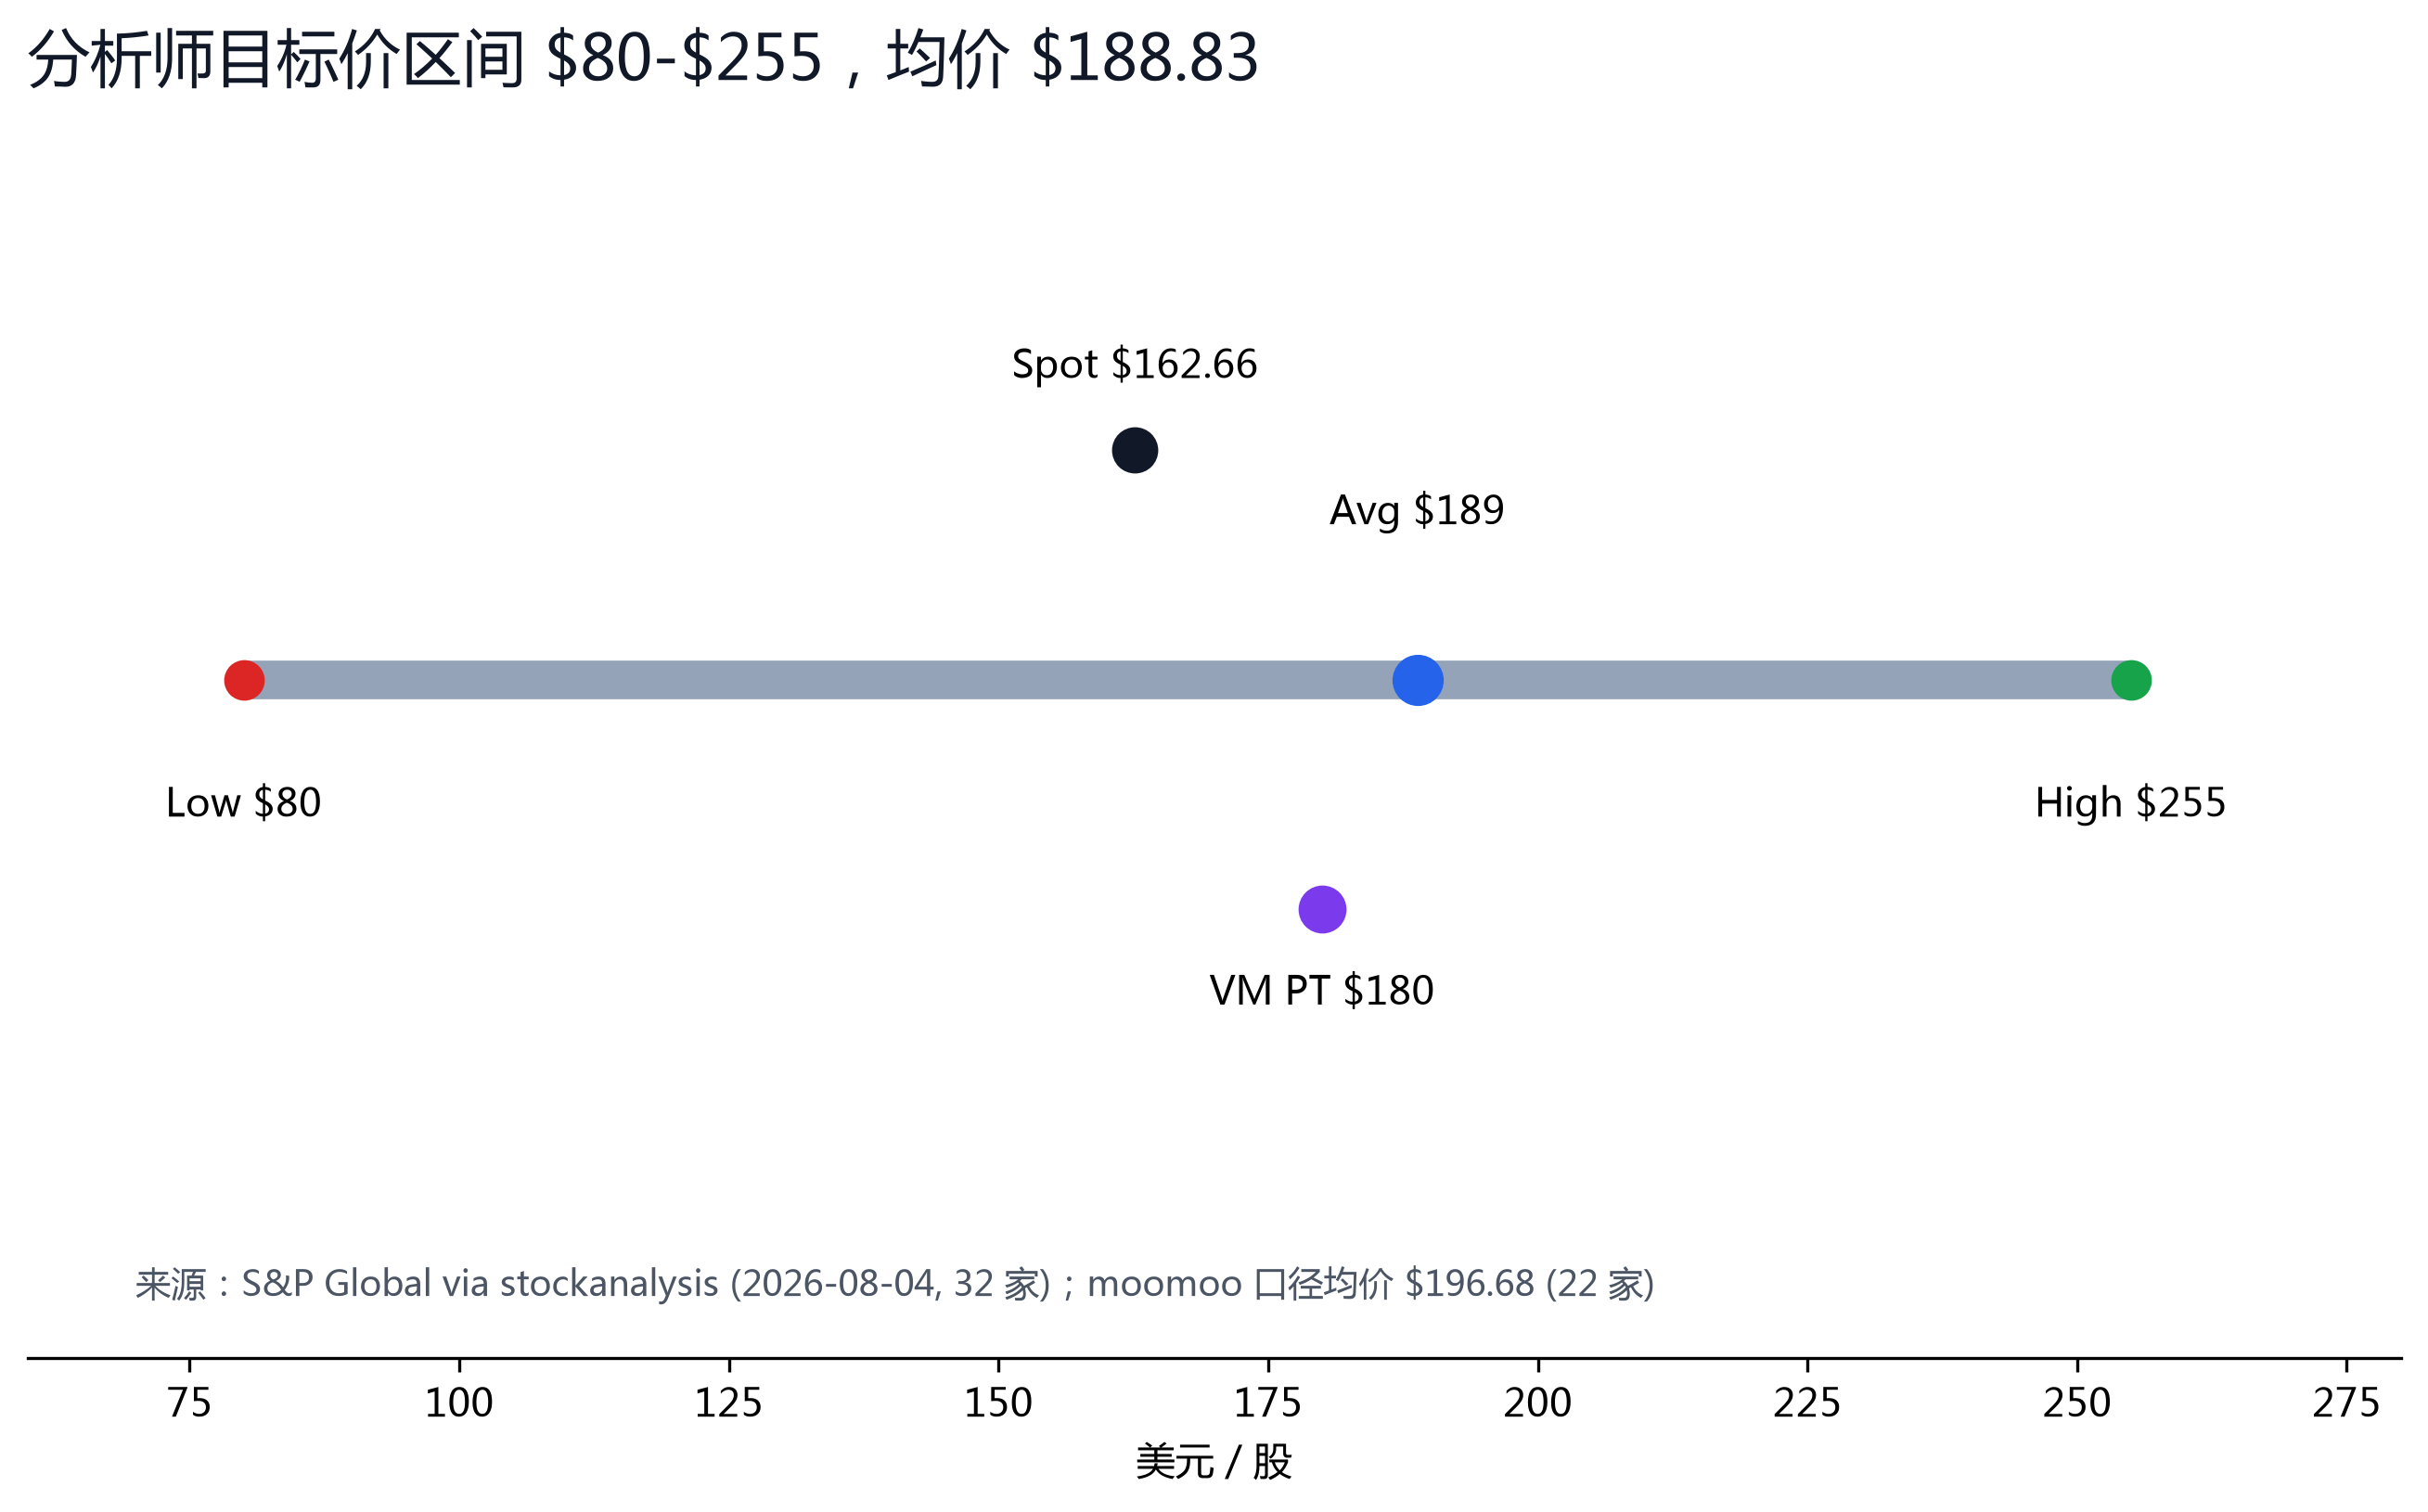
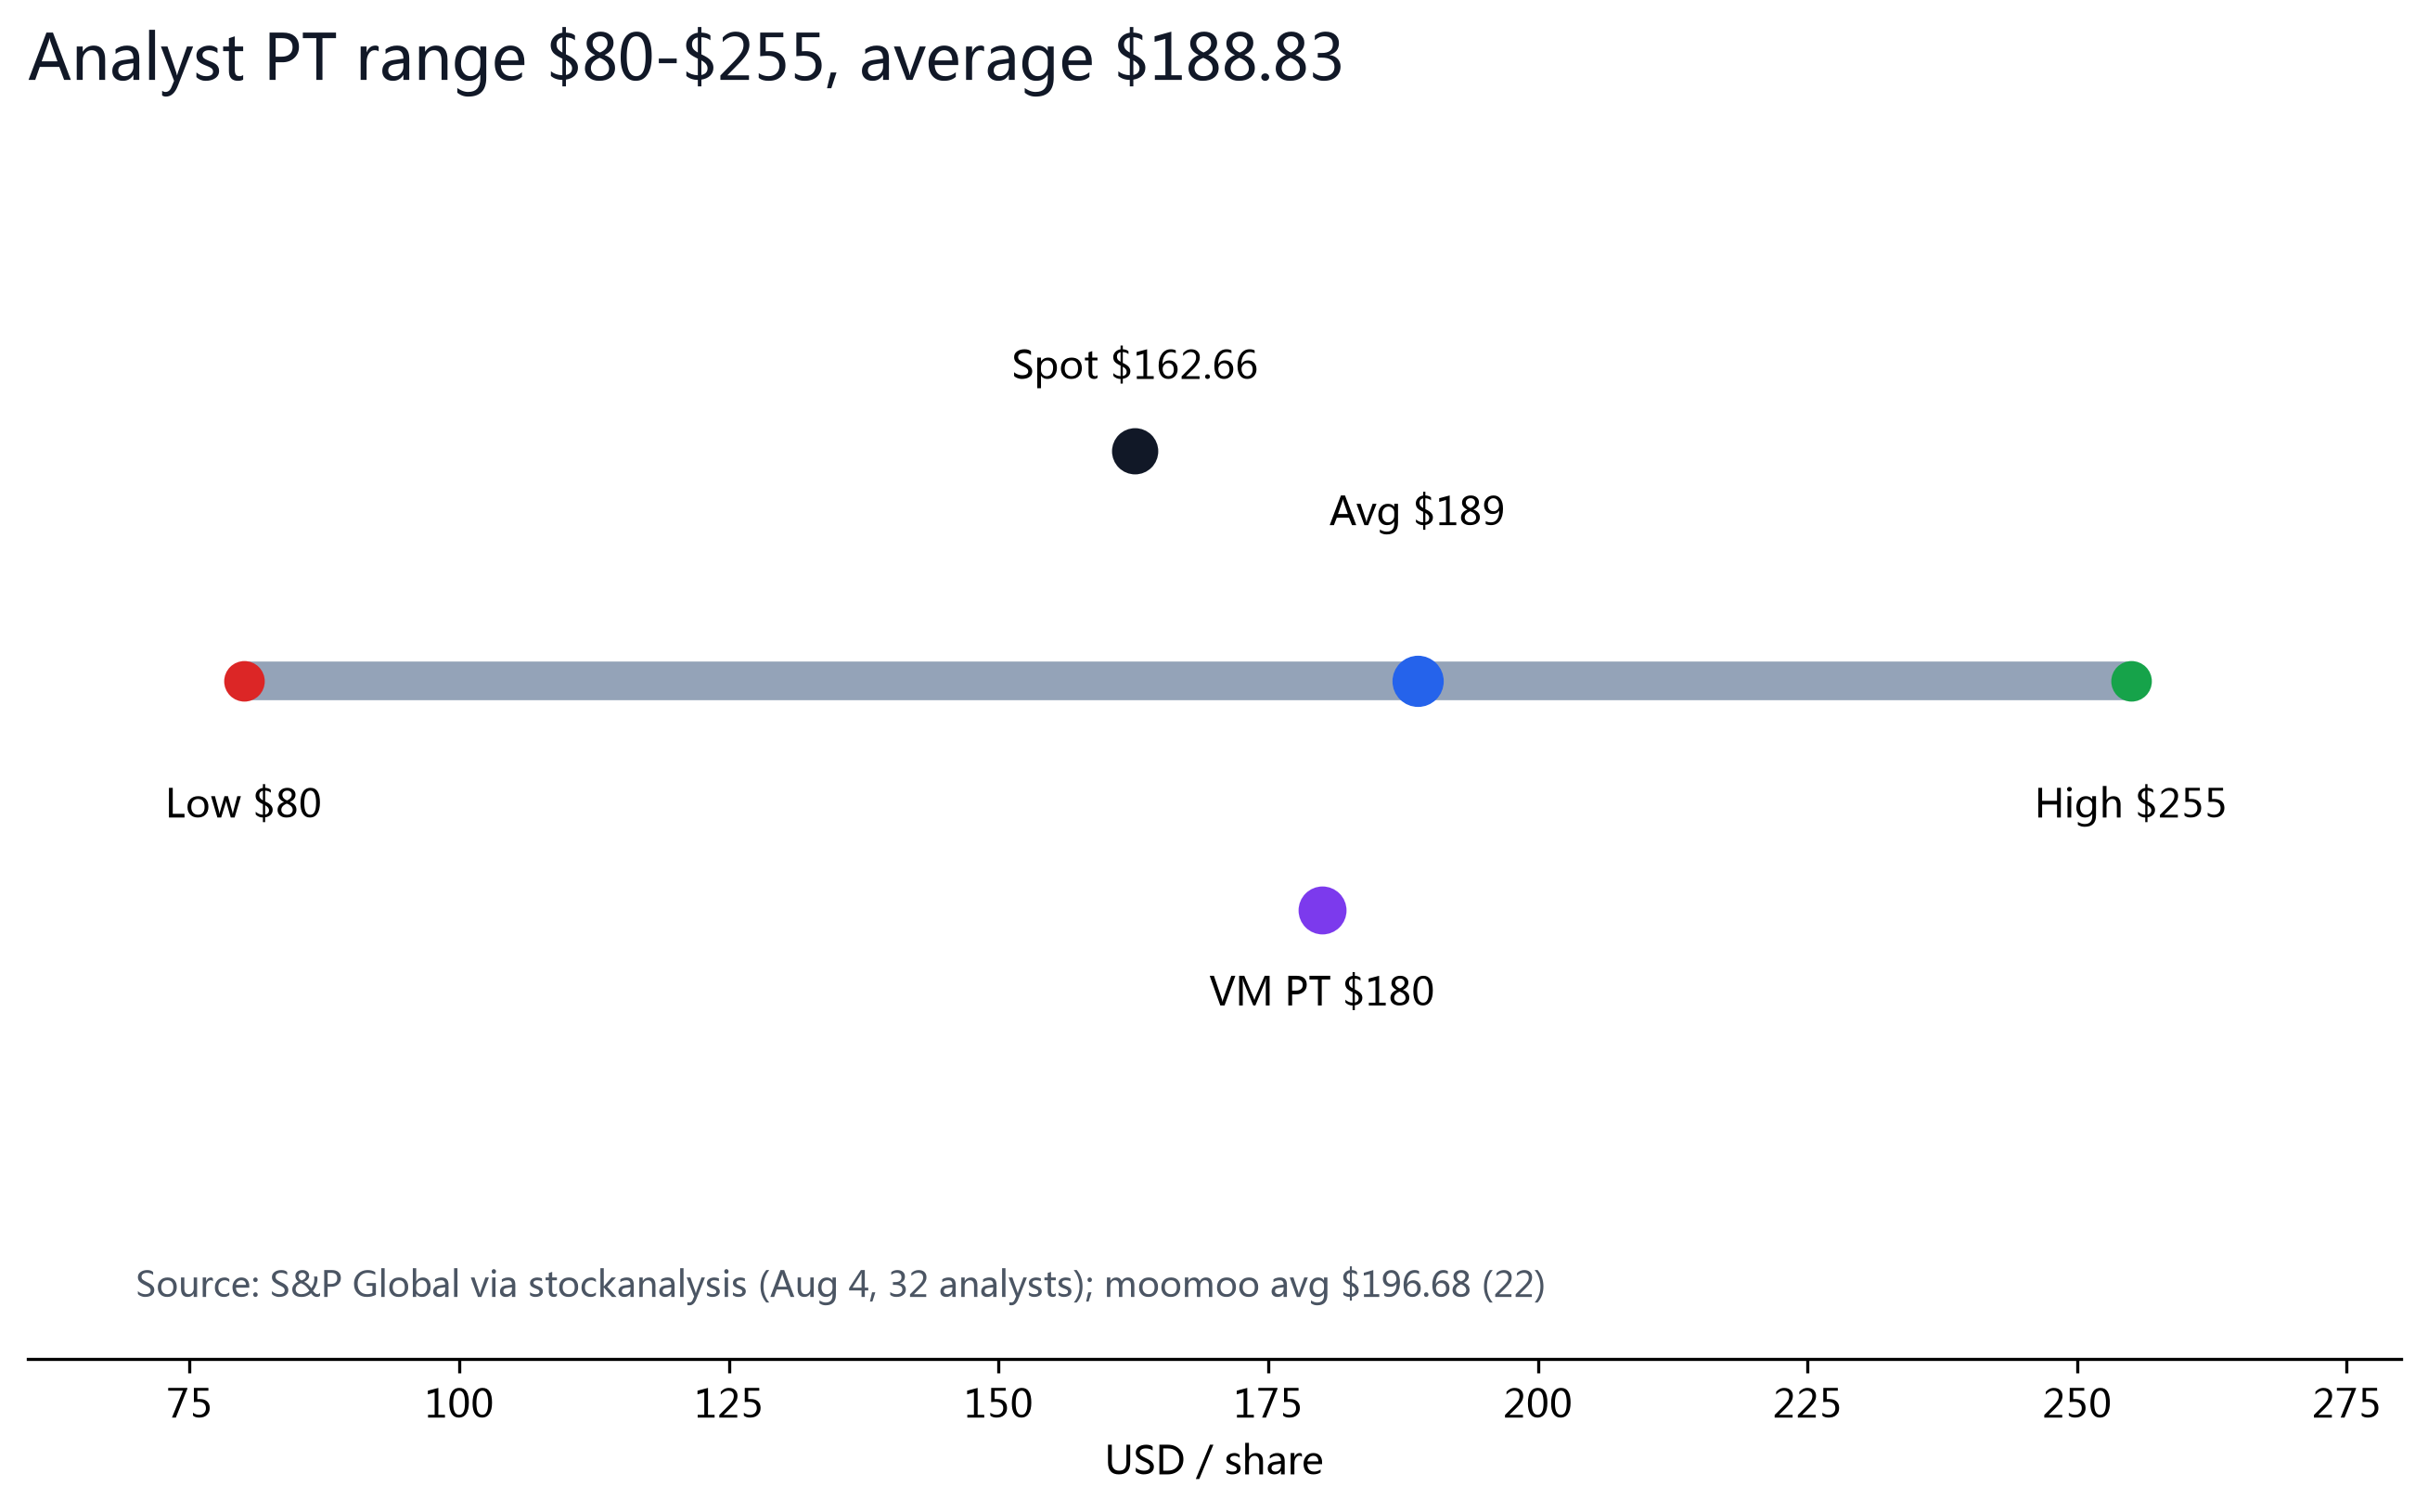
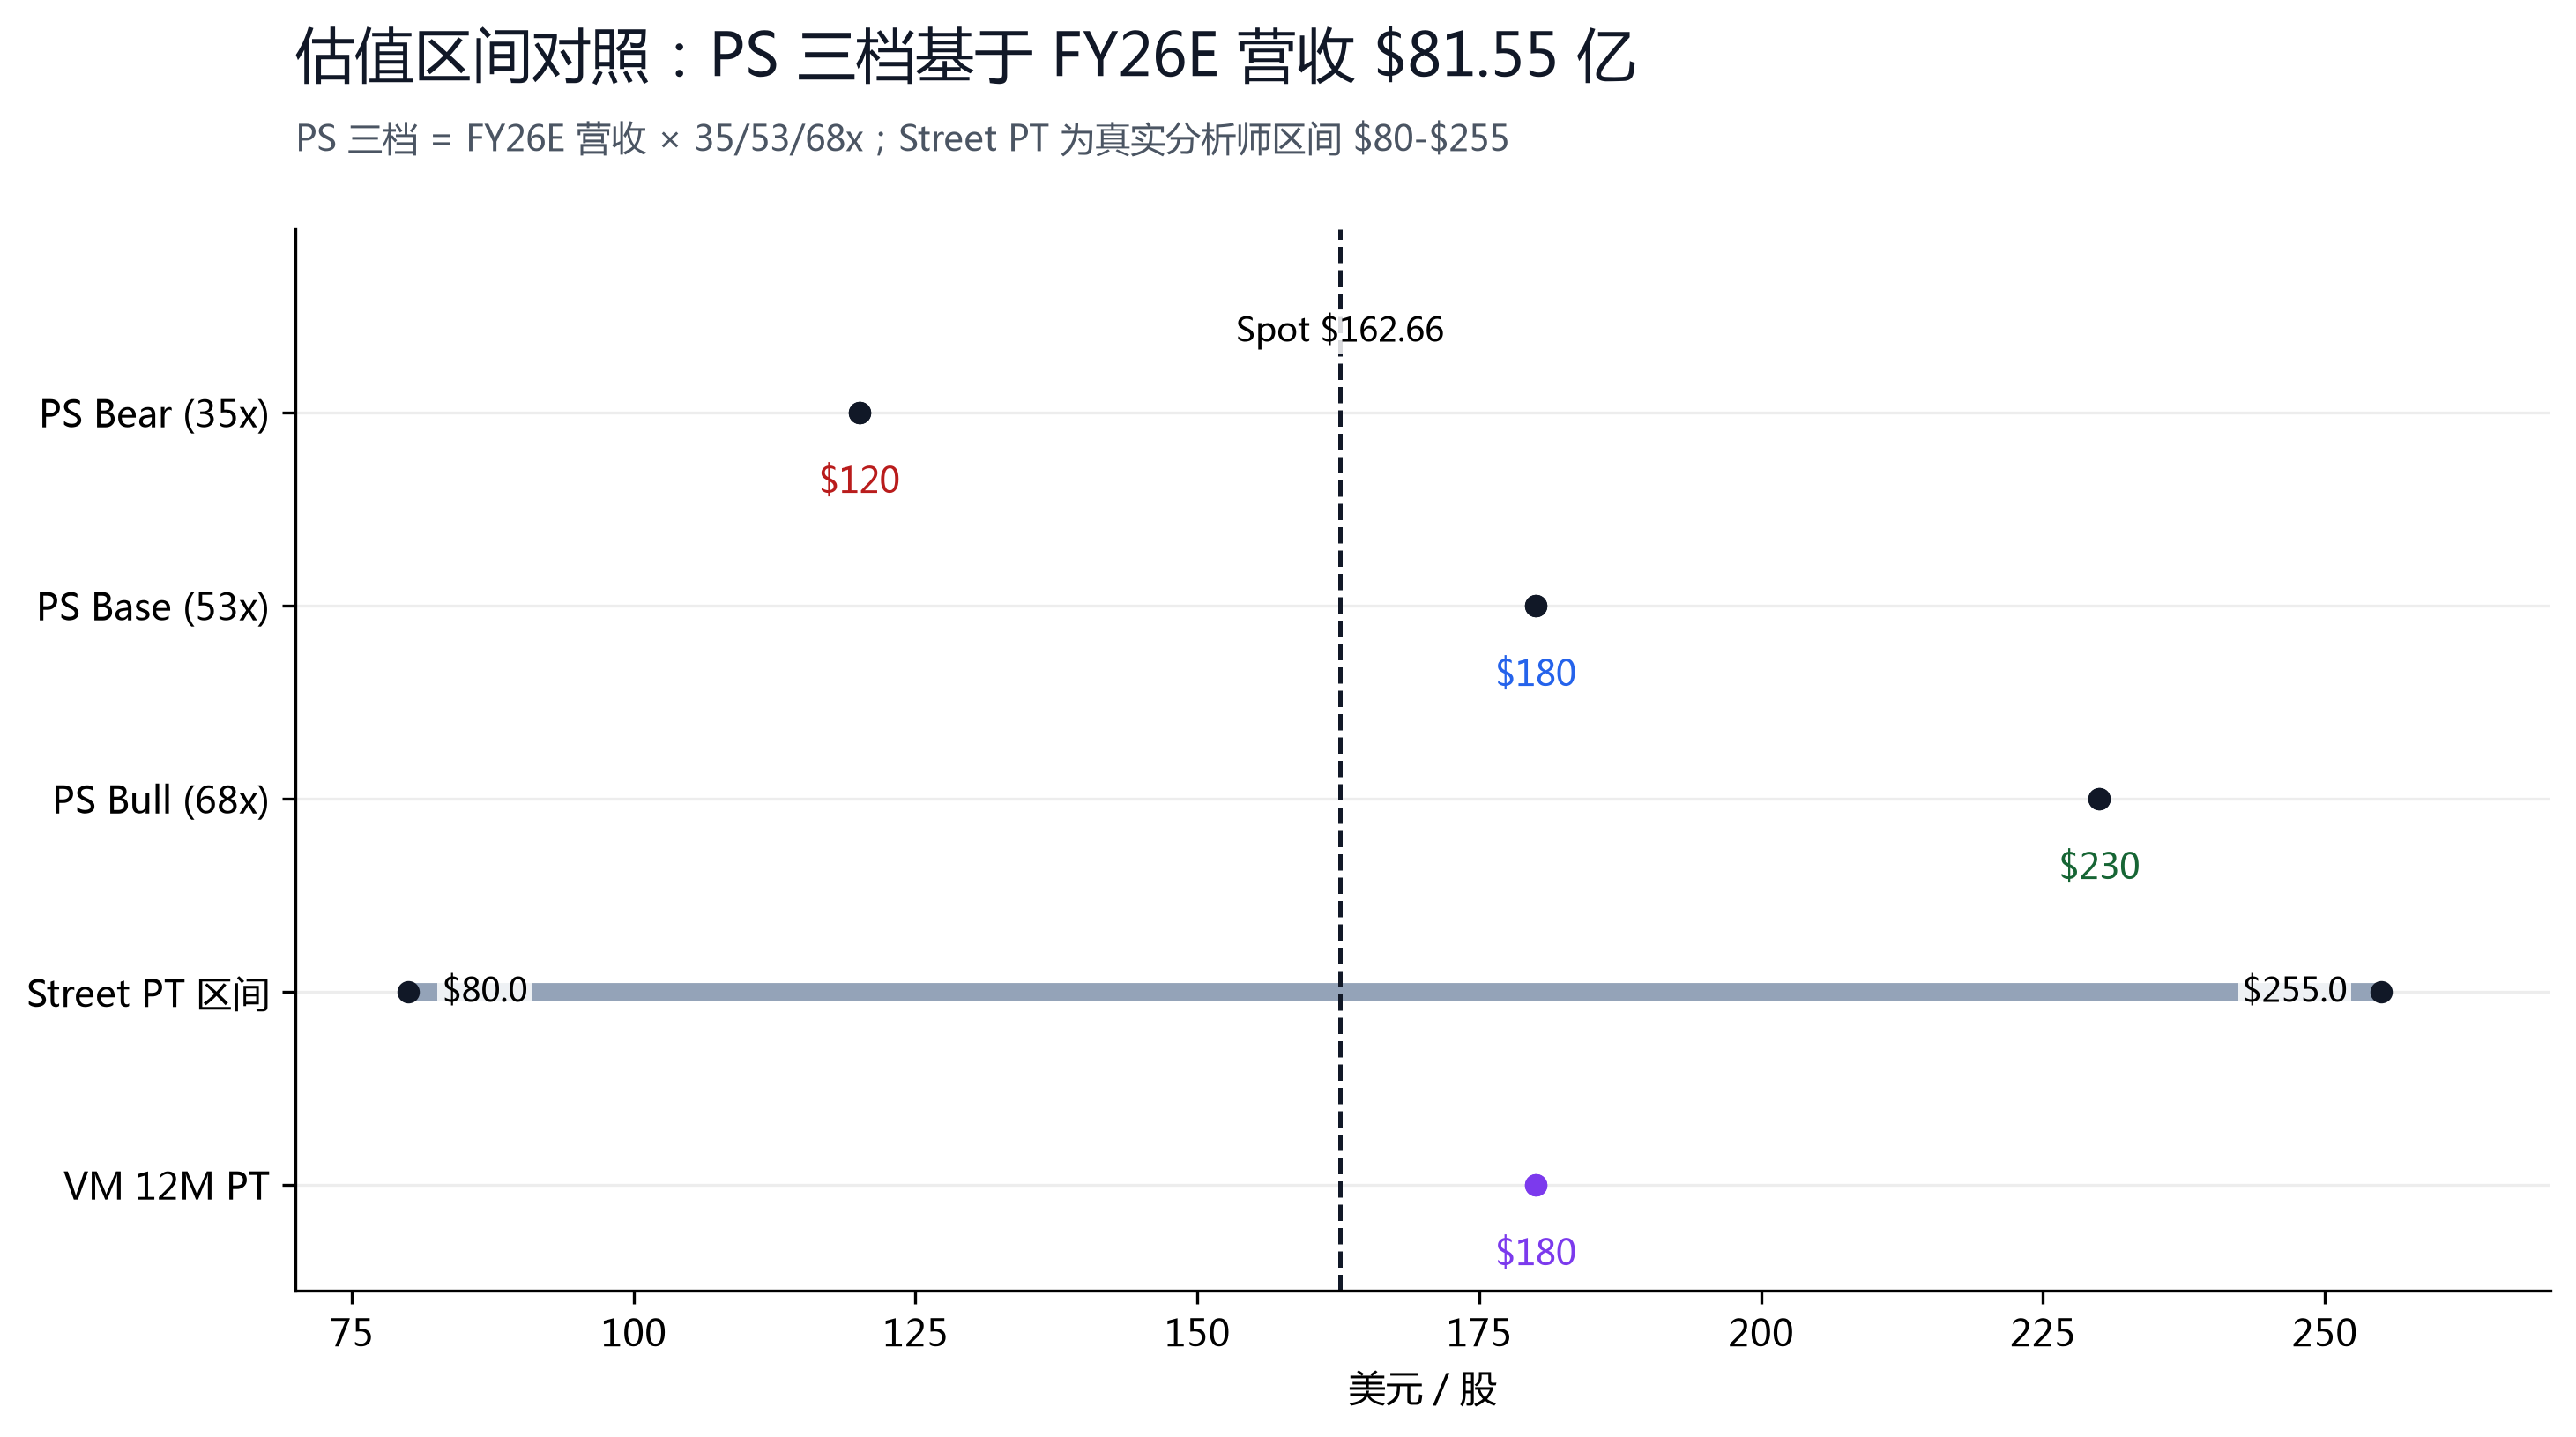
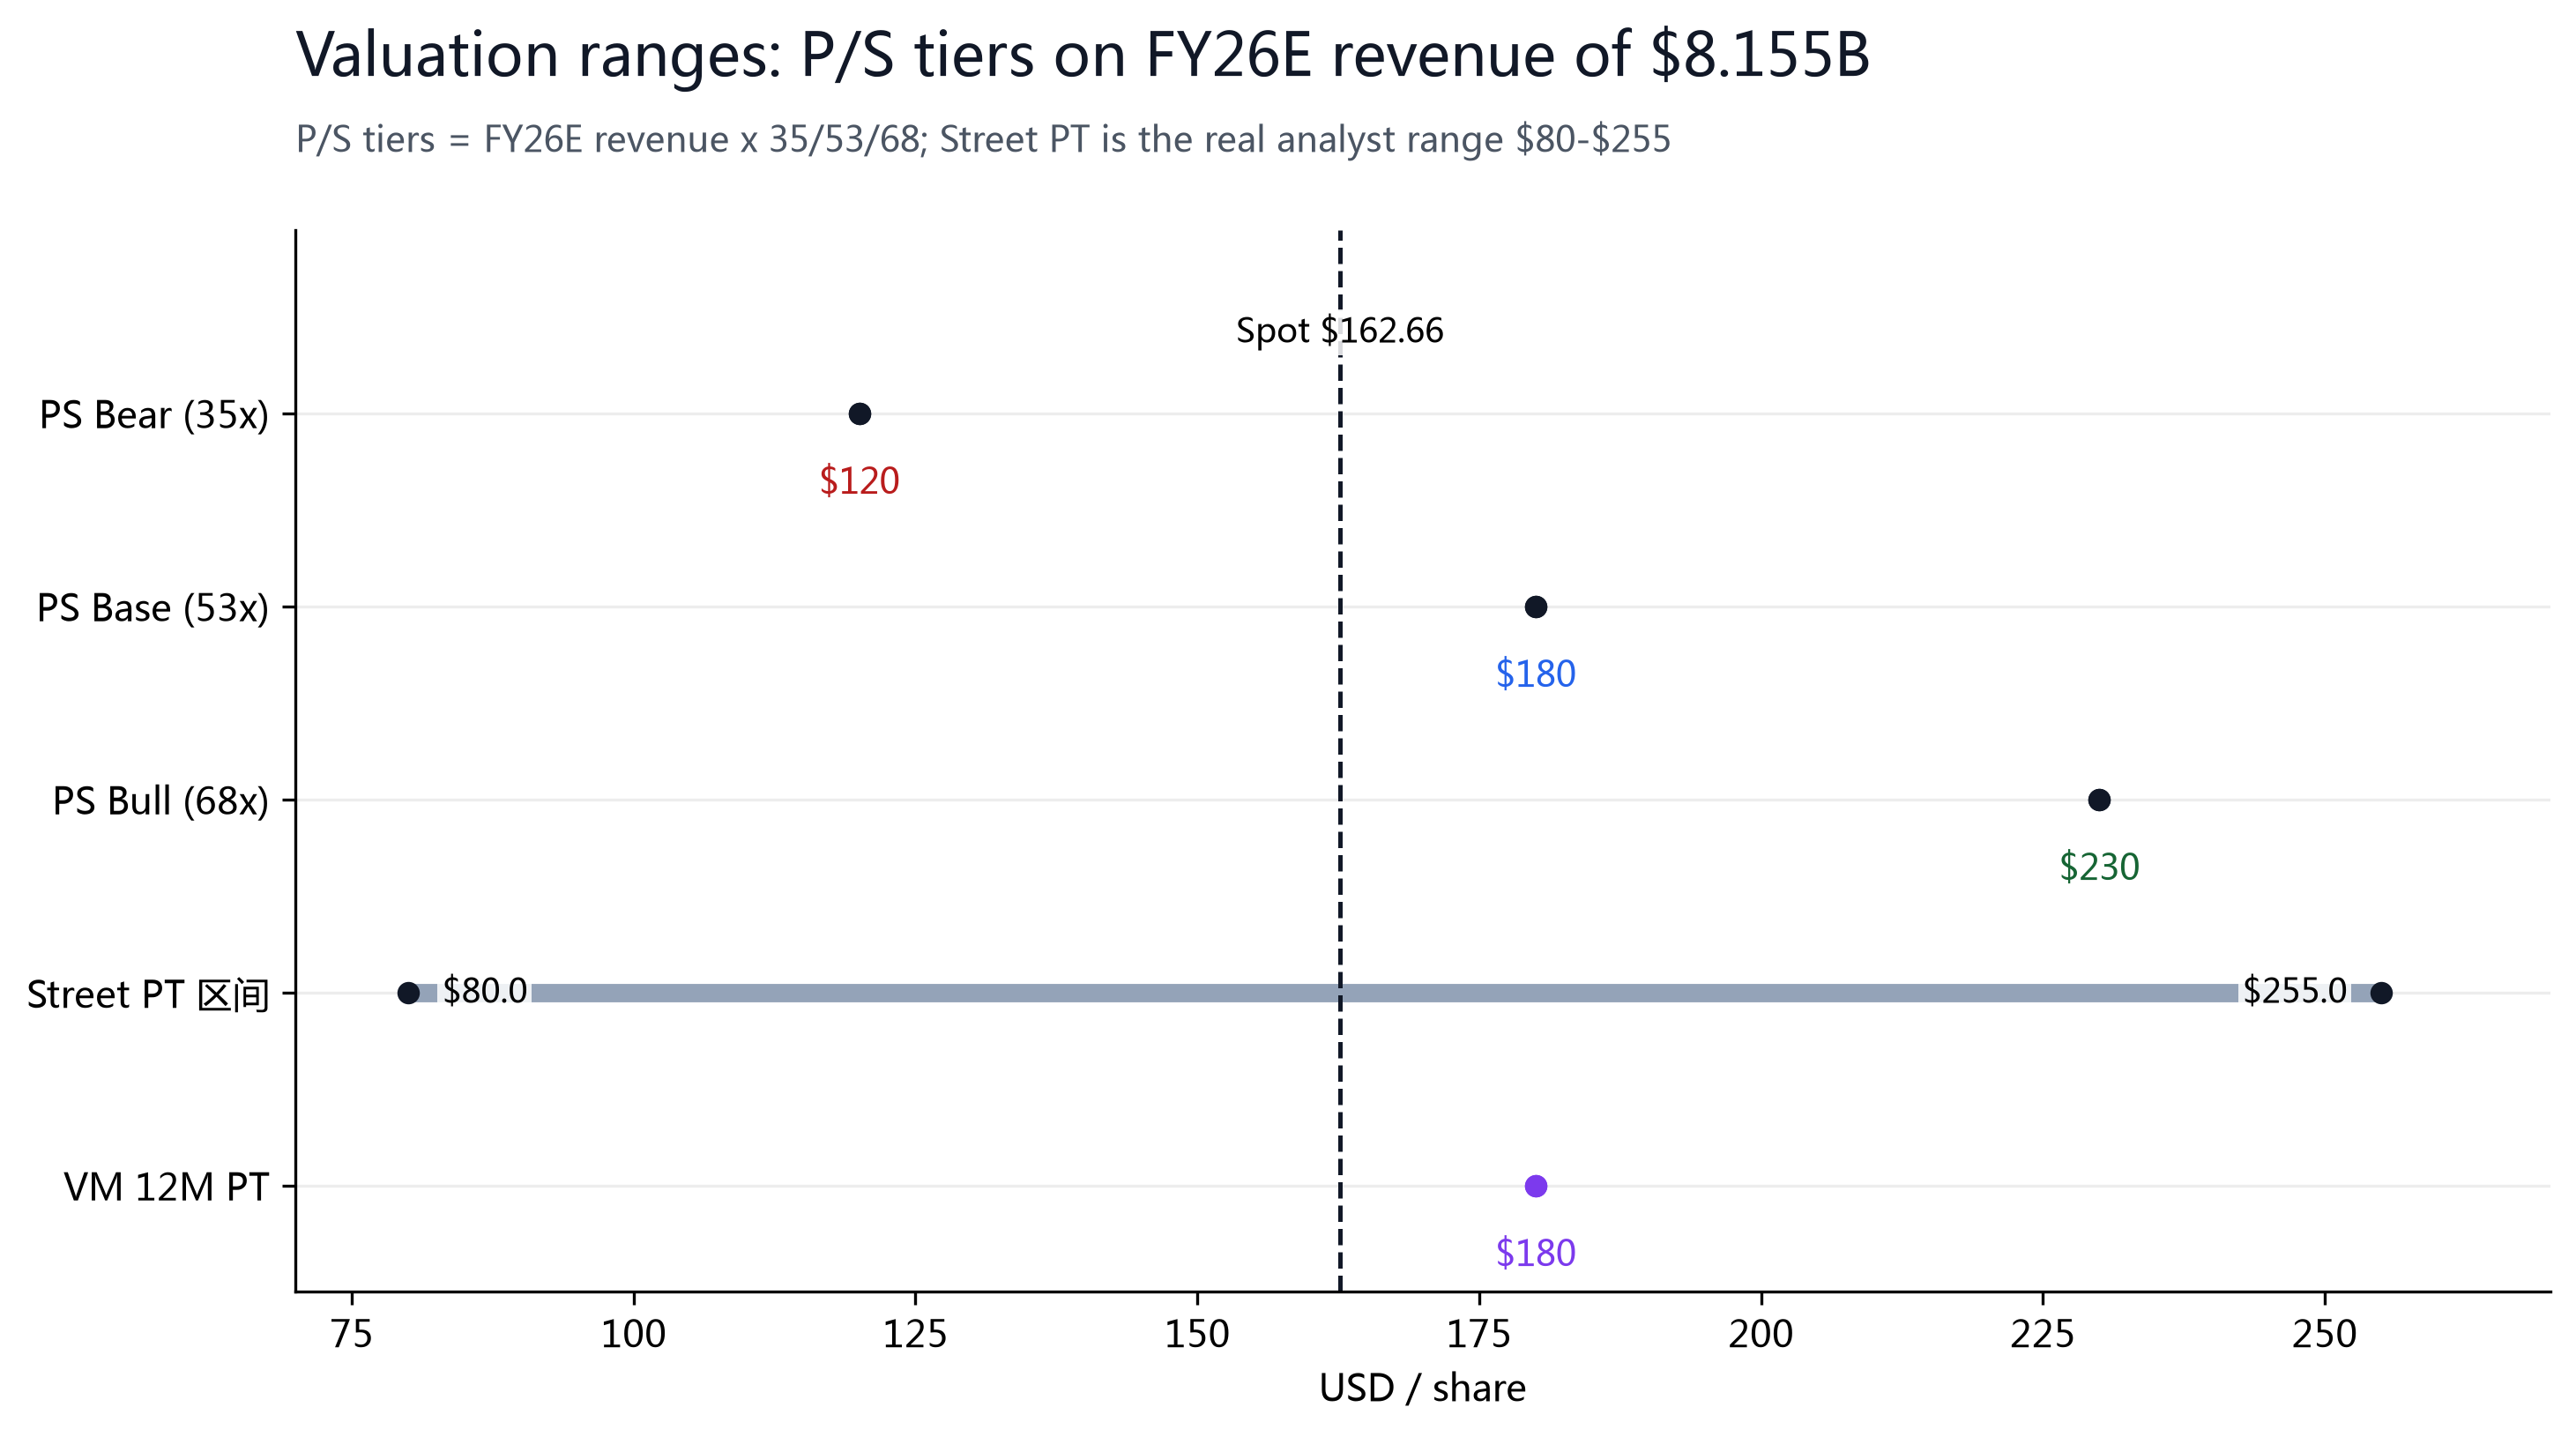
| Analyst PT | $80 / $188.83 / $255 | Low / Avg / High · S&P Global (32 家, 8/4) |
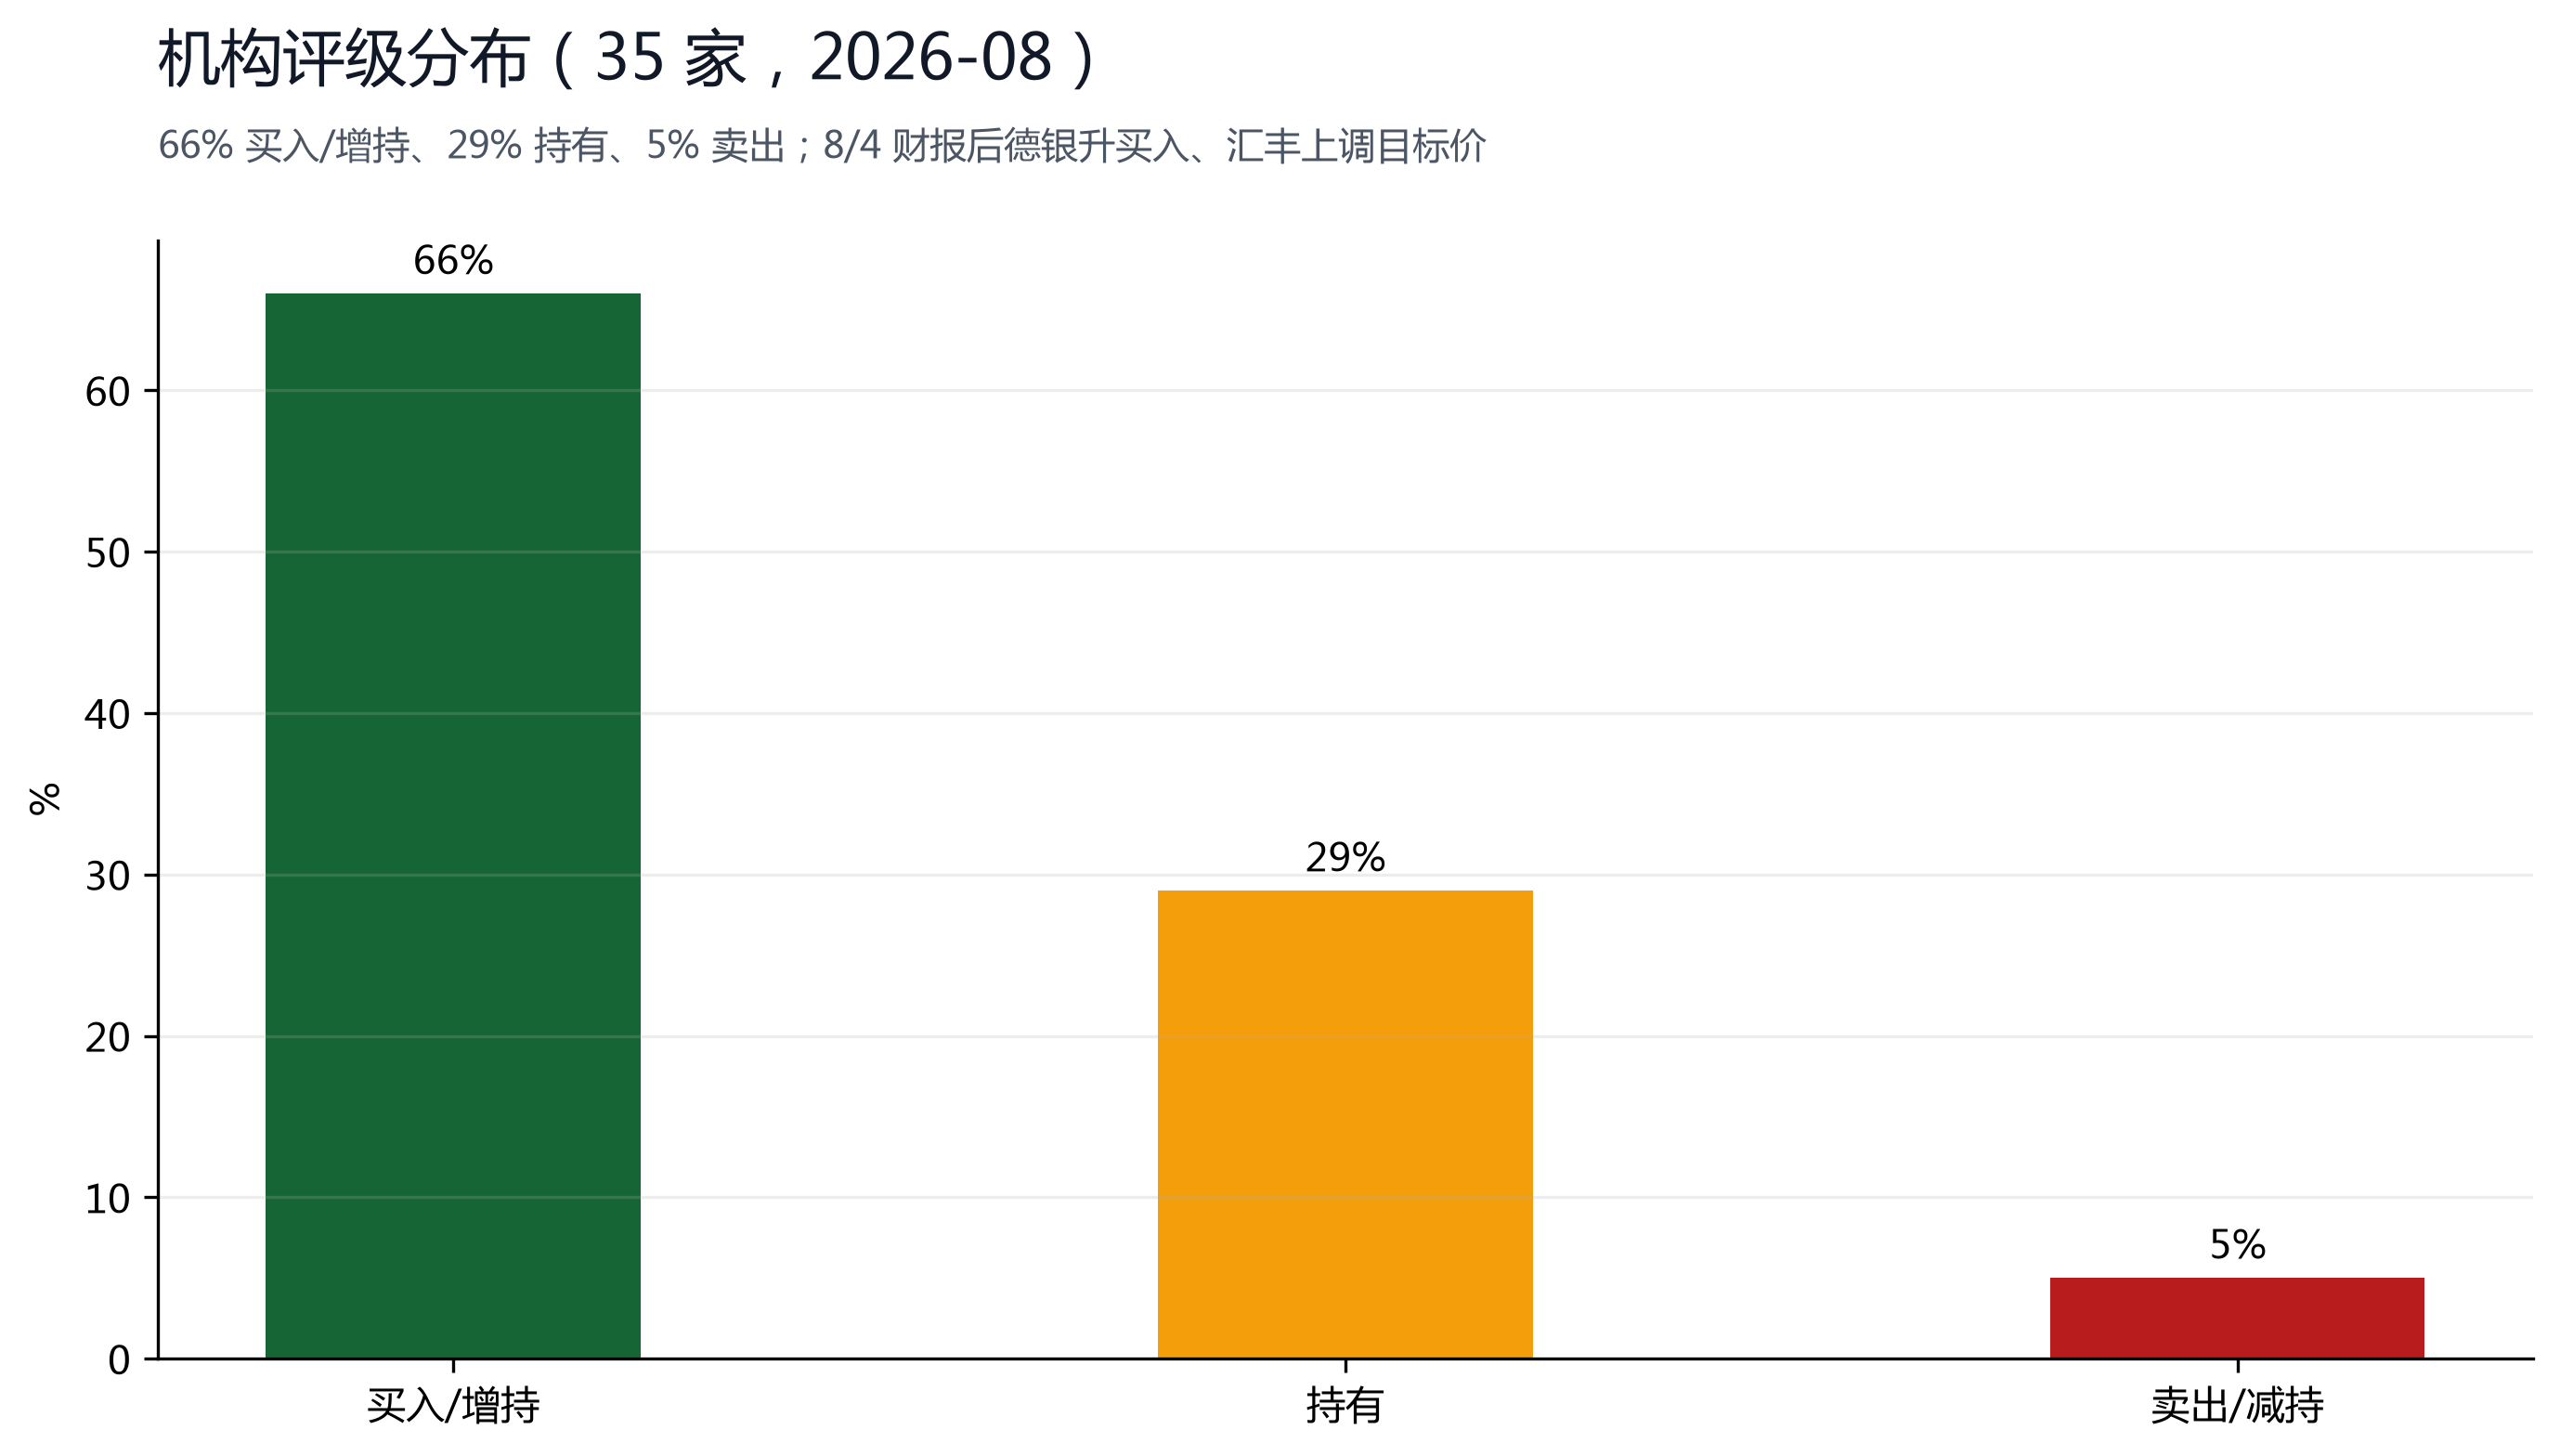
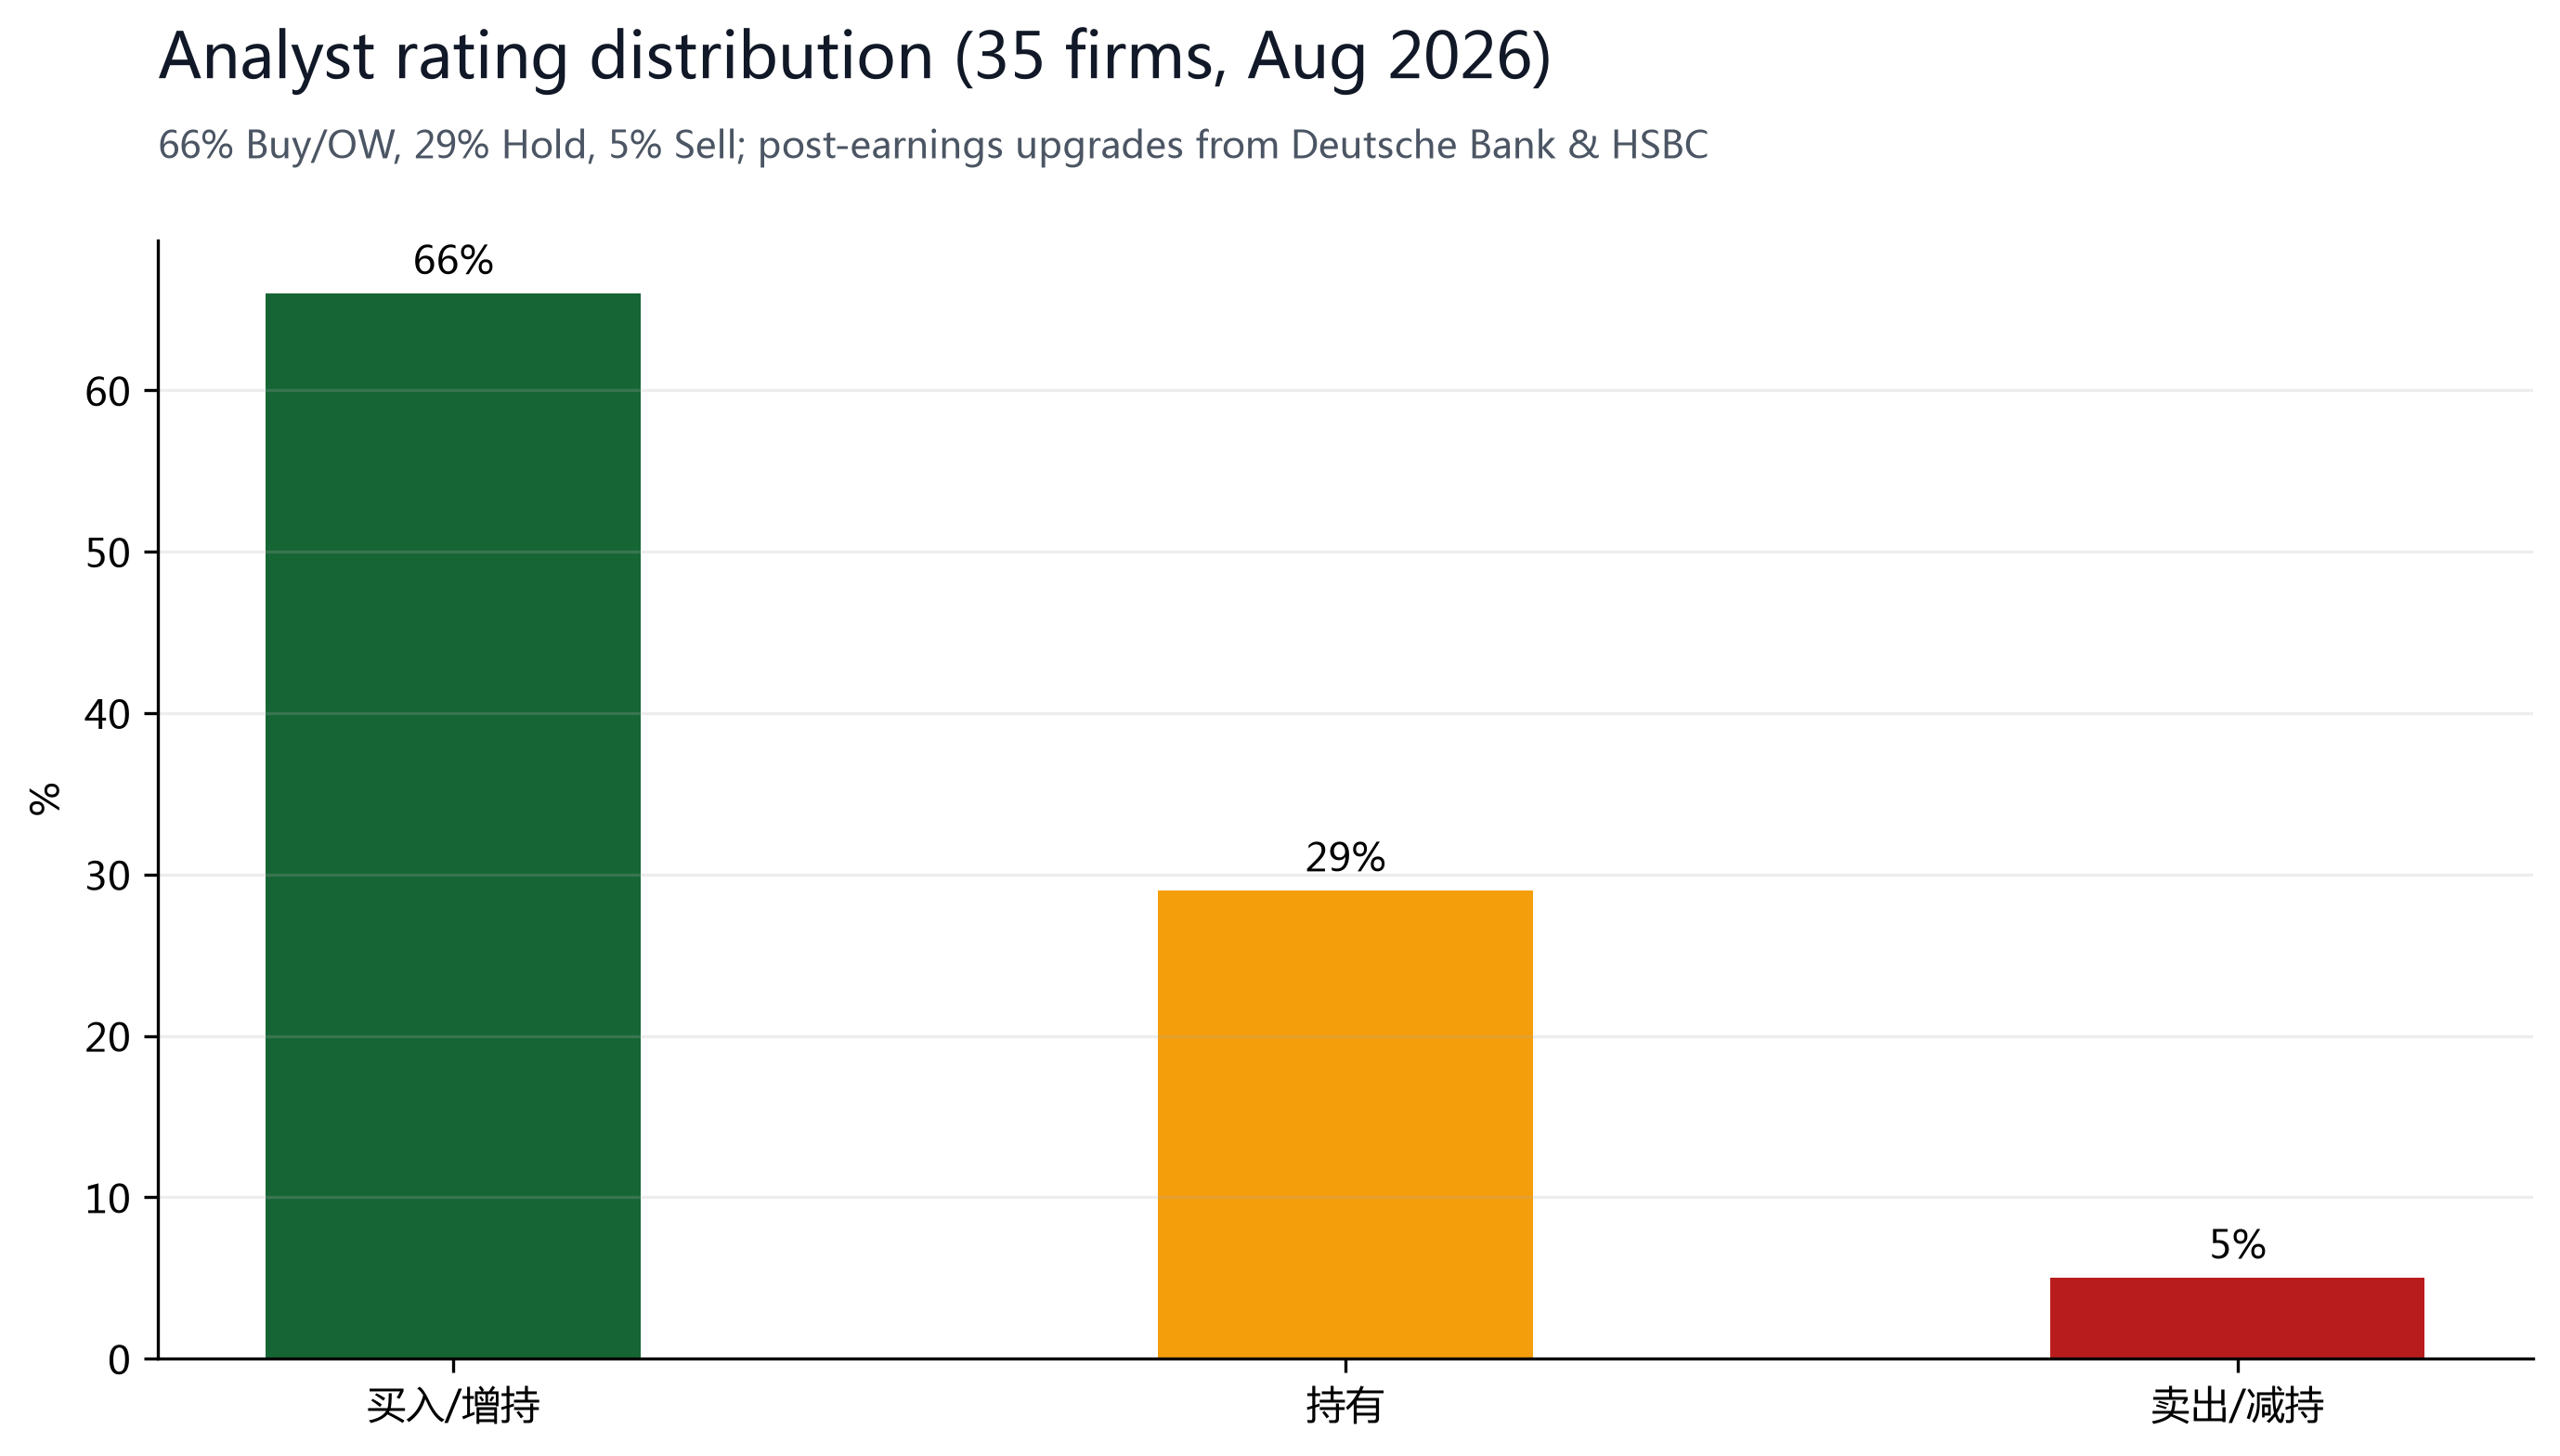
| Recommendation split | 66% / 29% / 5% | Buy+OW / Hold / Sell+UW · 35 家 (8/5) |
| TTM 指标 | Rev $6.16B / NI $3.02B / EPS $1.17 | stockanalysis.com |
| Beta | 1.56 | 高波动 |
§03Bull/Bear View
Bull: the last mile of enterprise AI, U.S. commercial +149%, record contract funnel
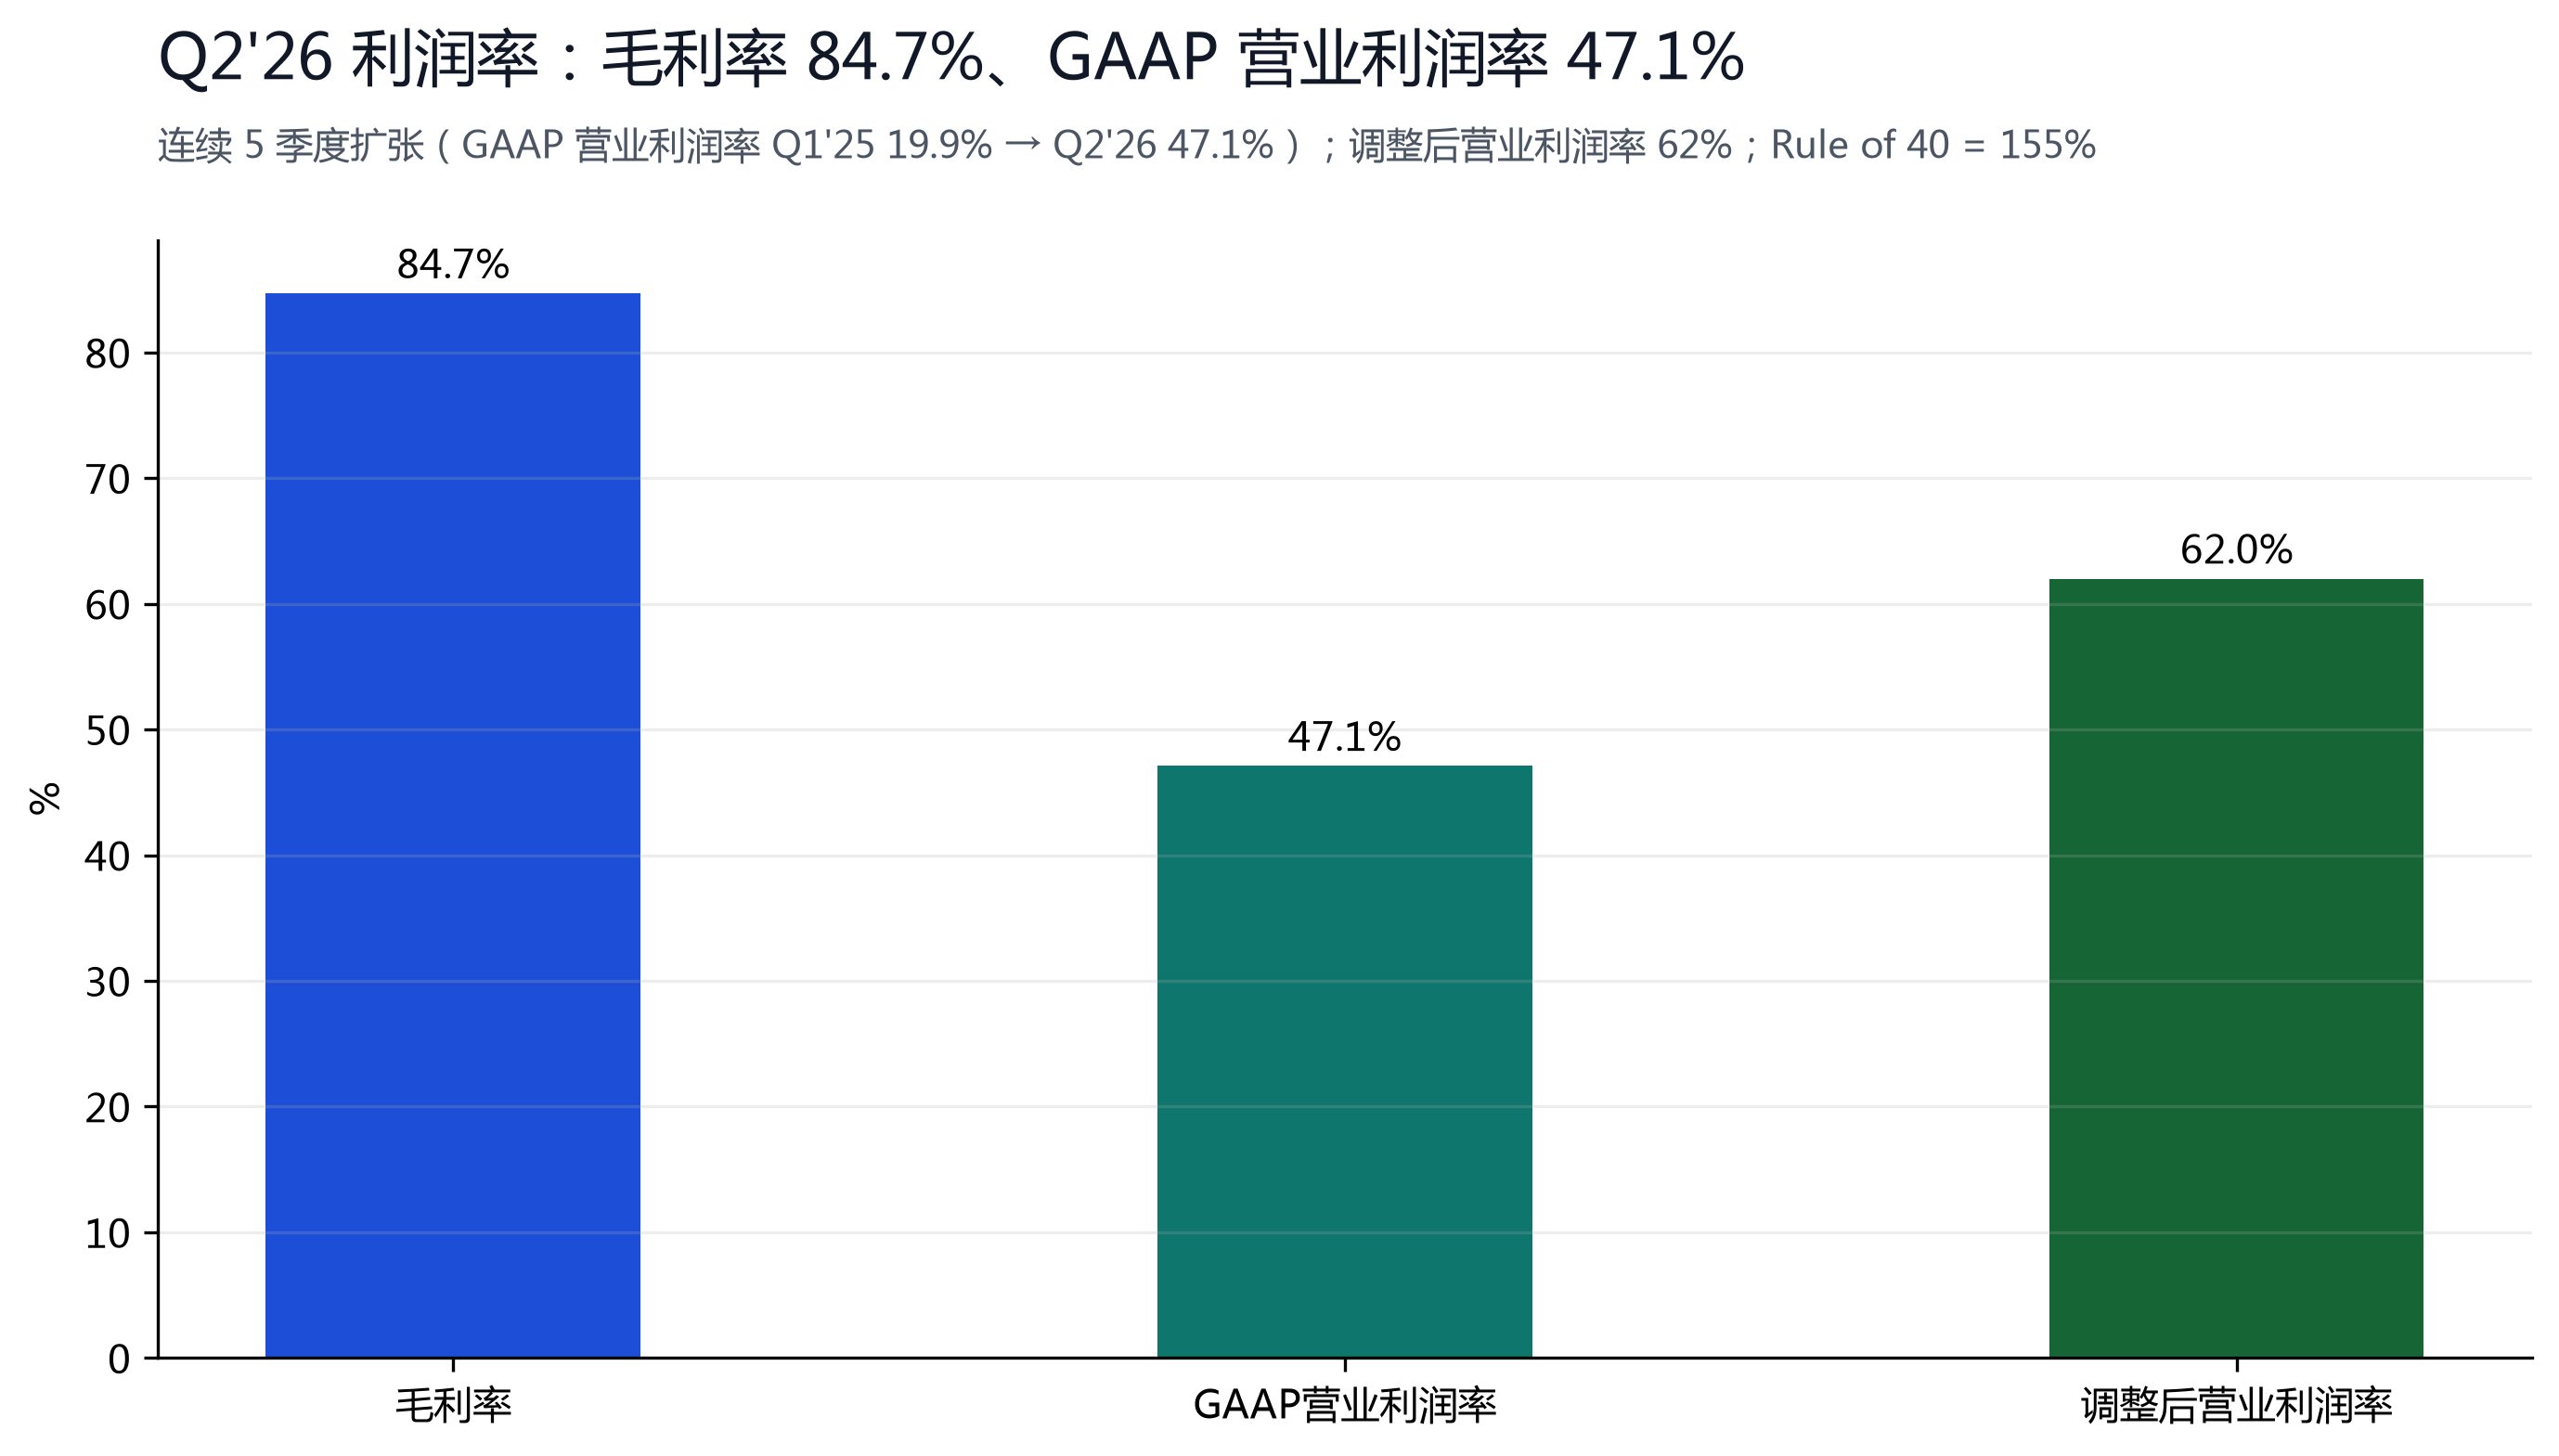
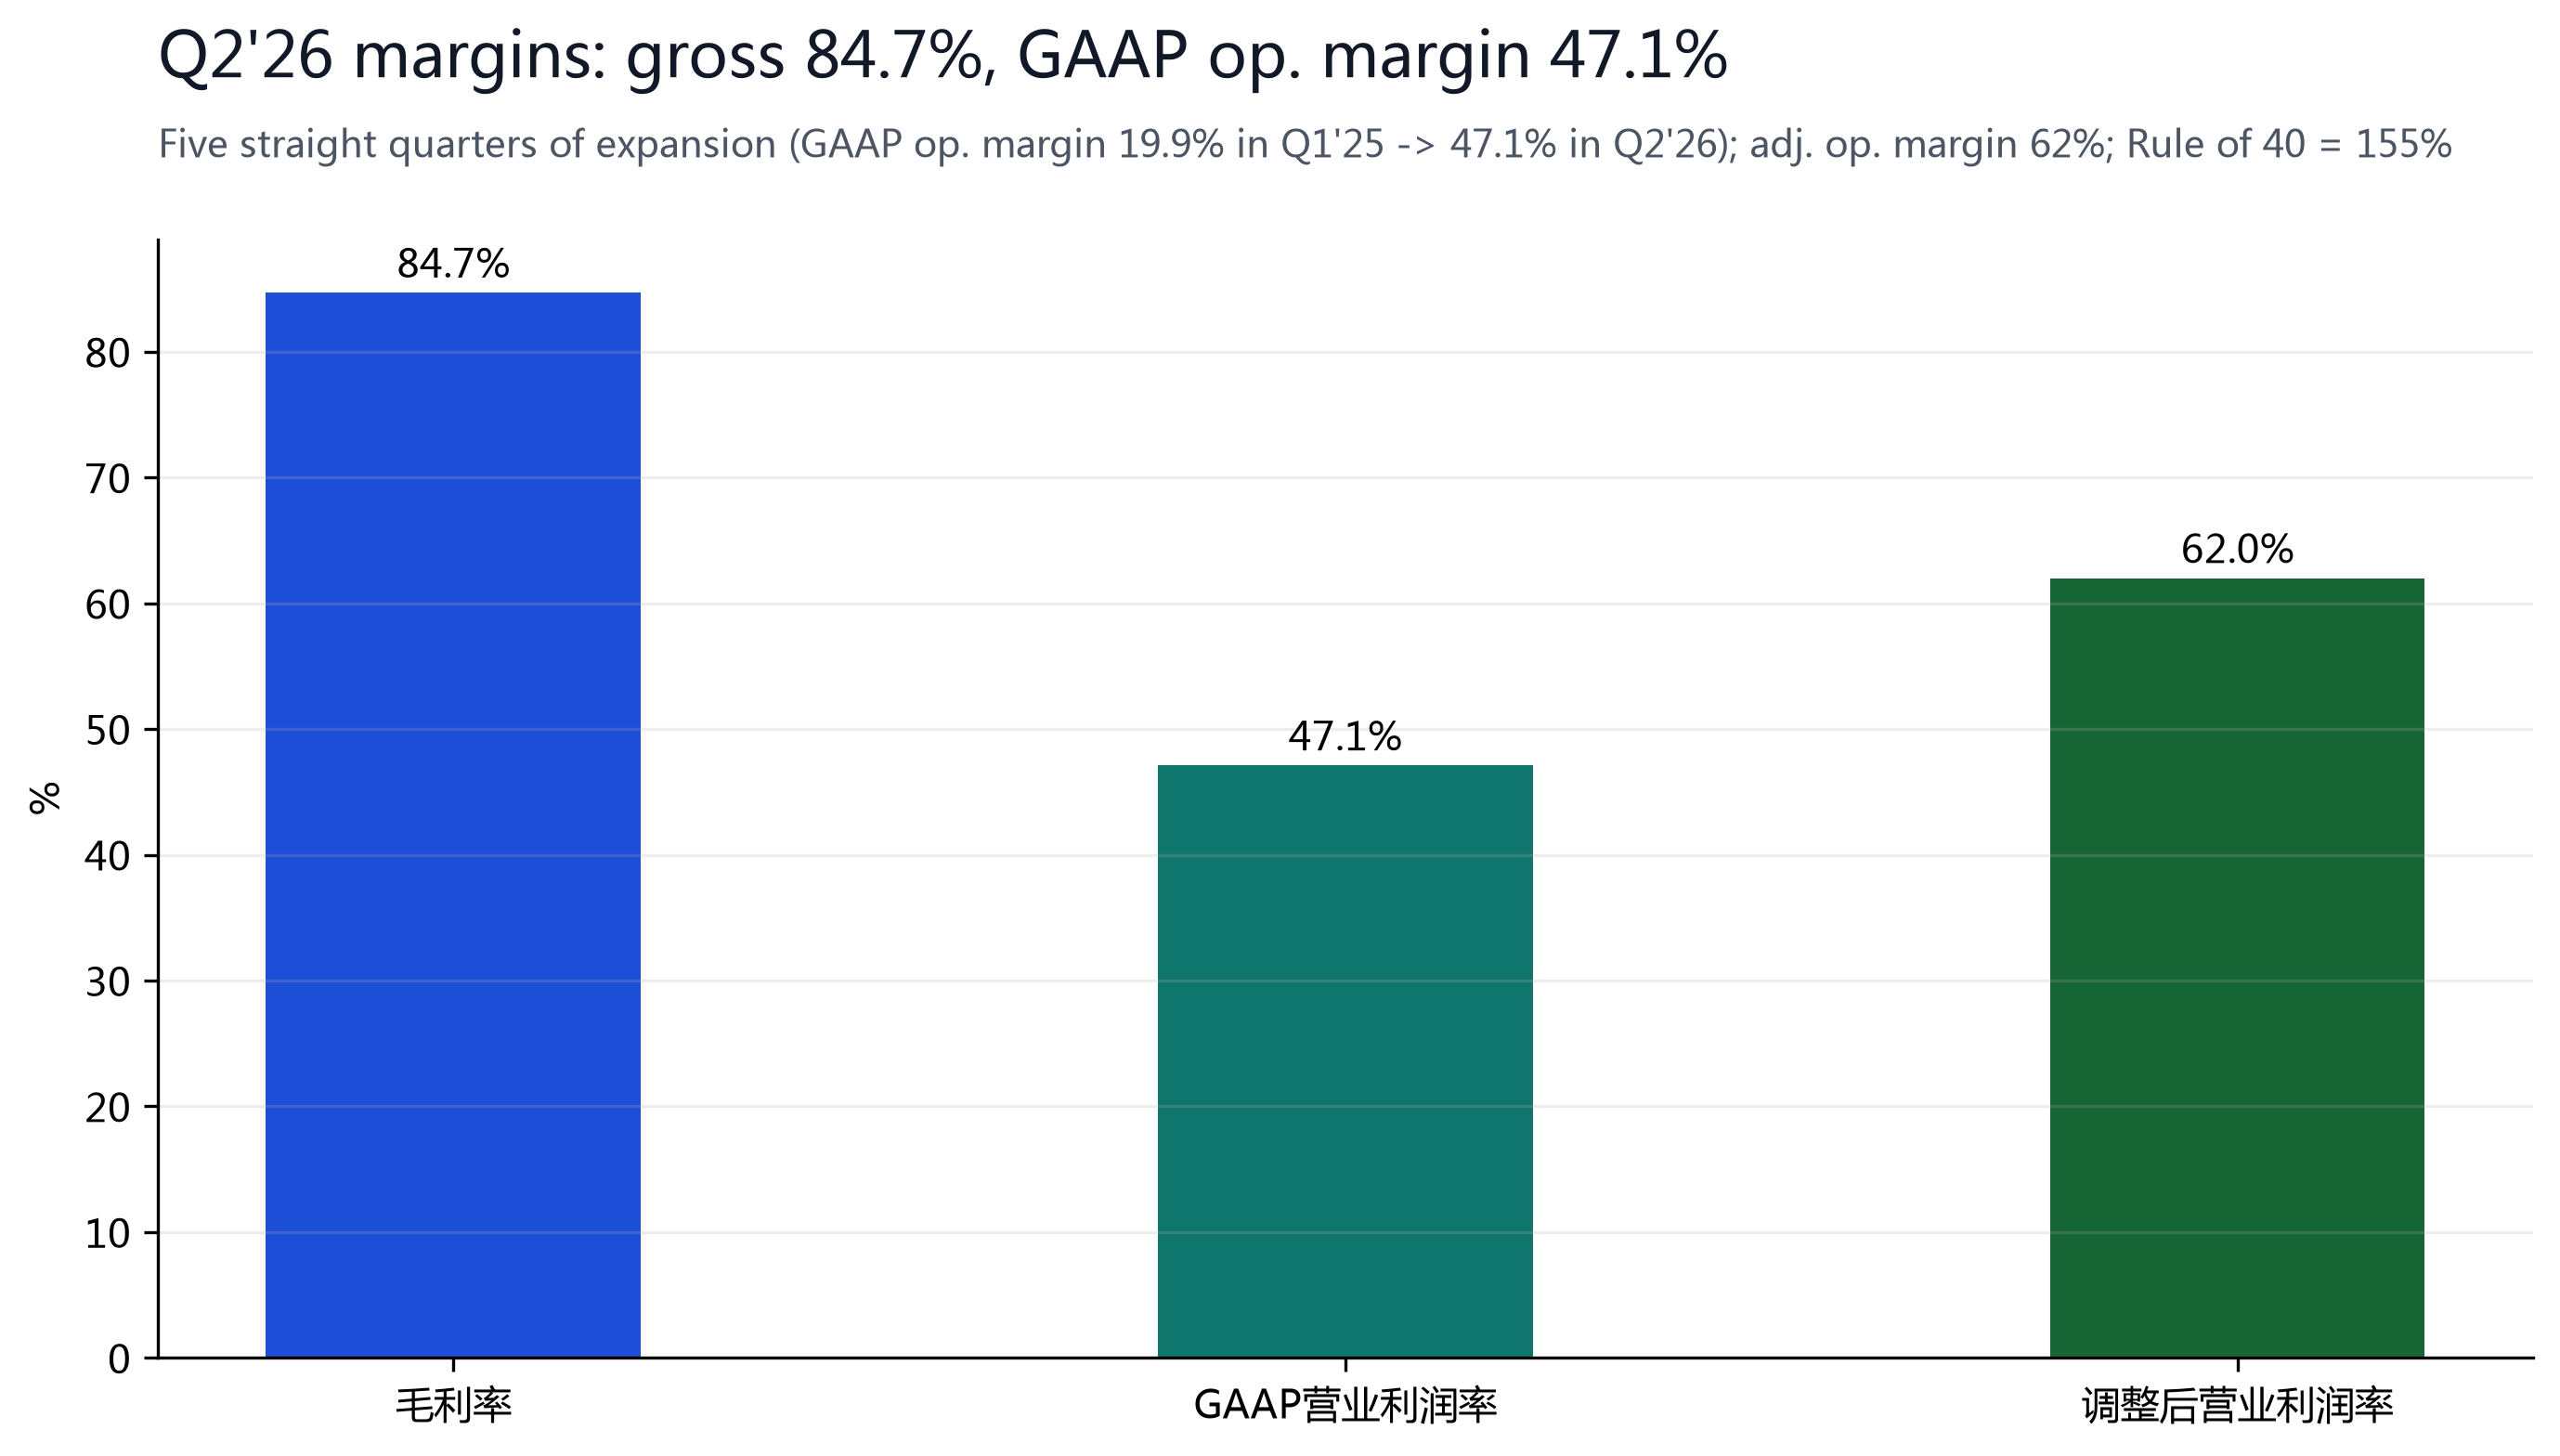
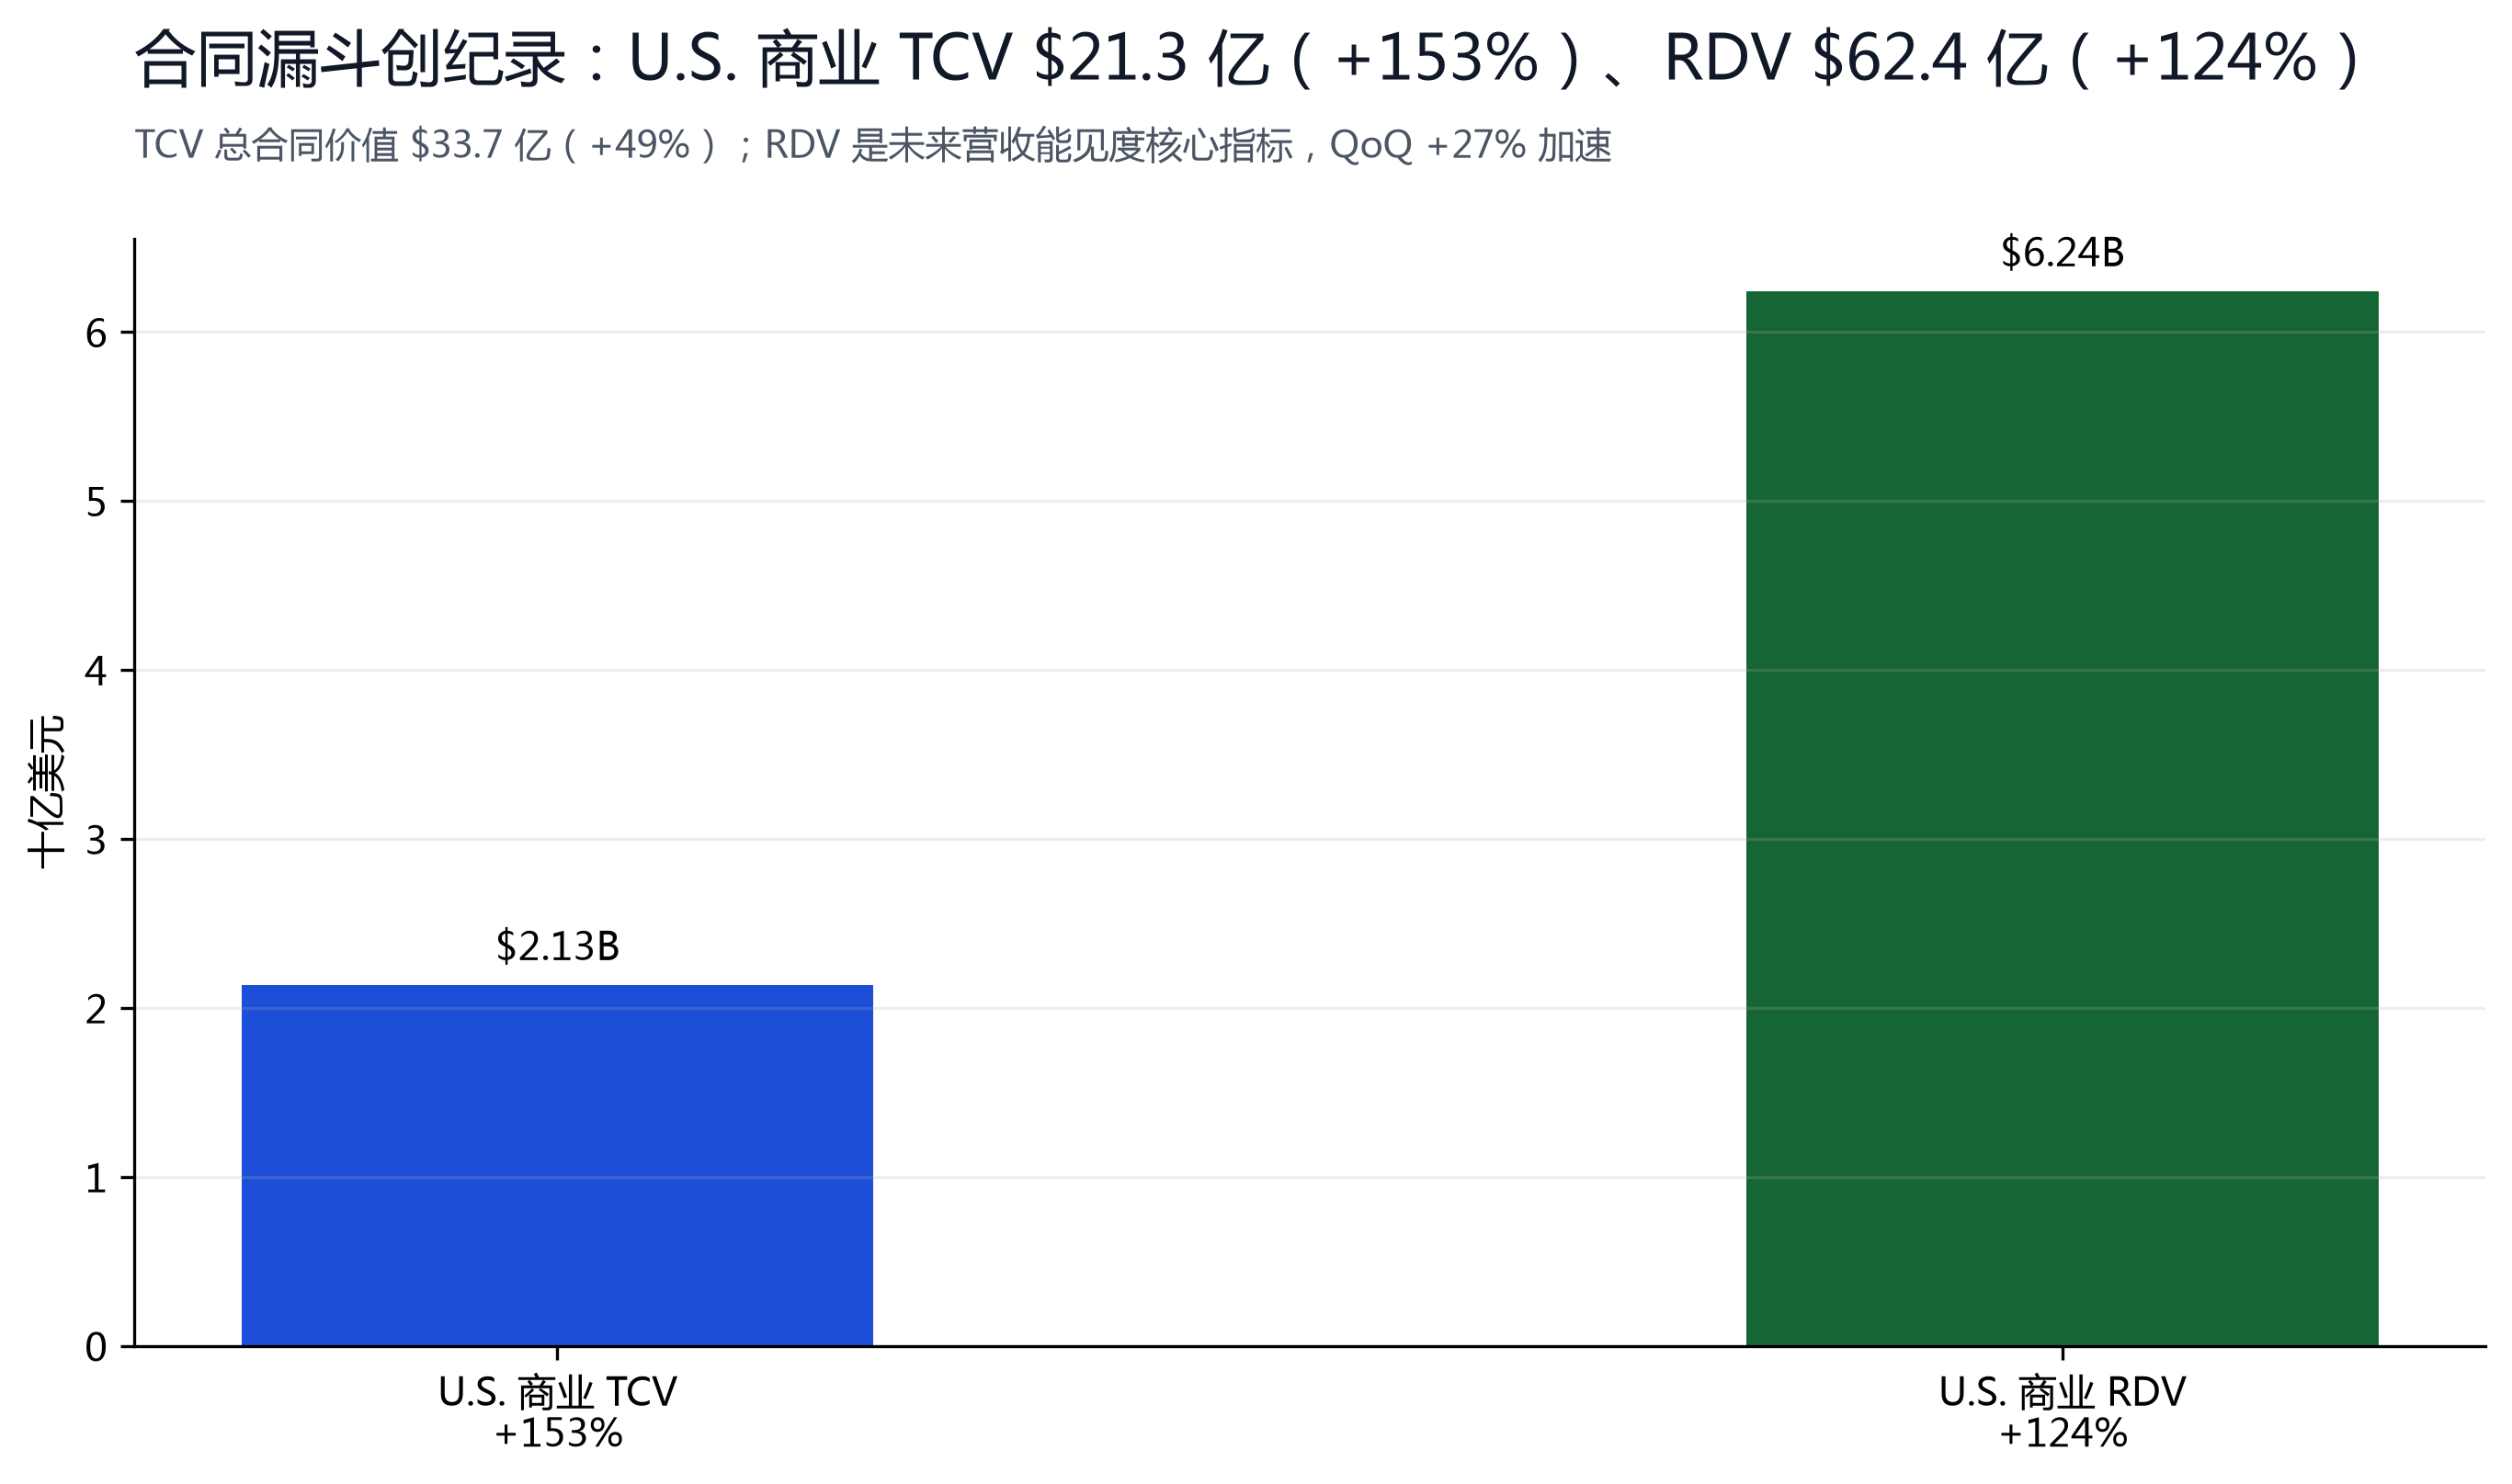
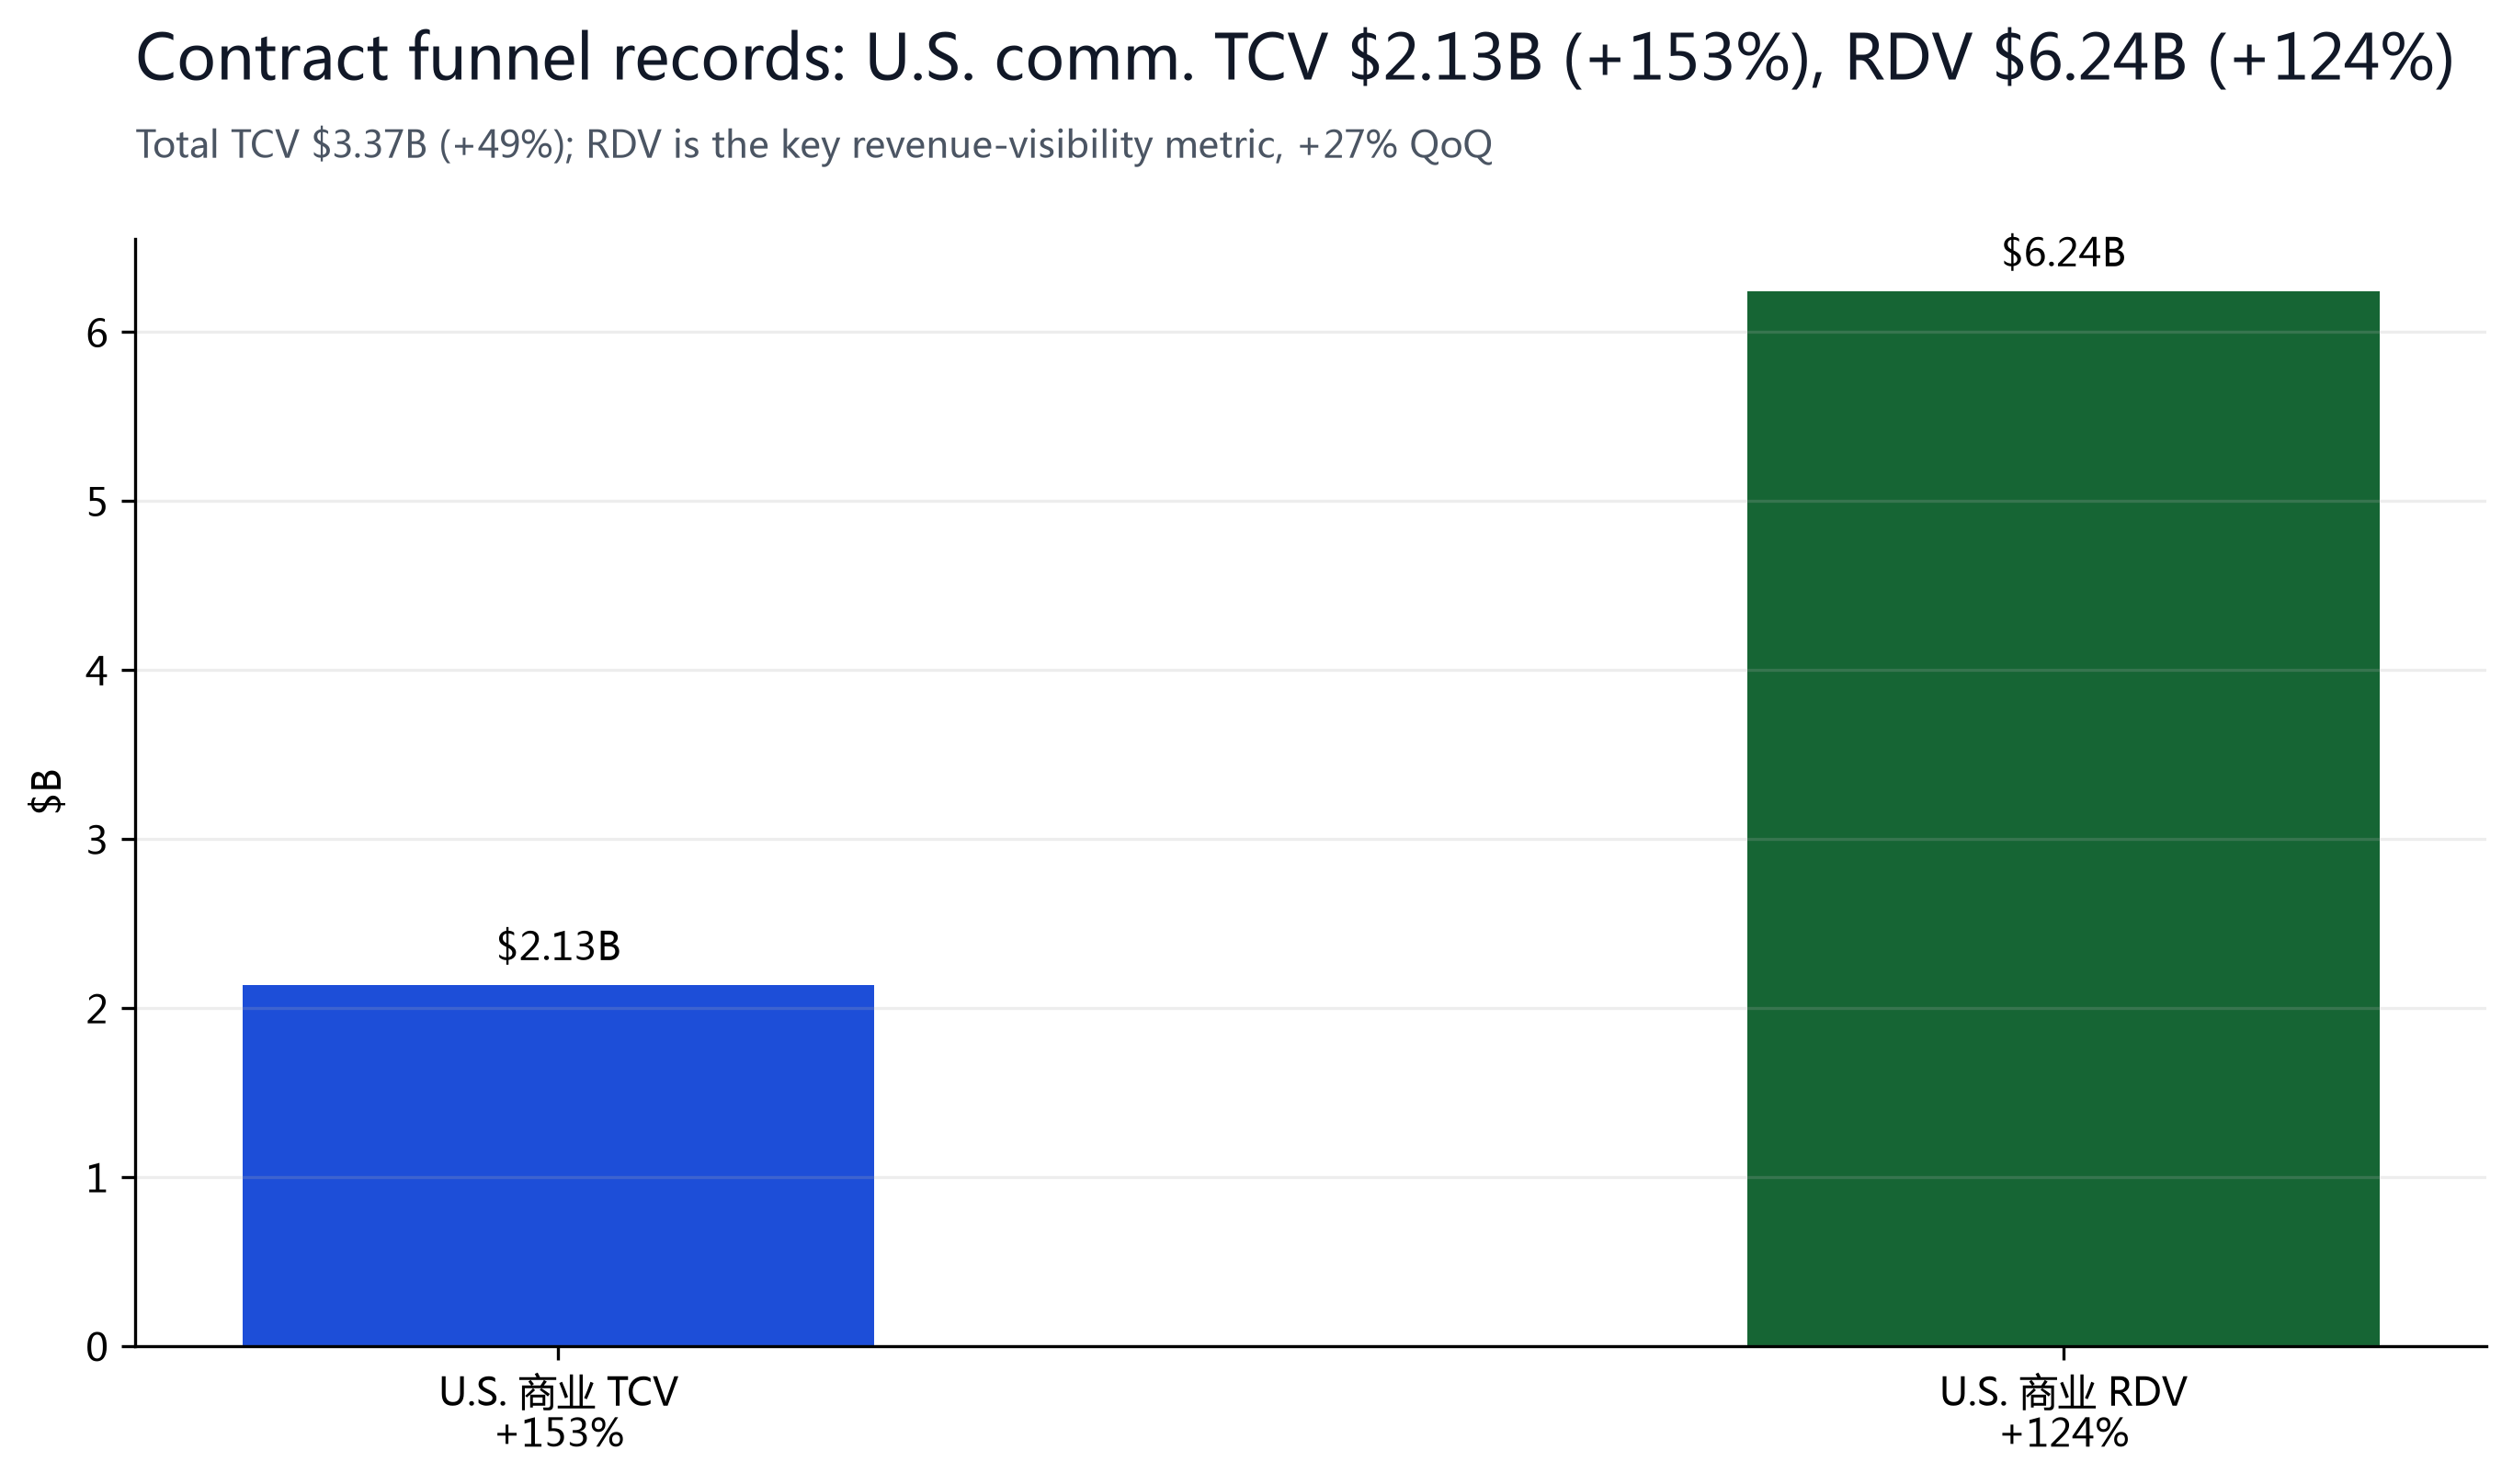
Q2'26 revenue of $1,935M (+93% YoY), net income of $1,062M (+225%, per 10-Q) and EPS of $0.41 (a 17.1% beat) all exceeded; U.S. commercial of $764M (+149%) and a record contract funnel (U.S. commercial TCV $2.13B +153%, U.S. commercial RDV $6.24B +124%) prove AIP has crossed the enterprise-AI pilot threshold — general models handle understanding and reasoning while Palantir connects them to an institution's unique reality and converts answers into auditable, executable production actions (Deutsche Bank's Zelnick calls Palantir a 'time traveler' that has reached the AI future others are still heading toward). Sovereign AI (customers own and control data, models and infrastructure) plus AIP Evolve (AI agents that test and swap models to optimize compute and token costs) form a differentiated moat; a gross margin of 84.7%, GAAP operating margin of 47.1%, adjusted operating margin of 62% and a Rule of 40 of 155% show strong operating leverage. FY26 guidance was raised $0.5B to $8.15-8.16B (+82%), Q3 guidance of $2.16B beat expectations by ~$0.2B, and the CEO says momentum lasts at least 18 months; crowded shorts have already suffered one squeeze, and the fundamentals-driven re-rating may continue.
Bear: 139x P/E priced for perfection, weak international, model labs moving down the stack
Valuation is the bear's core thesis: about 139x trailing GAAP EPS ($1.17) and 47.9x FY26E sales embed 80-90%+ growth with expanding margins for several more quarters — Benchmark's Li notes the valuation 'leaves little room for error on U.S. demand, lumpy deals, or international expansion.' Structurally, international is only ~19% of revenue (derived, ~$365M in Q2'26) and growing slower than the U.S., with monetization scale unproven; Q2'26 net income of $1.06B includes favorable tax items and SBC adjustments, so GAAP quality needs monitoring. Narratively, if model labs like OpenAI/Anthropic push down the stack (ChatGPT eating SaaS), AIP's 'model-agnostic middle layer' position could be eroded — the root of the 25% YTD decline before earnings and the reason Benchmark stays at Hold. Finally, the squeeze-driven overbought condition (RSI very likely overbought after +29.45% in a day) raises pullback risk.
§04Financial Truth
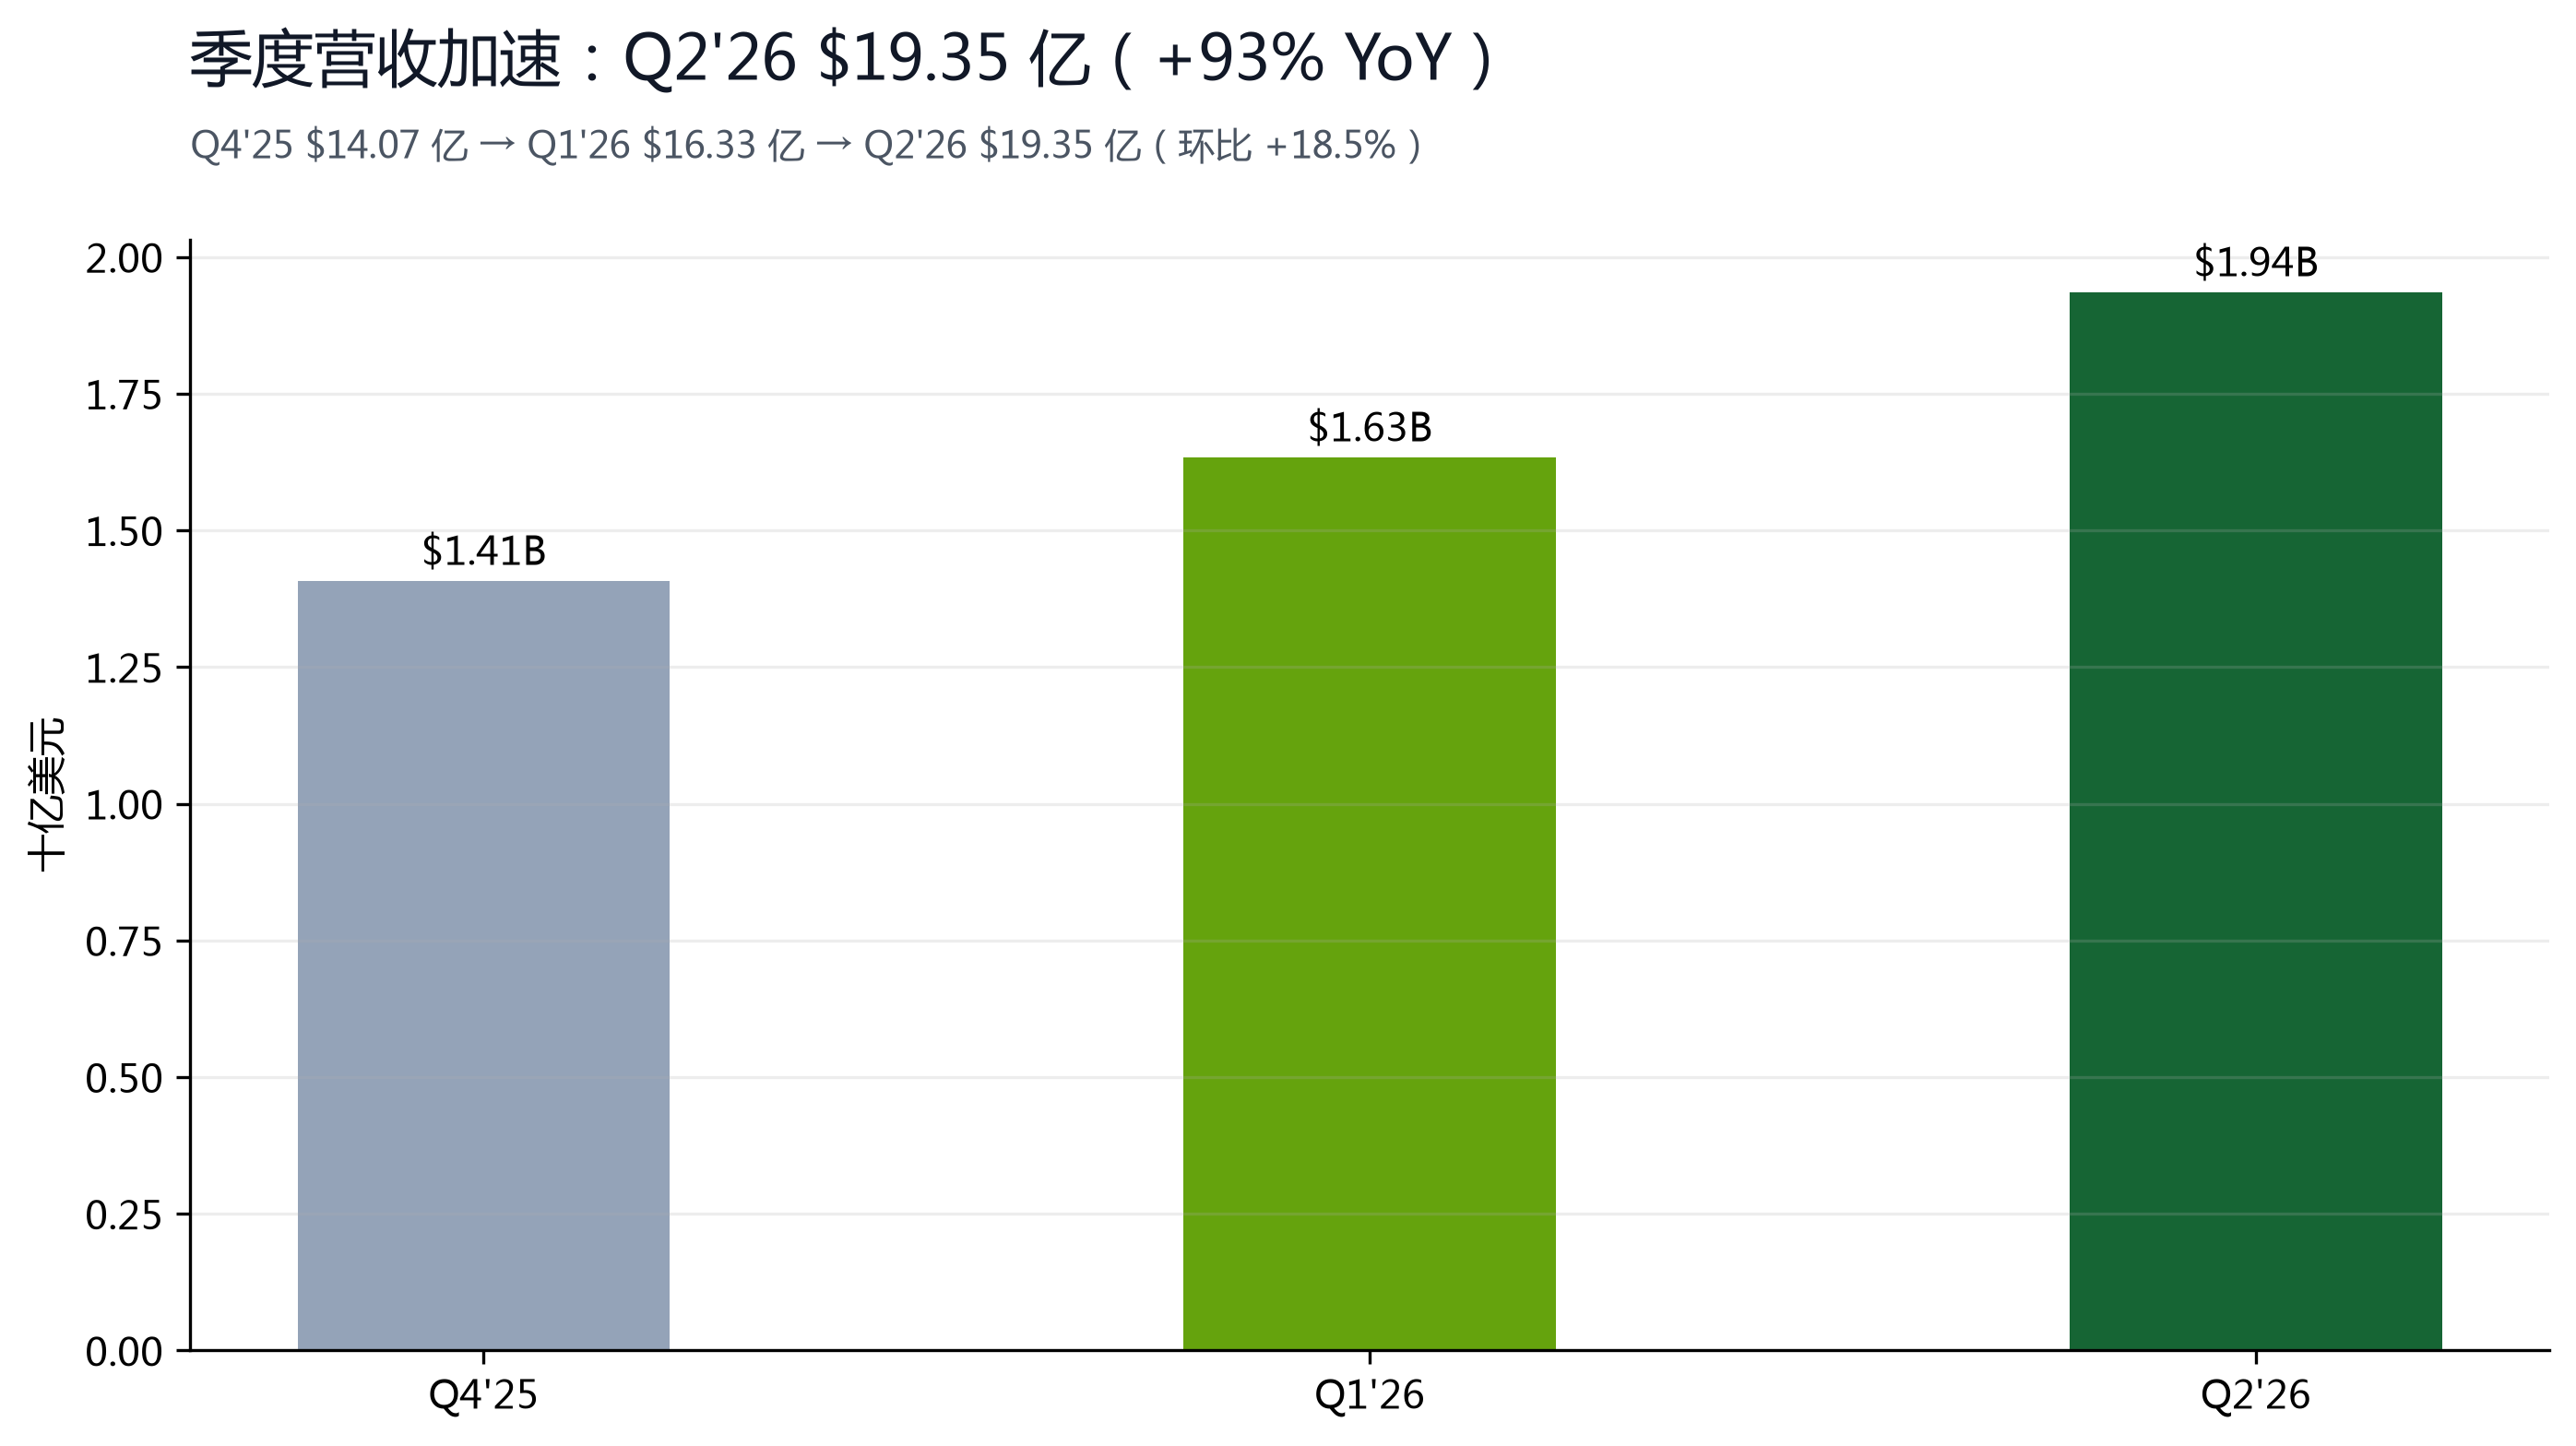
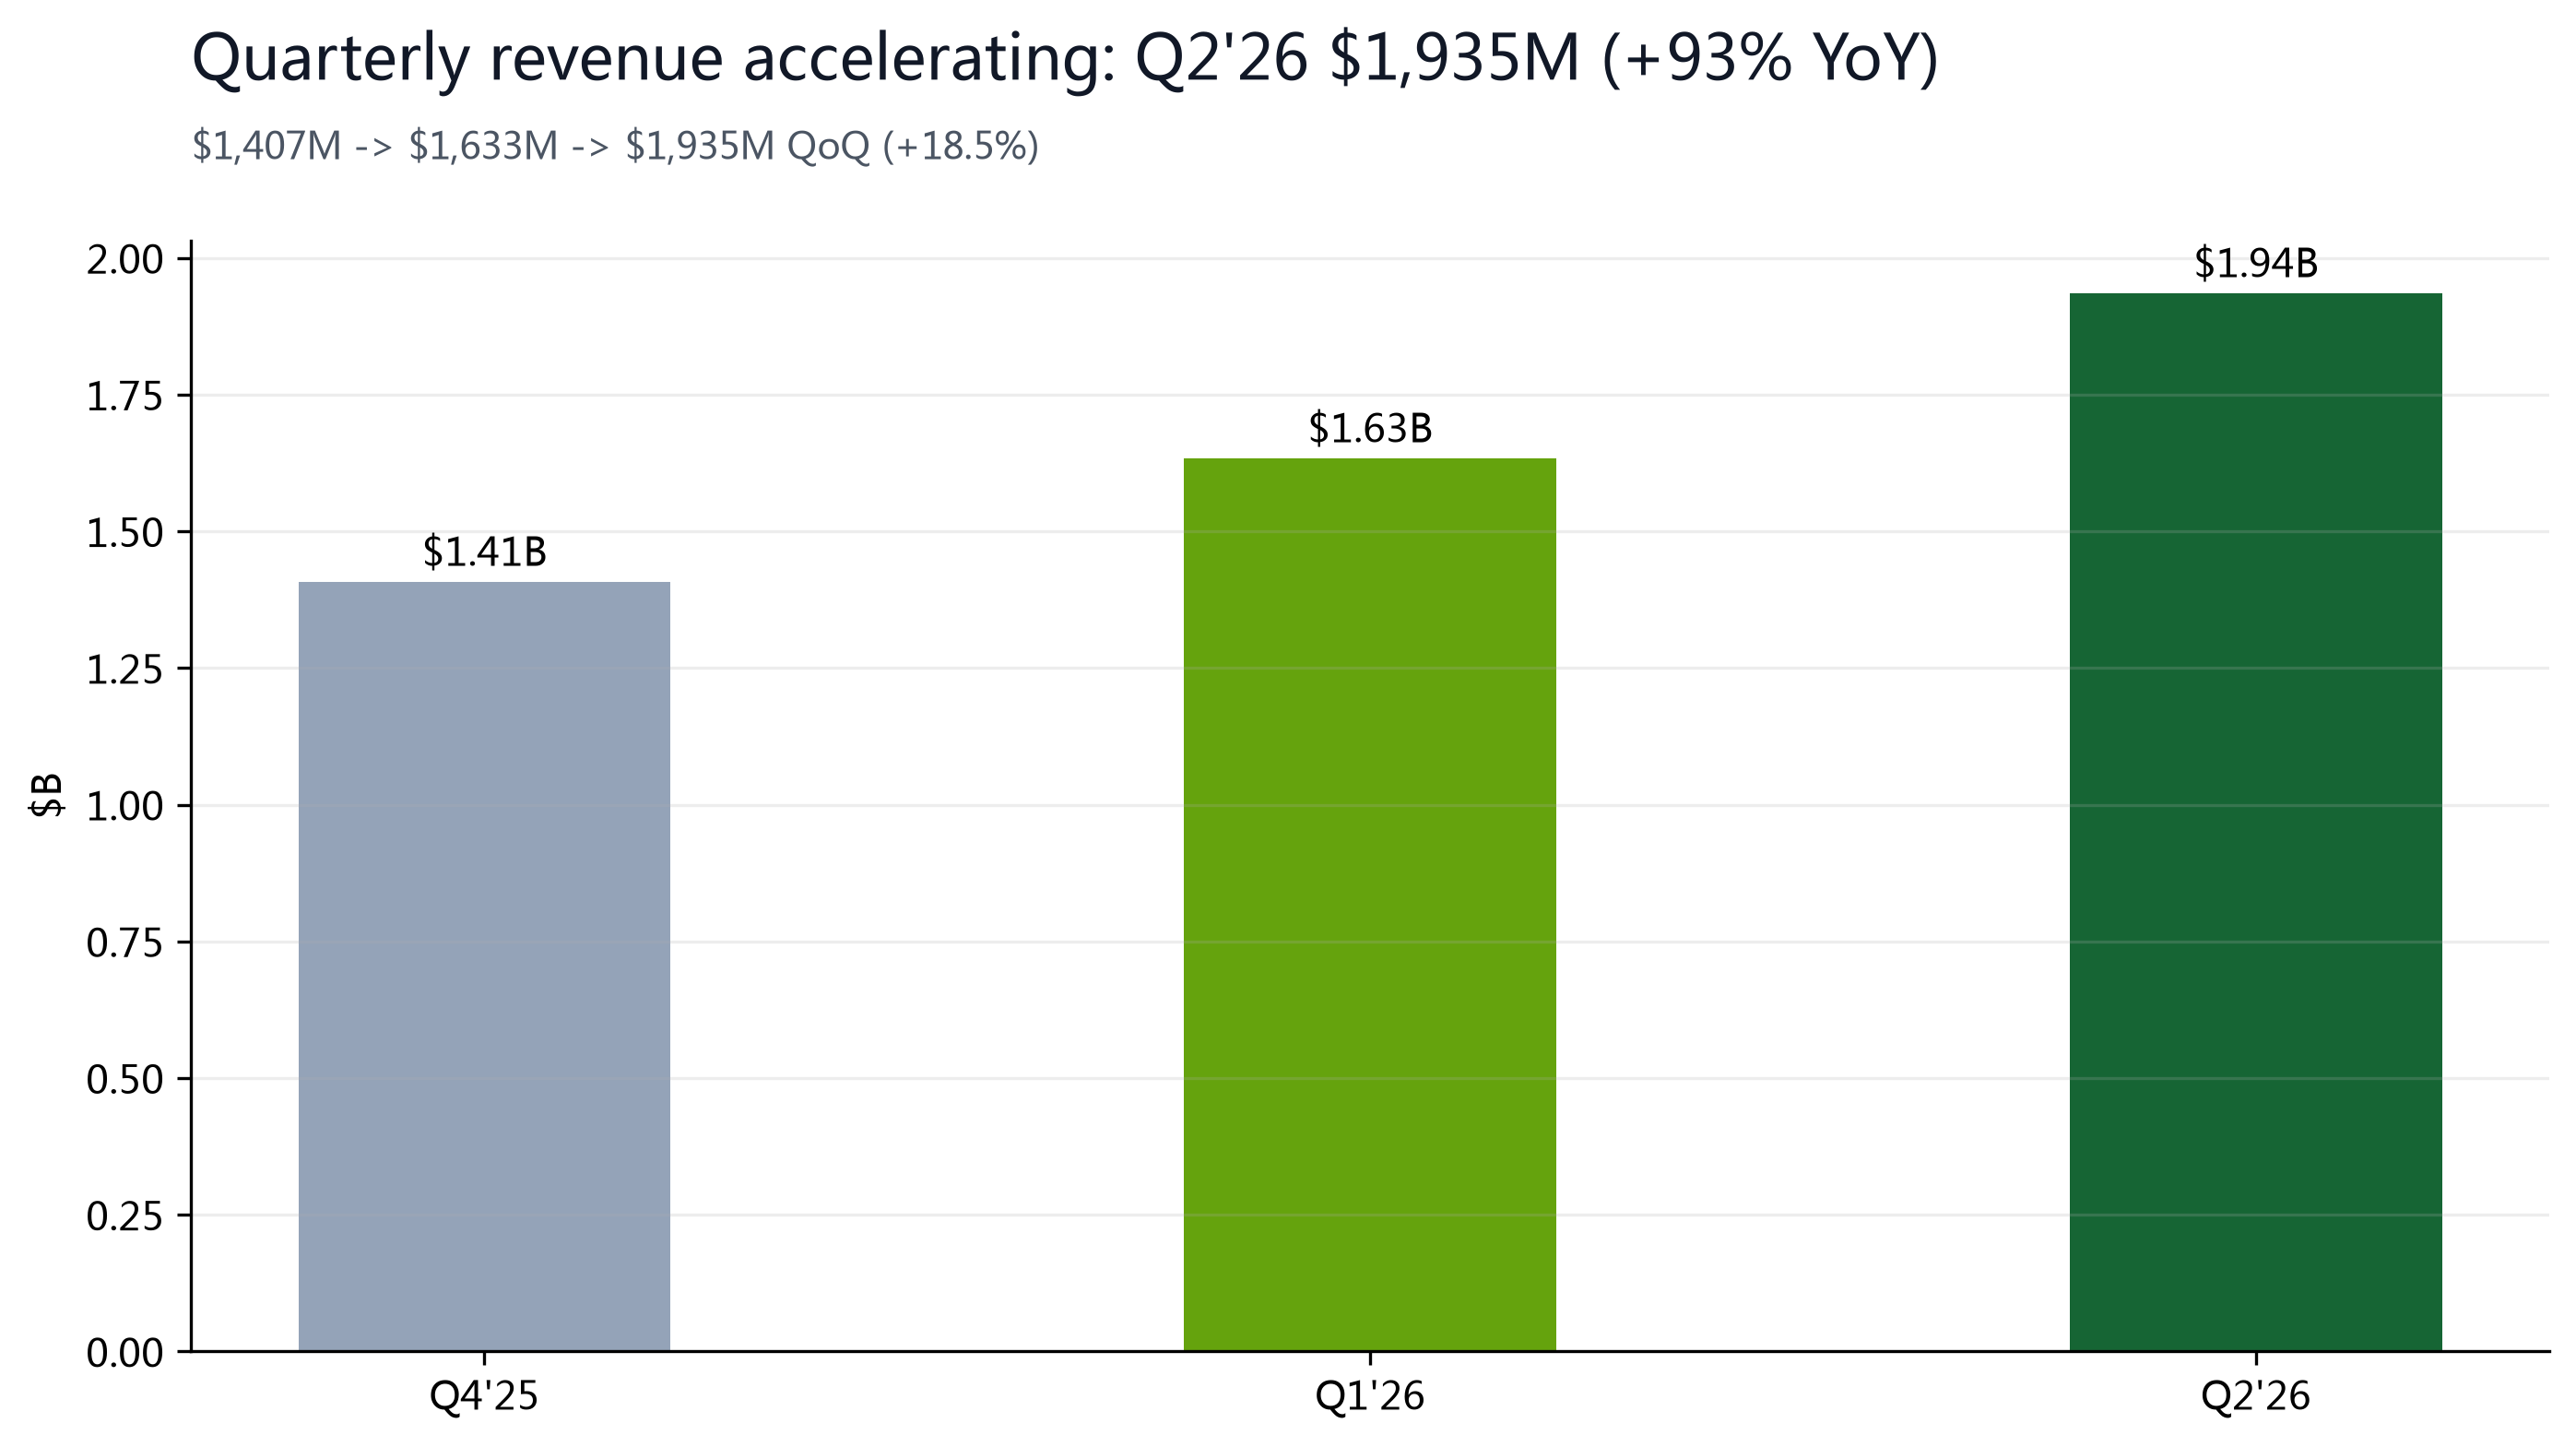
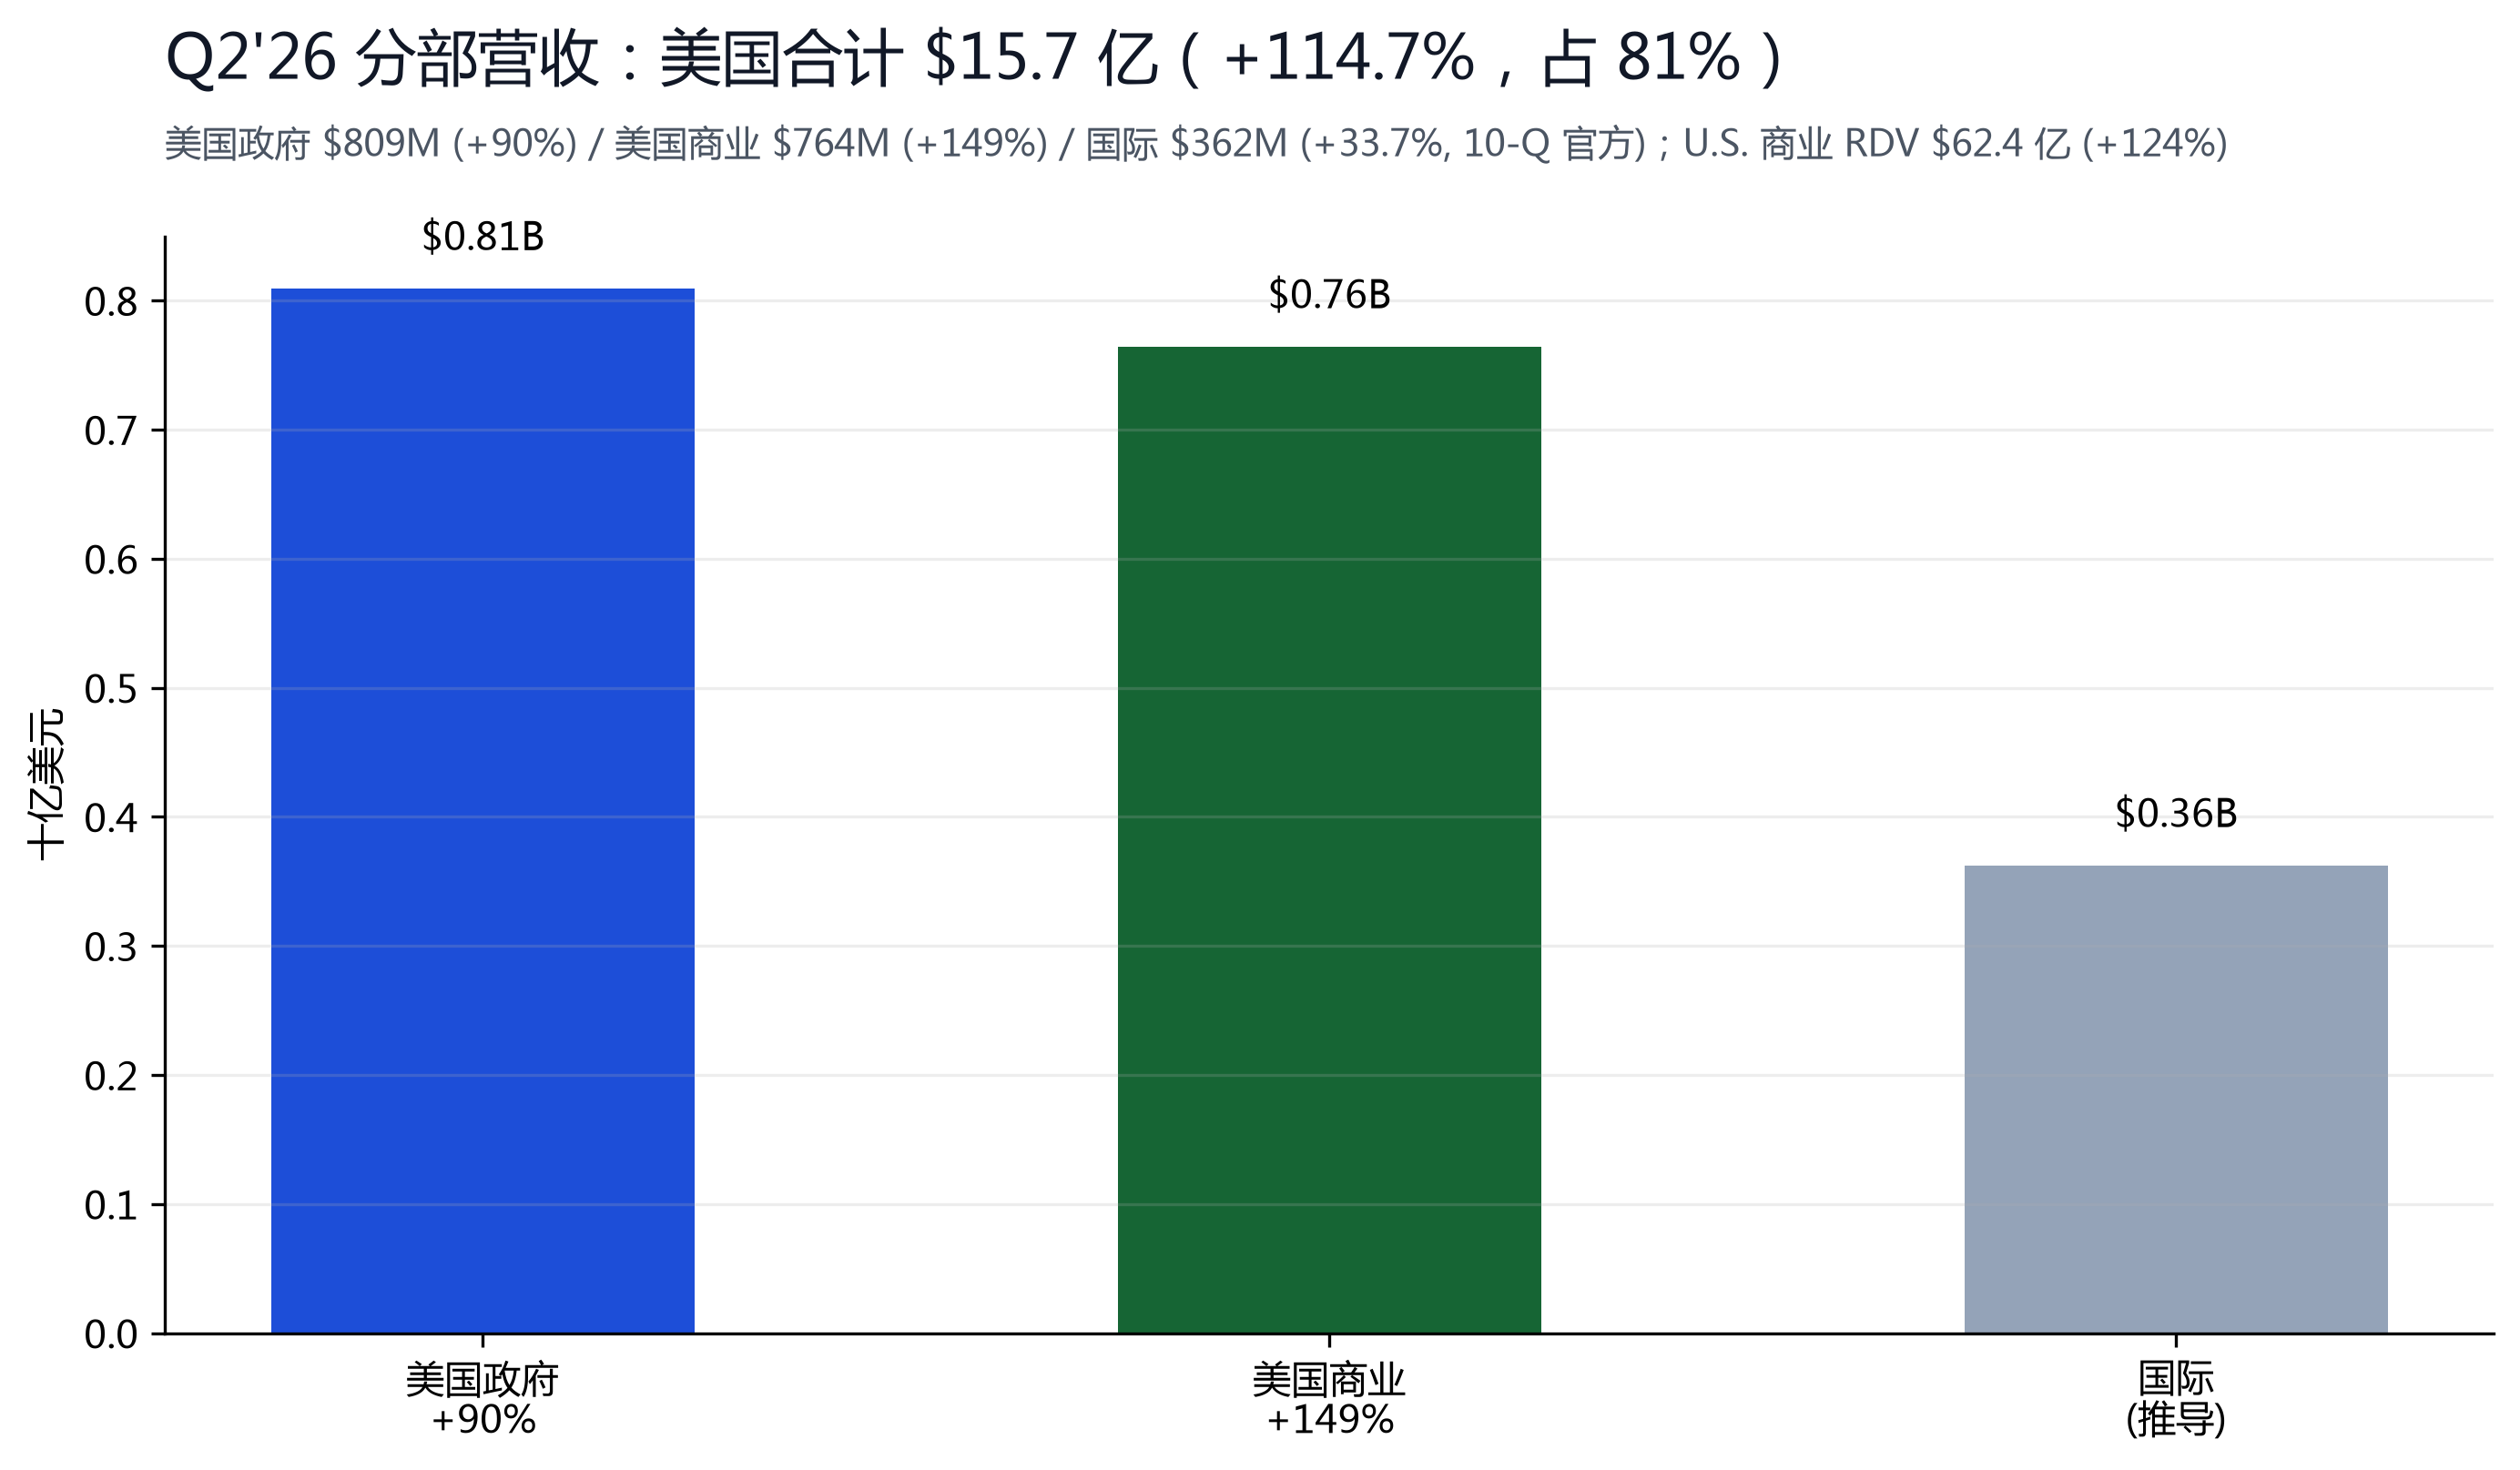
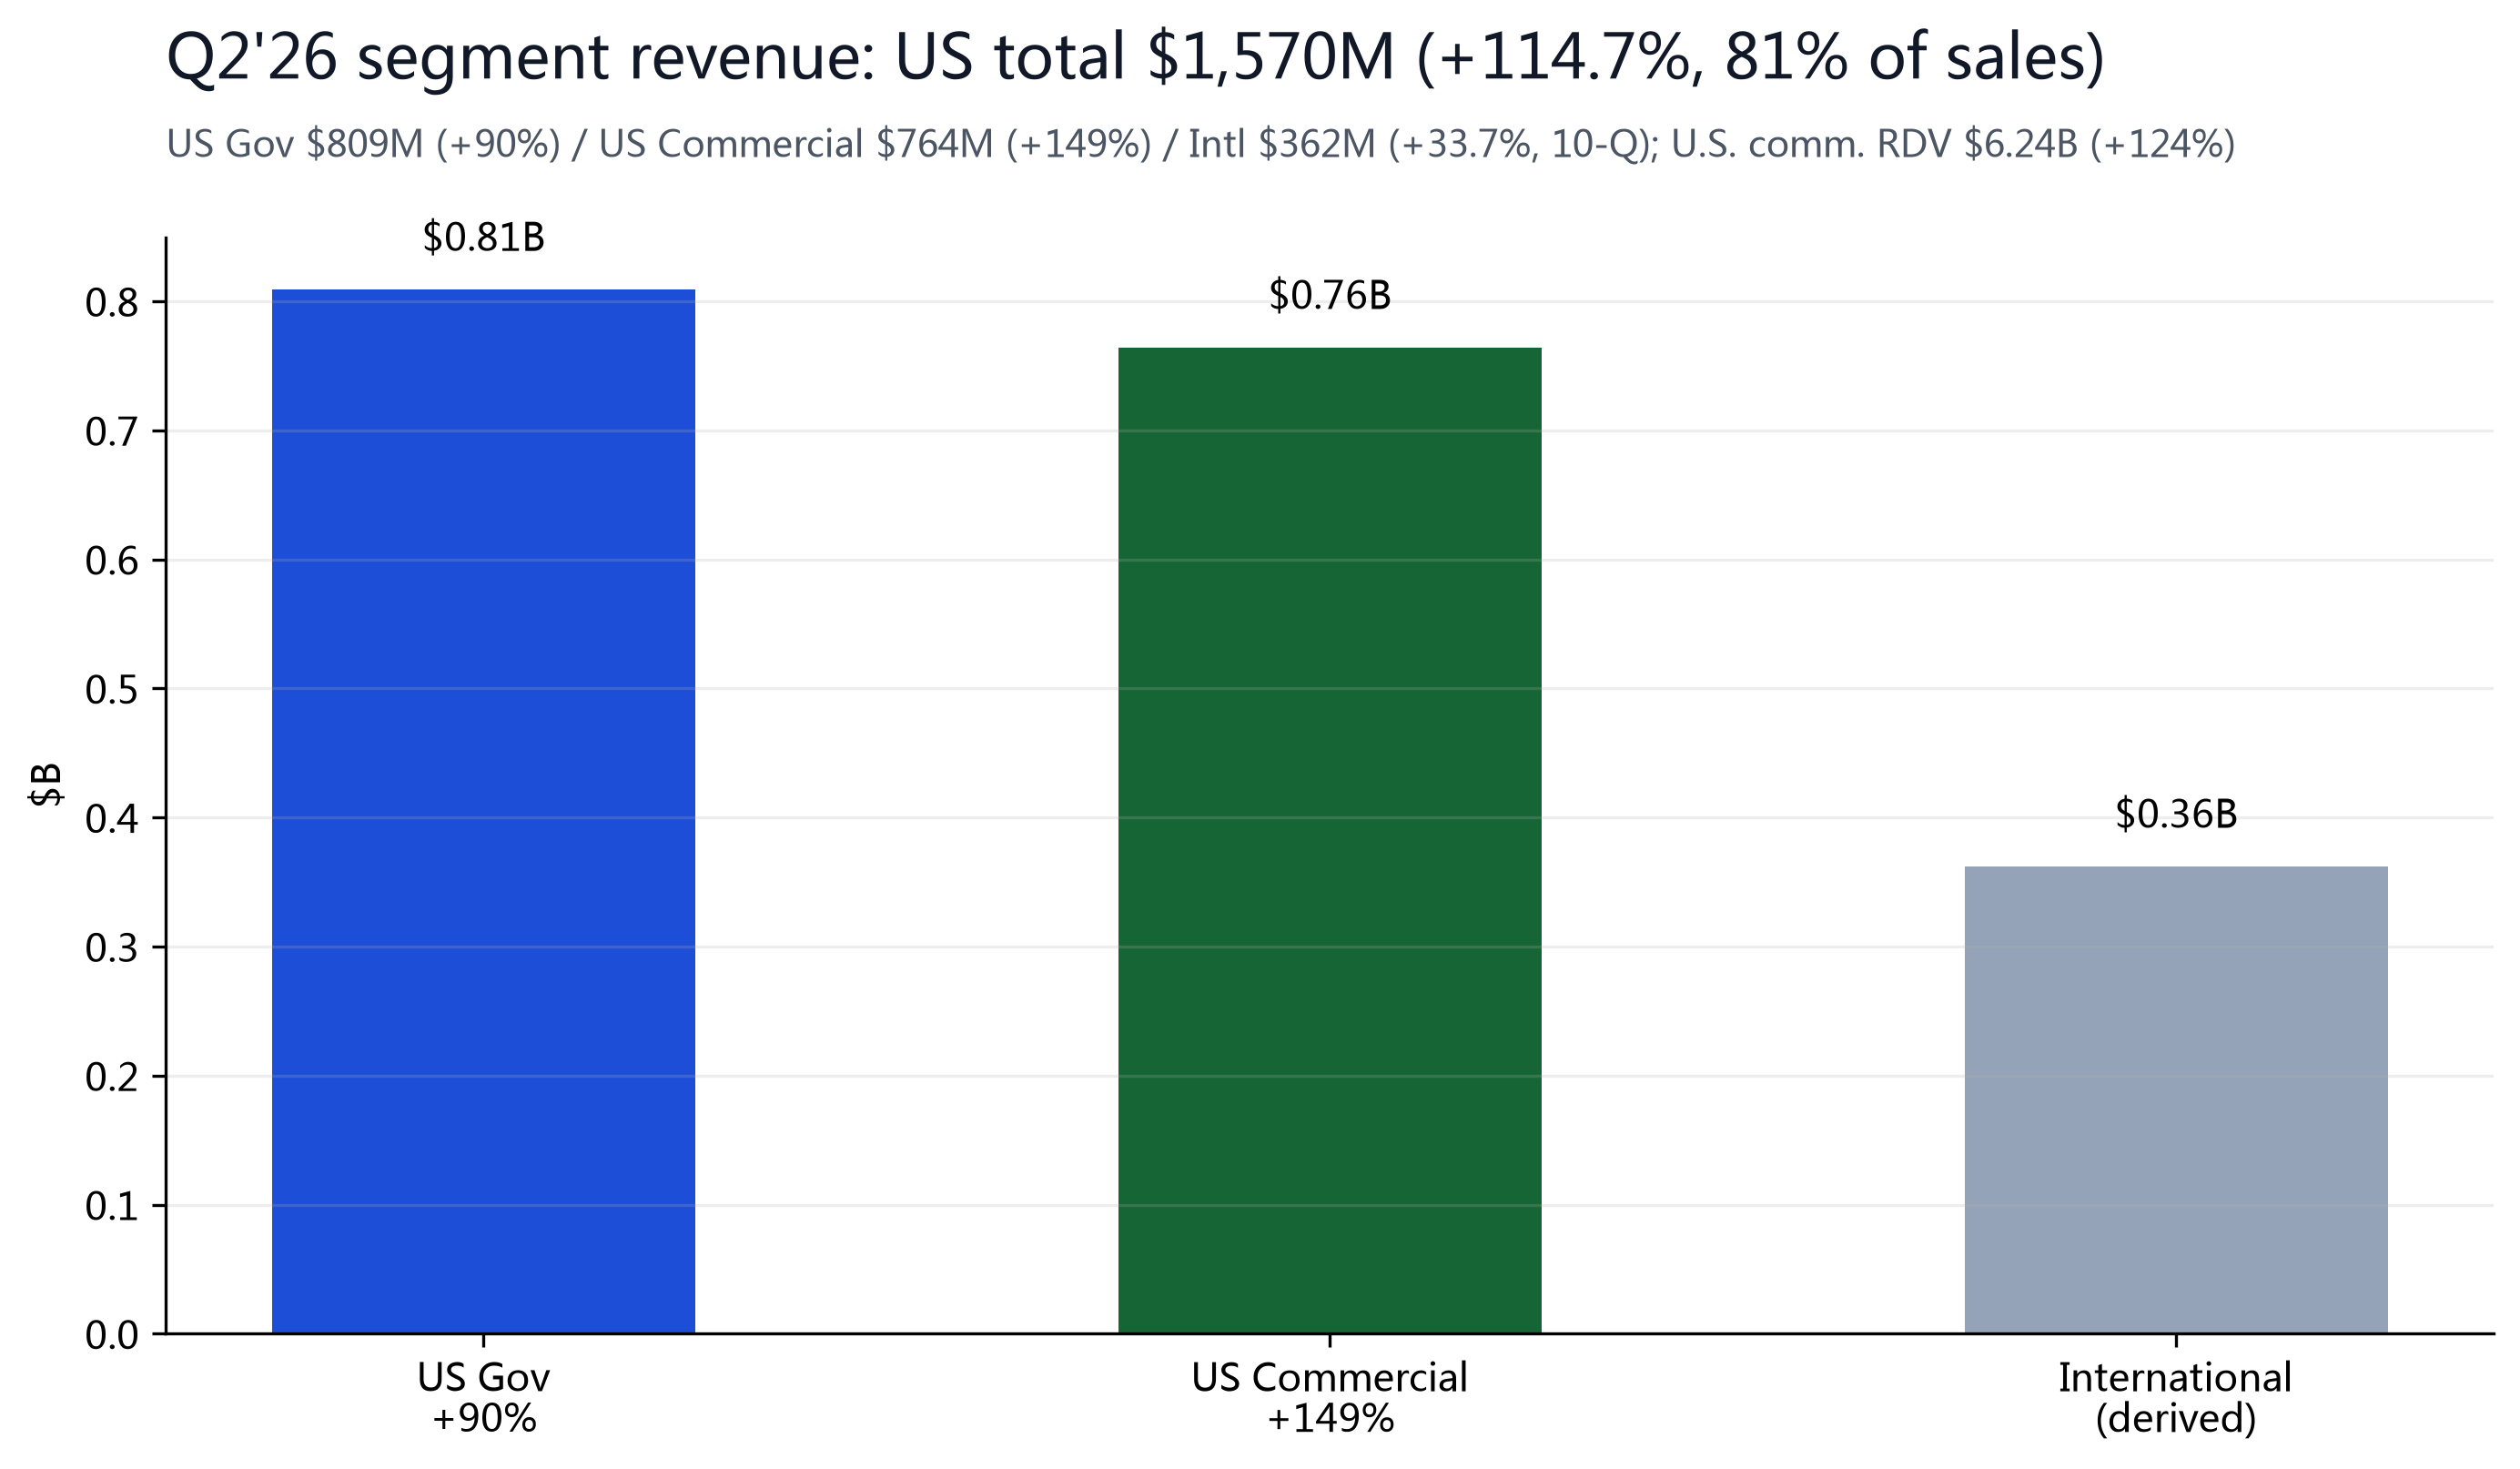
Q2'26 revenue of $1,935M (+93% YoY), GAAP net income of $1,062M (+225%, per 10-Q), diluted EPS of $0.41 (vs $0.35 expected, a 17.1% beat); gross margin 84.7%, GAAP operating margin 47.1% (five straight quarters of expansion), adjusted operating margin ~62%, Rule of 40 = 155% — a rare software asset with growth and profitability together. By segment: Government $990M (+79%), Commercial $945M (+110%); geographically U.S. total $1,570M (+114.7%, 81% of sales), international $362M (+33.7%, per 10-Q). Management raised FY26 guidance sharply: revenue $8.15-8.16B (from $7.65B, +82% YoY), U.S. commercial >$3.42B (+134%), adjusted operating income $4.89-4.90B, free cash flow $4.5-4.7B; Q3 revenue guided to $2.16-2.16B (vs ~$2.0B expected).
| Metric ($M) | Q2'25 | Q4'25 | Q1'26 | Q2'26 |
|---|---|---|---|---|
| Revenue | ~1,003* | 1,407 | 1,633 | 1,935 |
| YoY growth | — | — | — | +93% |
| GAAP net income | — | — | — | 1,062 (+225%) |
| Diluted EPS | — | $0.25 | $0.33 | $0.41 |
*Q2'25 revenue derived as $1,935M / 1.93 (~$1,003M); Q2'26 net income and segments are as disclosed. U.S. commercial RDV of $6,240M (+124%) is the key forward-visibility metric.
| FY26 guidance (post-Aug 3 raise) | 数值 | Note |
|---|---|---|
| Revenue | $81.50-81.58 亿 | 旧指引 $76.5 亿;+82% YoY |
| U.S. commercial | >$34.24 亿 | 至少 +134% YoY |
| Adjusted op. income | $48.89-48.97 亿 | 调整后营业利润率约 60% |
| Free cash flow | $45-47 亿 | FCF 利润率约 56% |
| Q3 revenue guide | $21.60-21.64 亿 | 市场预期约 $20 亿 |
§05Peer Comparables
Palantir has no precise peer in enterprise-AI application software — it spans data analytics (Foundry), defense intelligence (Gotham) and enterprise AI agents (AIP) simultaneously. Comparisons fall into two layers: on valuation, at ~47.9x FY26E sales and 139x trailing P/E it trades far above traditional enterprise software (Salesforce/ServiceNow typically 20-40x P/E, 8-15x P/S) and closer to high-growth AI concept names; on growth, +93% revenue growth is nearly unmatched among large software firms (CEO Karp: 'no one can grow at half our rate'), with U.S. commercial +149% and U.S. commercial RDV +124% as the core evidence. The market prices PLTR essentially as an option on the AI-application-layer winner — Deutsche Bank upgraded to Buy ($200 target) on the view that it leads other AI application software 'by several lengths,' while Benchmark holds (valuation and internationalization concerns); the bull-bear debate centers on whether high growth can persist at 40x+ P/S. The following multiples are qualitative references only; source timings differ.
| PLTR's own multiples | Value | Note |
|---|---|---|
| P/E (TTM, GAAP $1.17) | 139.1x | computed |
| Forward P/E | 86.2x | consensus |
| P/S (TTM, $6.16B) | 63.5x | computed |
| P/S (FY26E, $8.155B) | 47.9x | guidance mid |
| EV / Sales (FY26E) | ~47x | 净现金轻微, 近似市值 |
| Beta / Dividend | 1.56 / 0% | 高波动, 无股息 |
§06Ownership
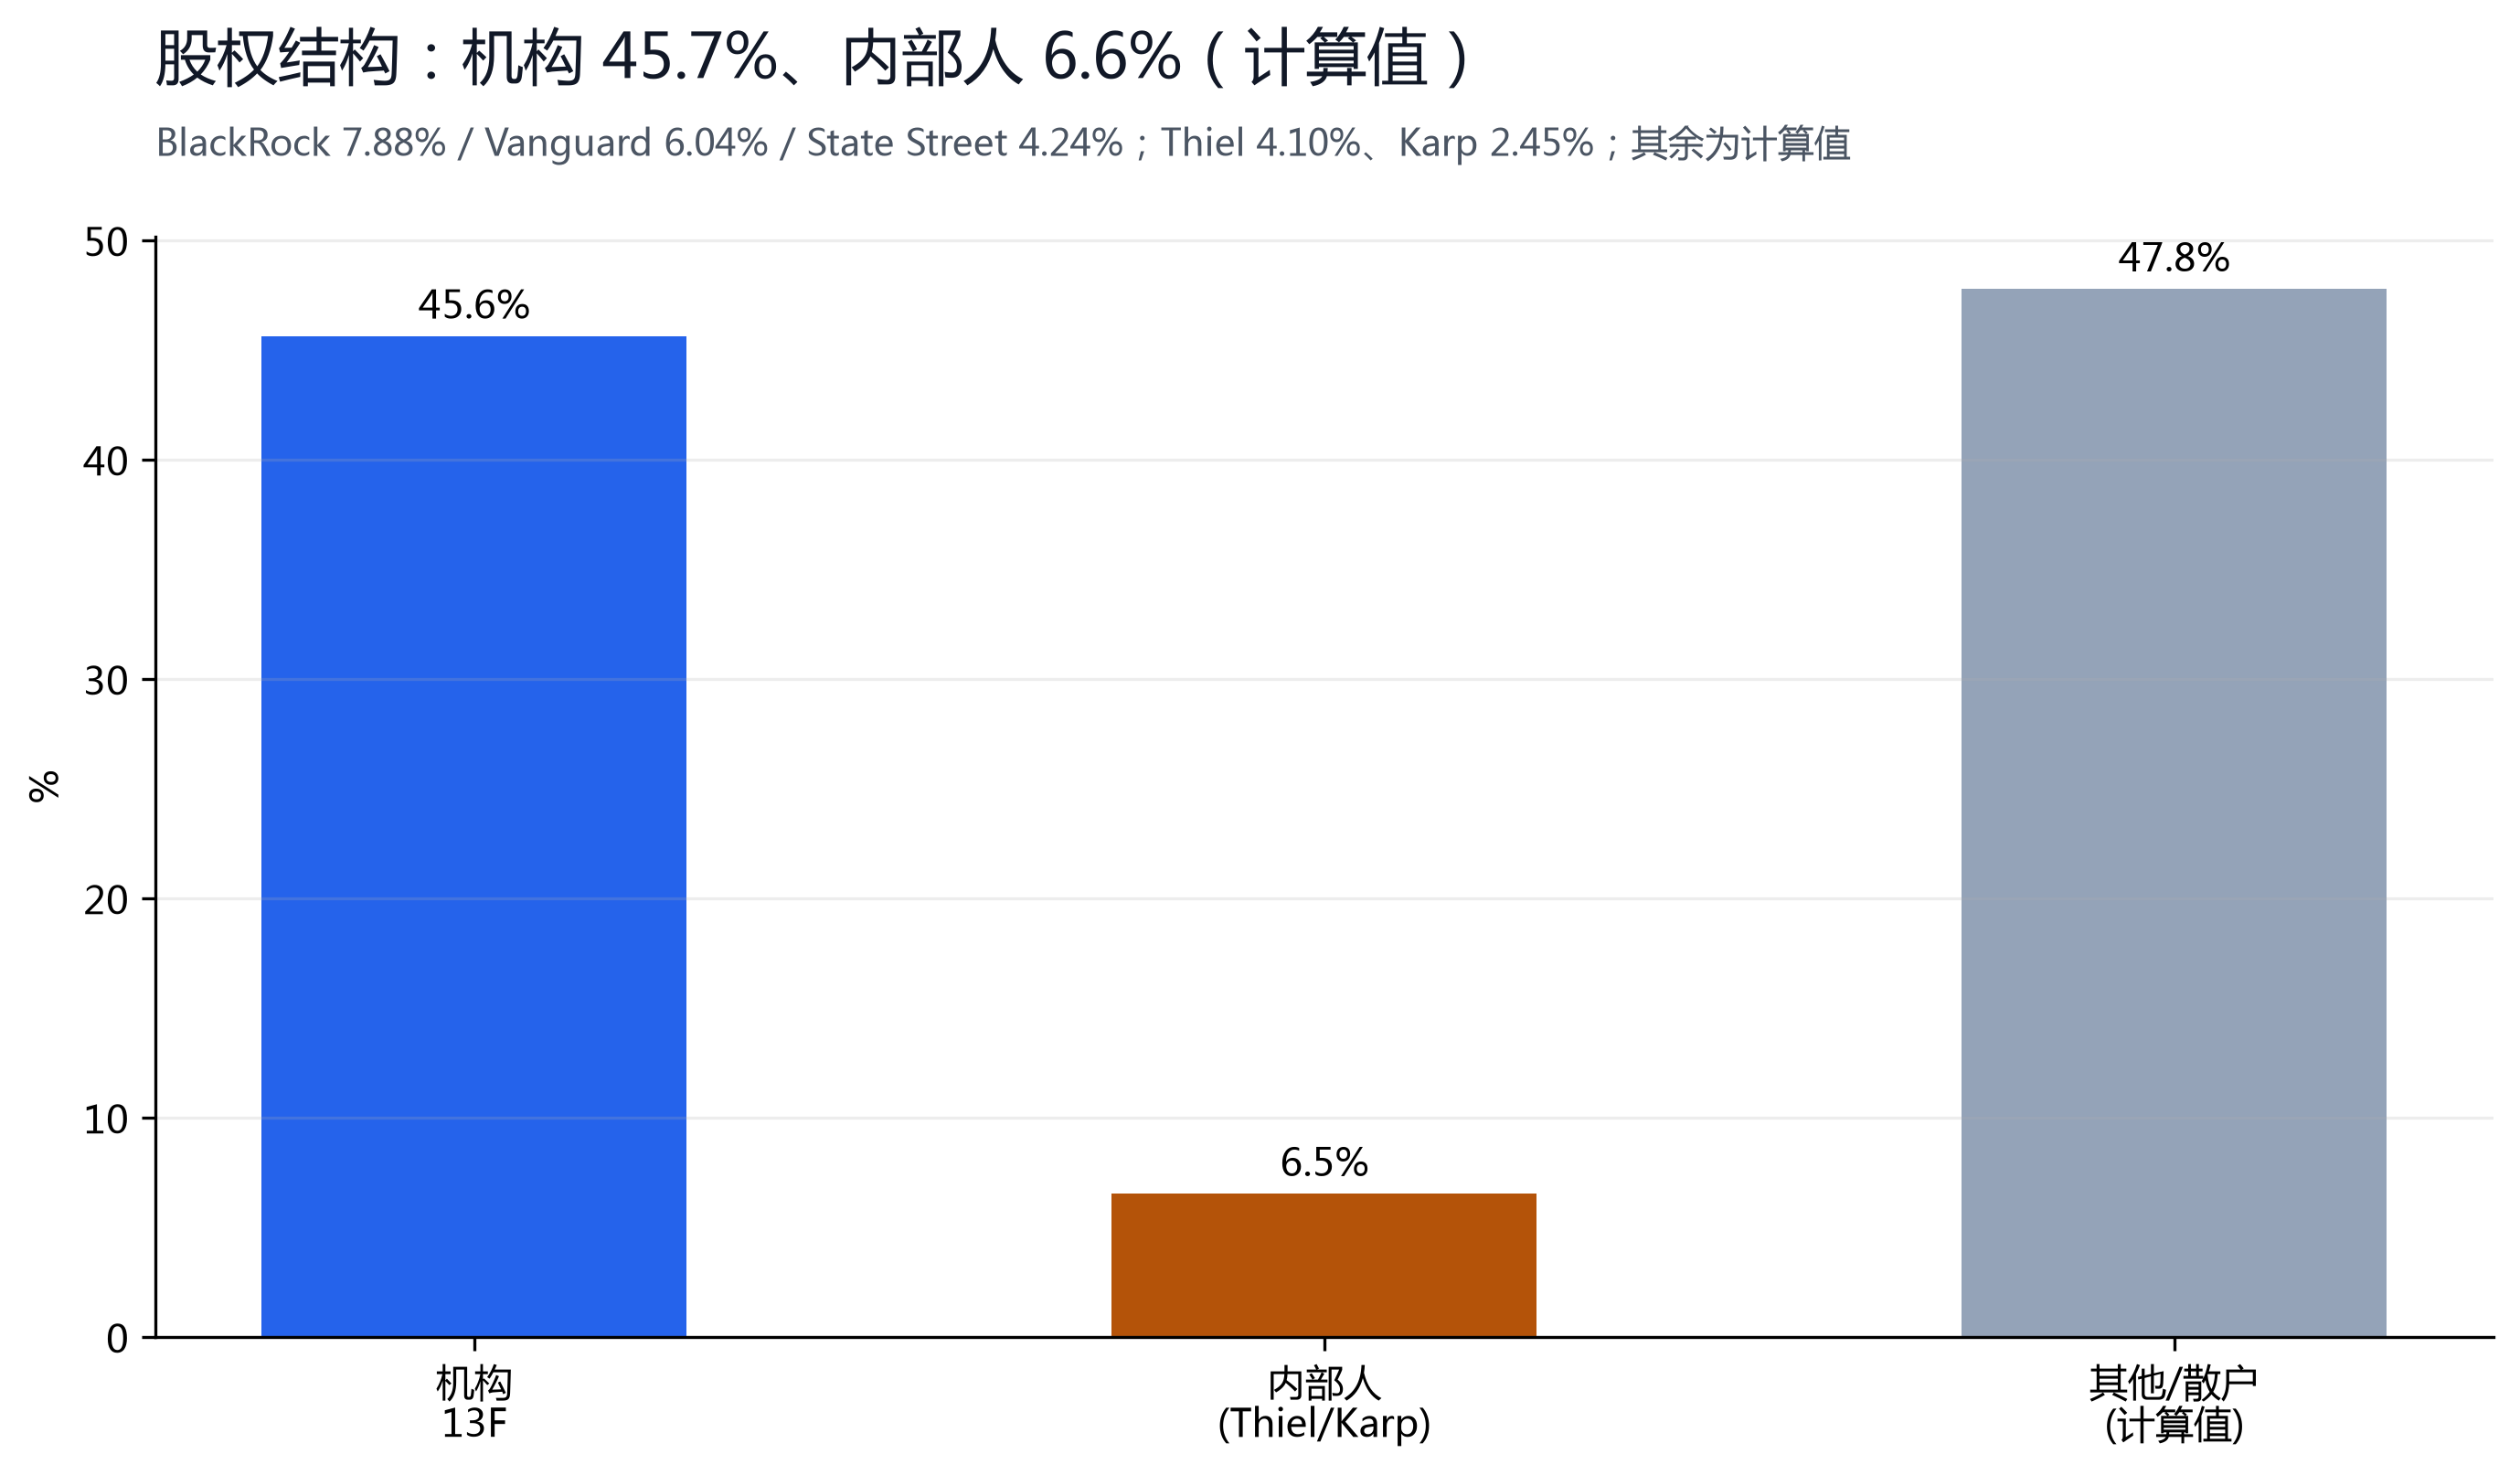
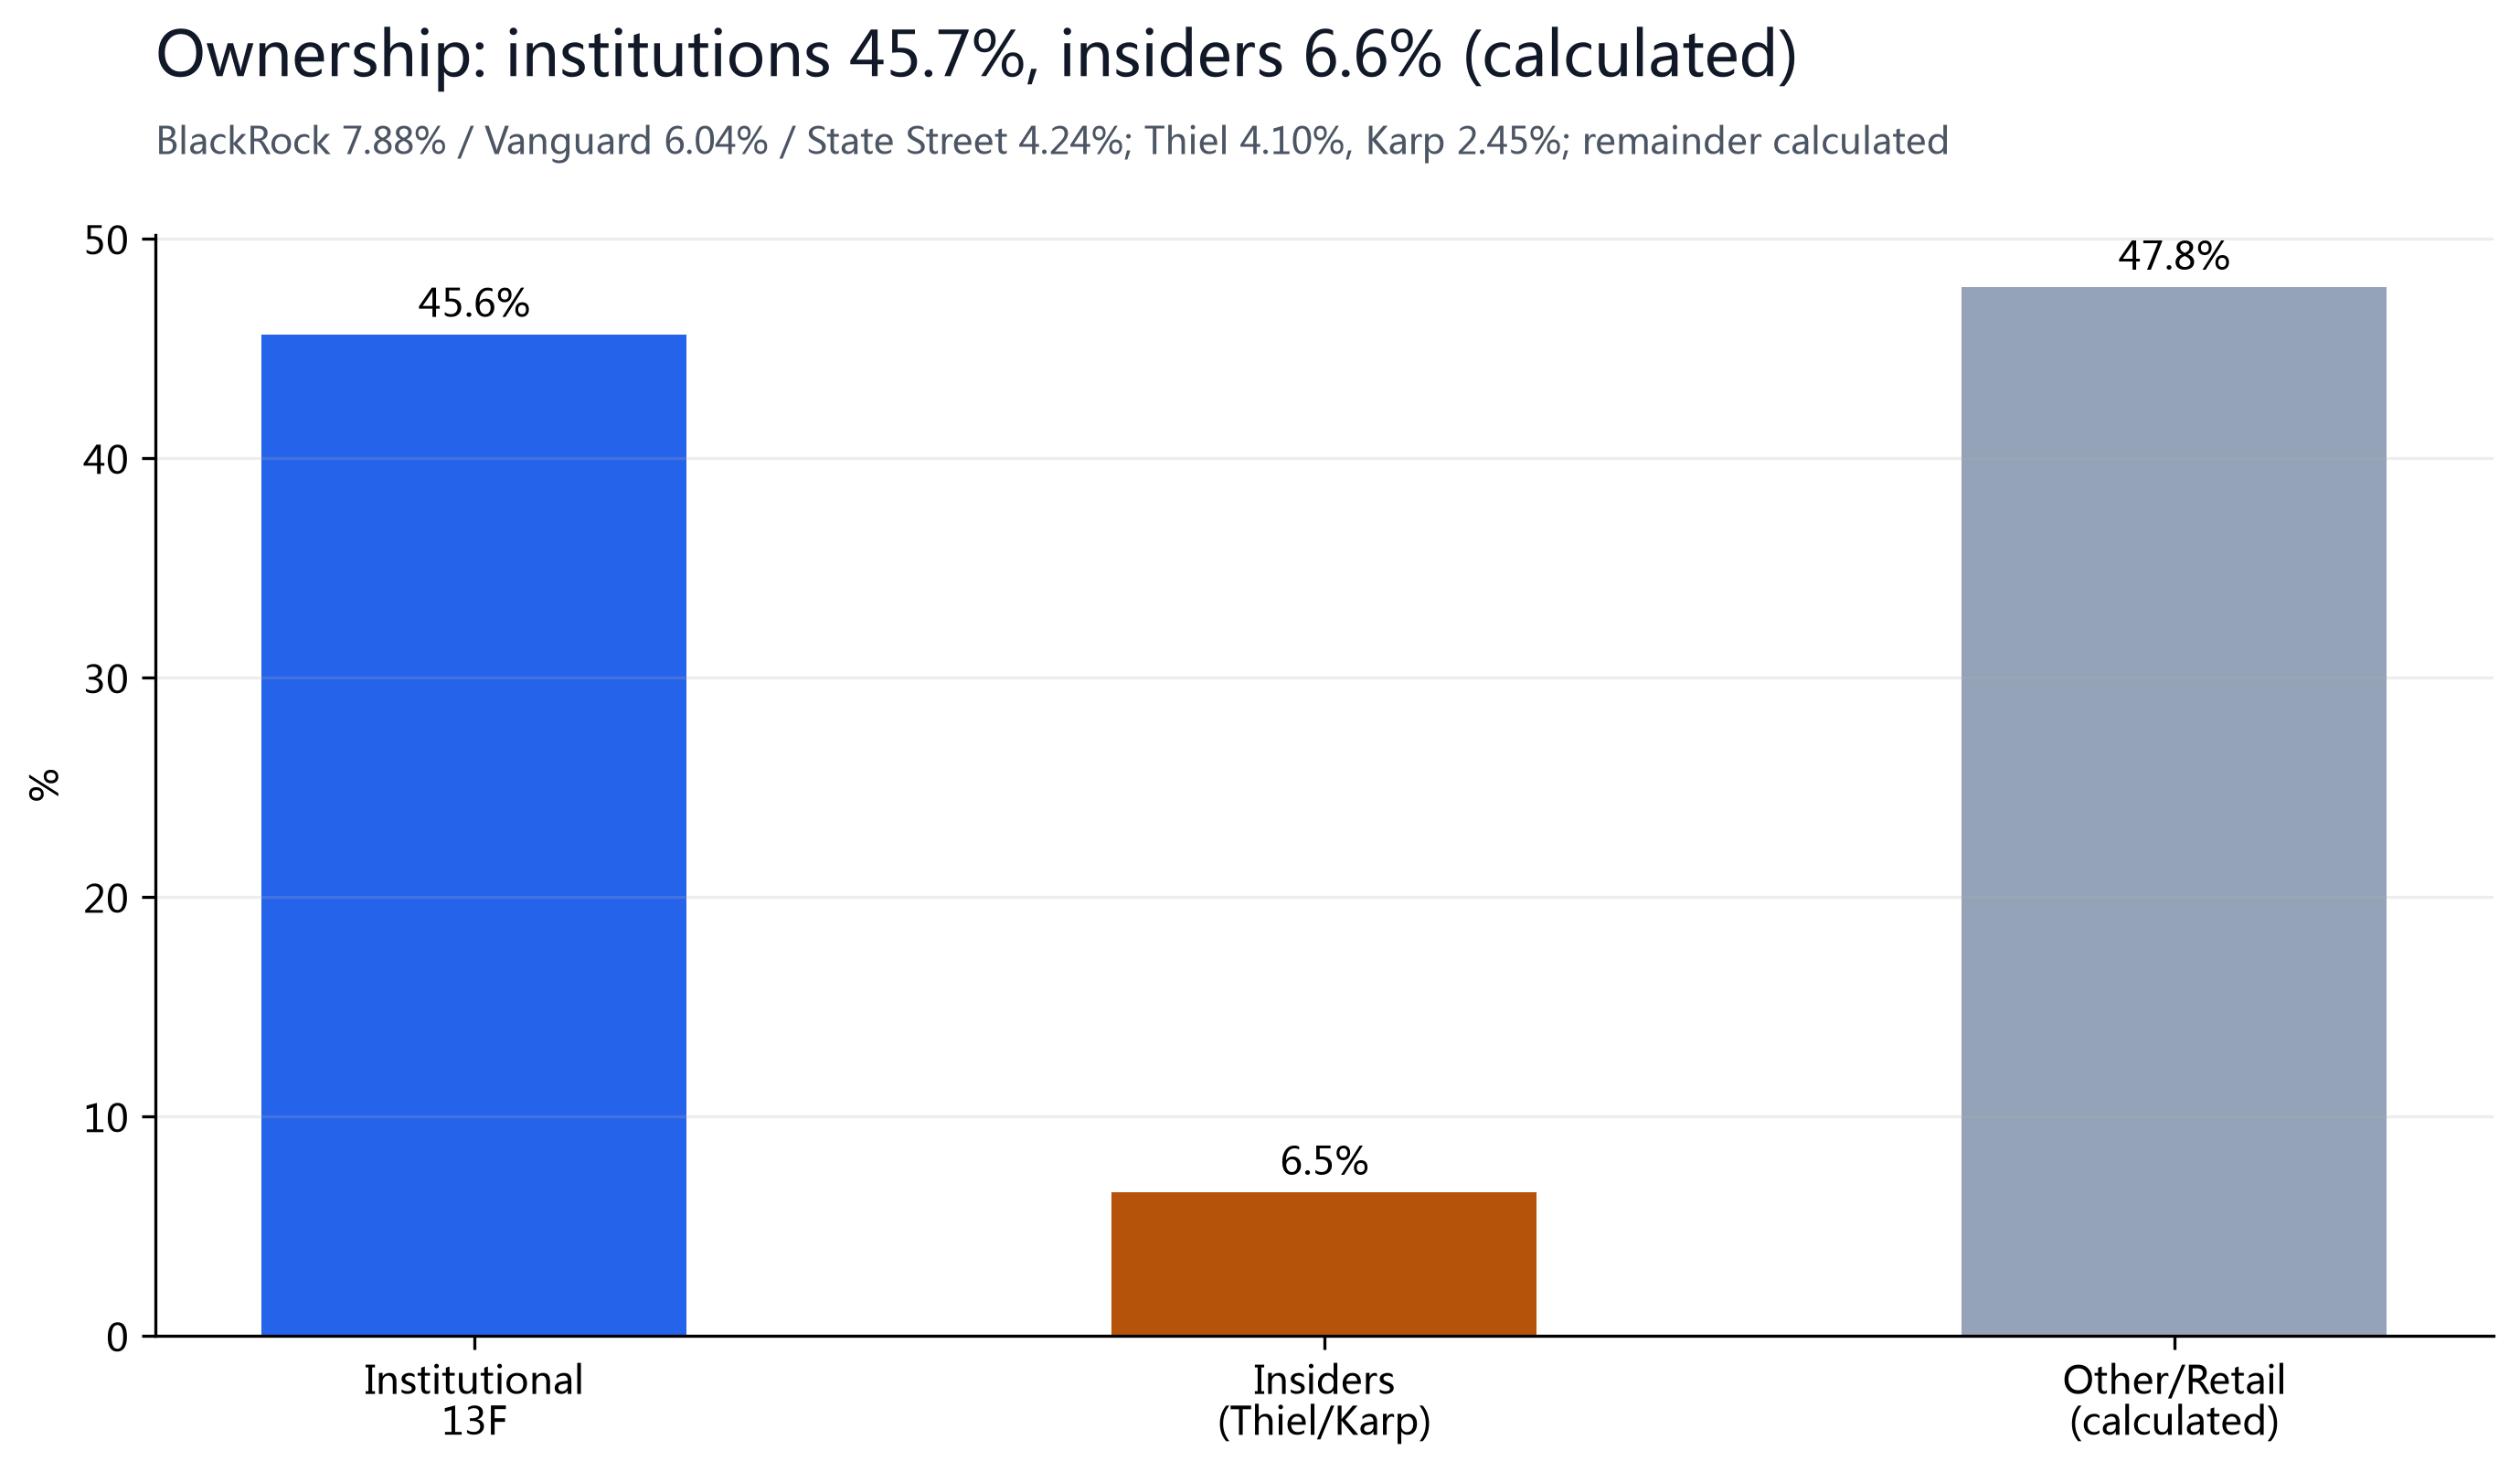
Institutions hold ~45.7% (marketbeat, 13F basis), with BlackRock (7.88%), Vanguard (6.04%) and State Street (4.24%) as the top three; insiders Peter Thiel holds 4.10% and CEO Alex Karp 2.45% (as of 2026-03-31). PLTR uses a dual-class structure, with Karp and Thiel retaining control through Class B super-voting shares (after a September 2025 voting-rights adjustment, Class B held roughly 49% of votes; exact figures per the latest 10-Q). U.S. congressional trade disclosures (STOCK Act) show 13 related lines, immaterial in size.
§07Valuation and Price Target
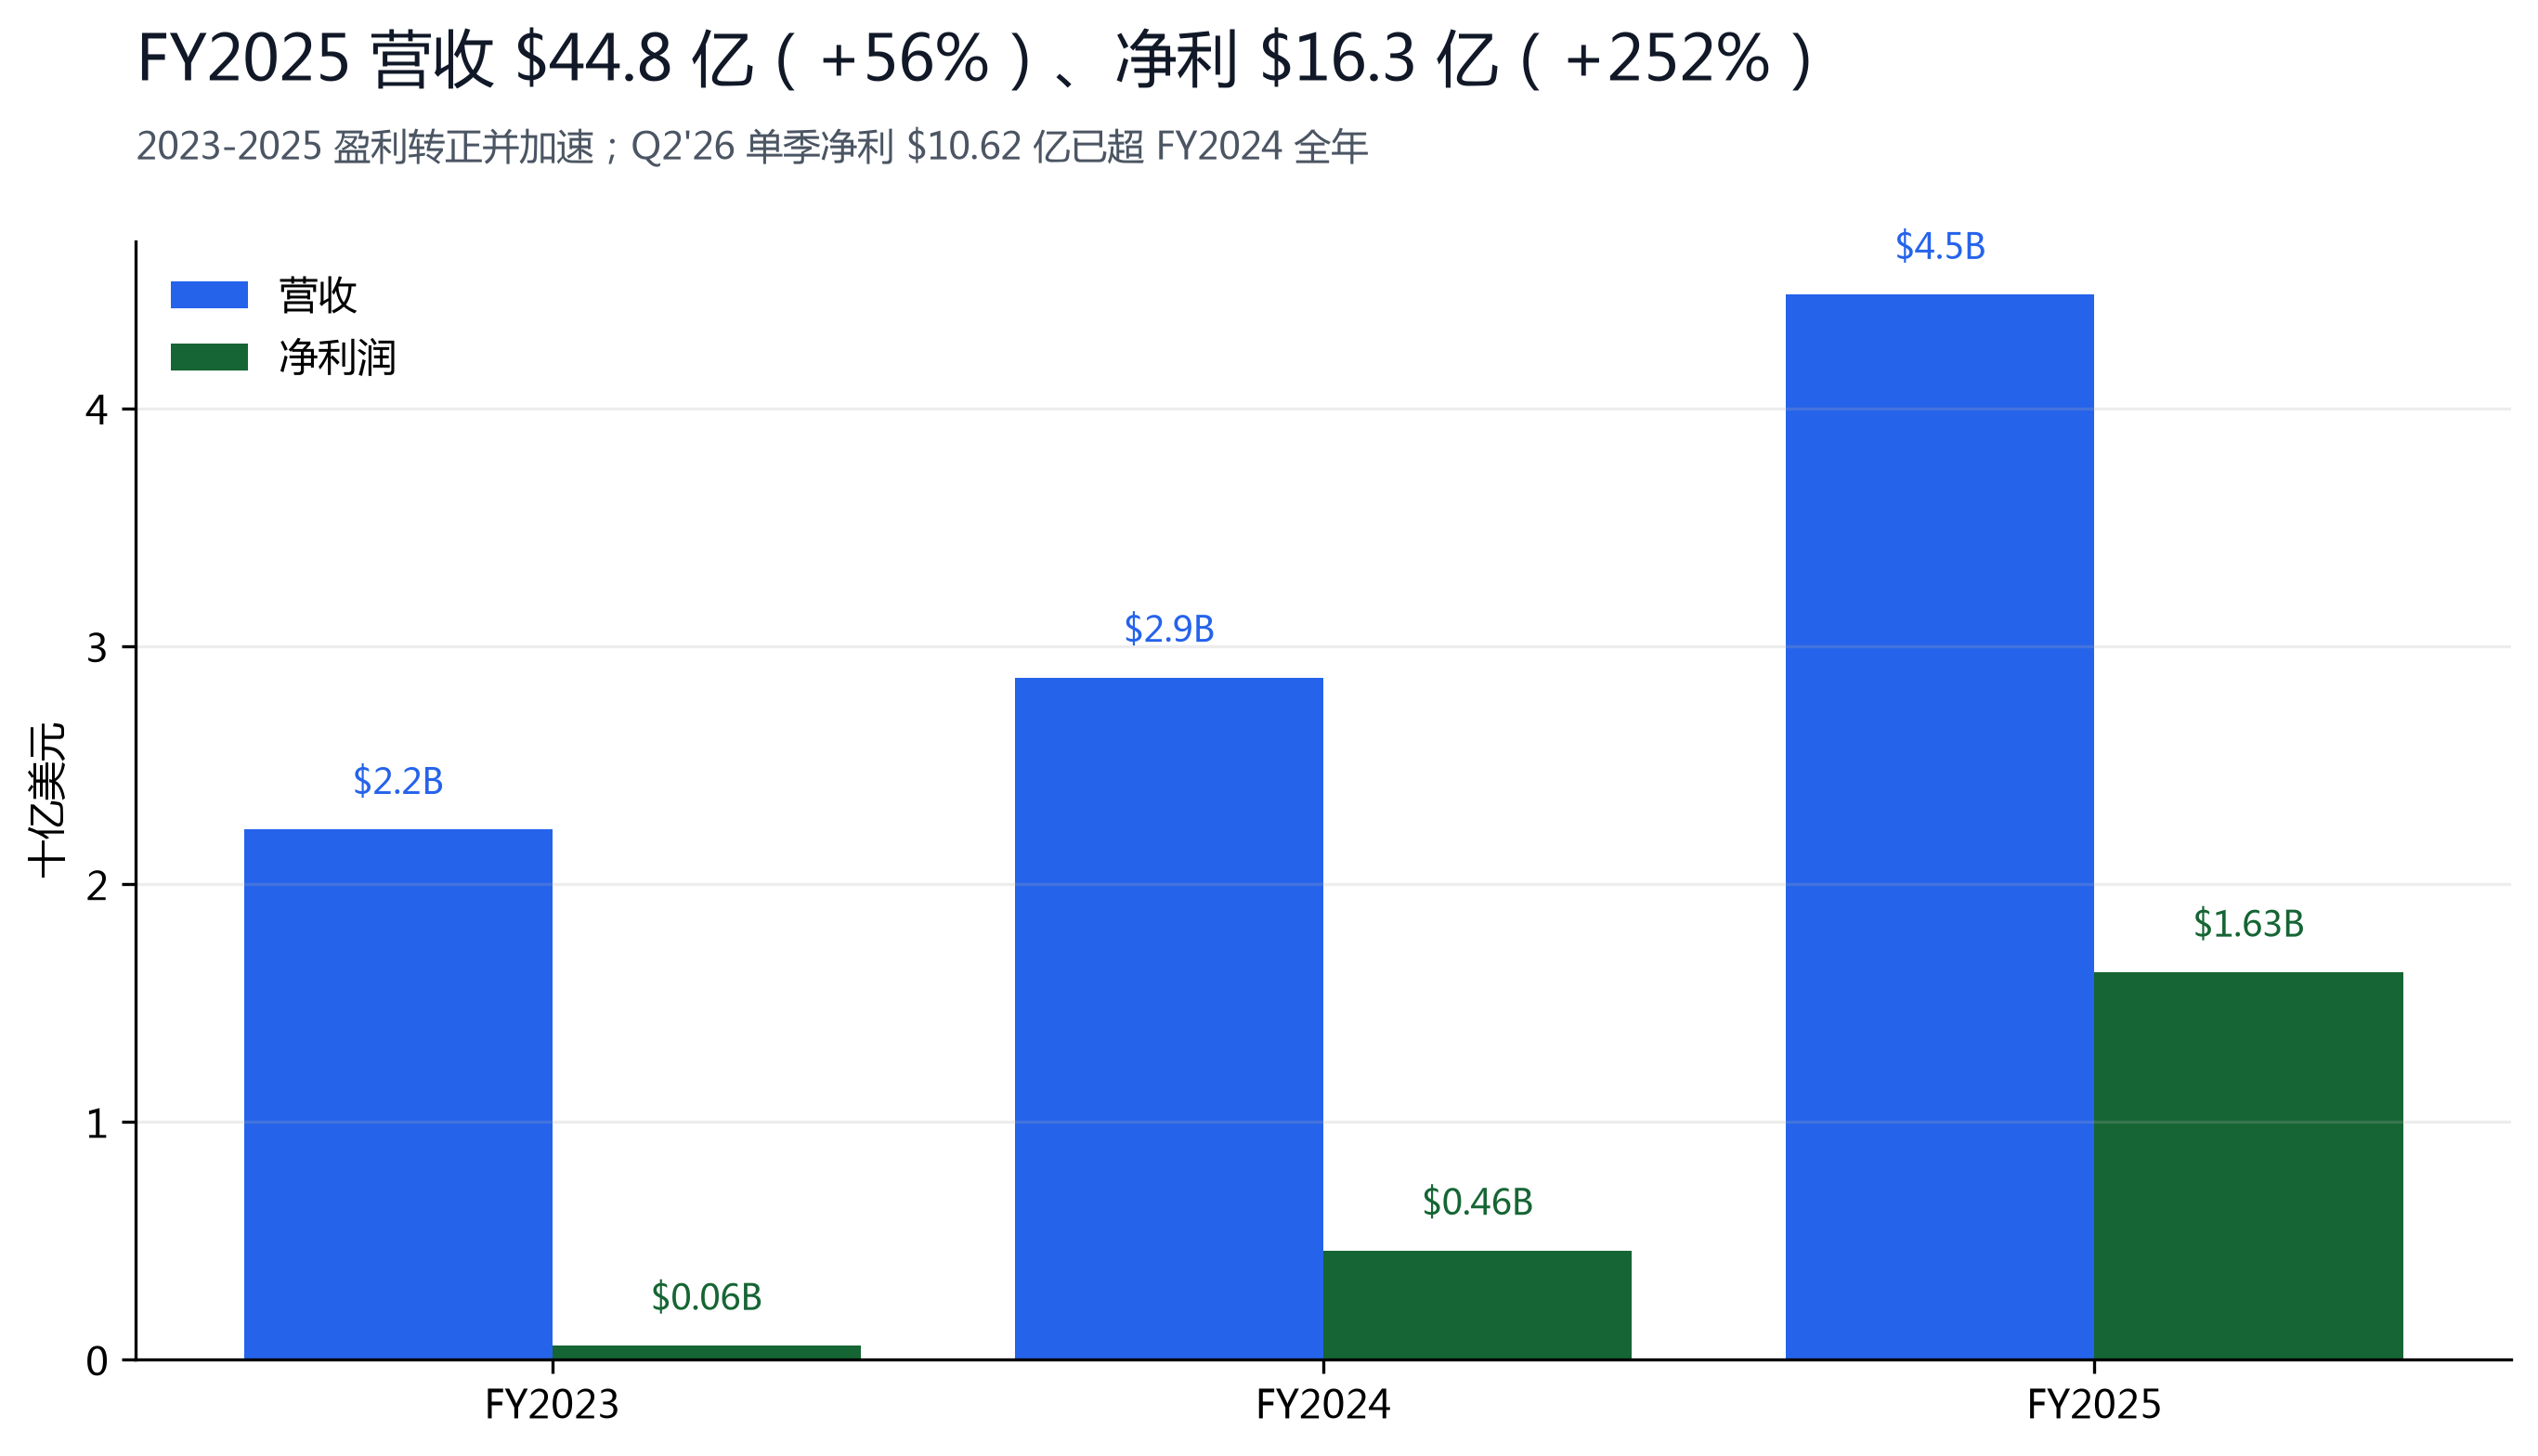
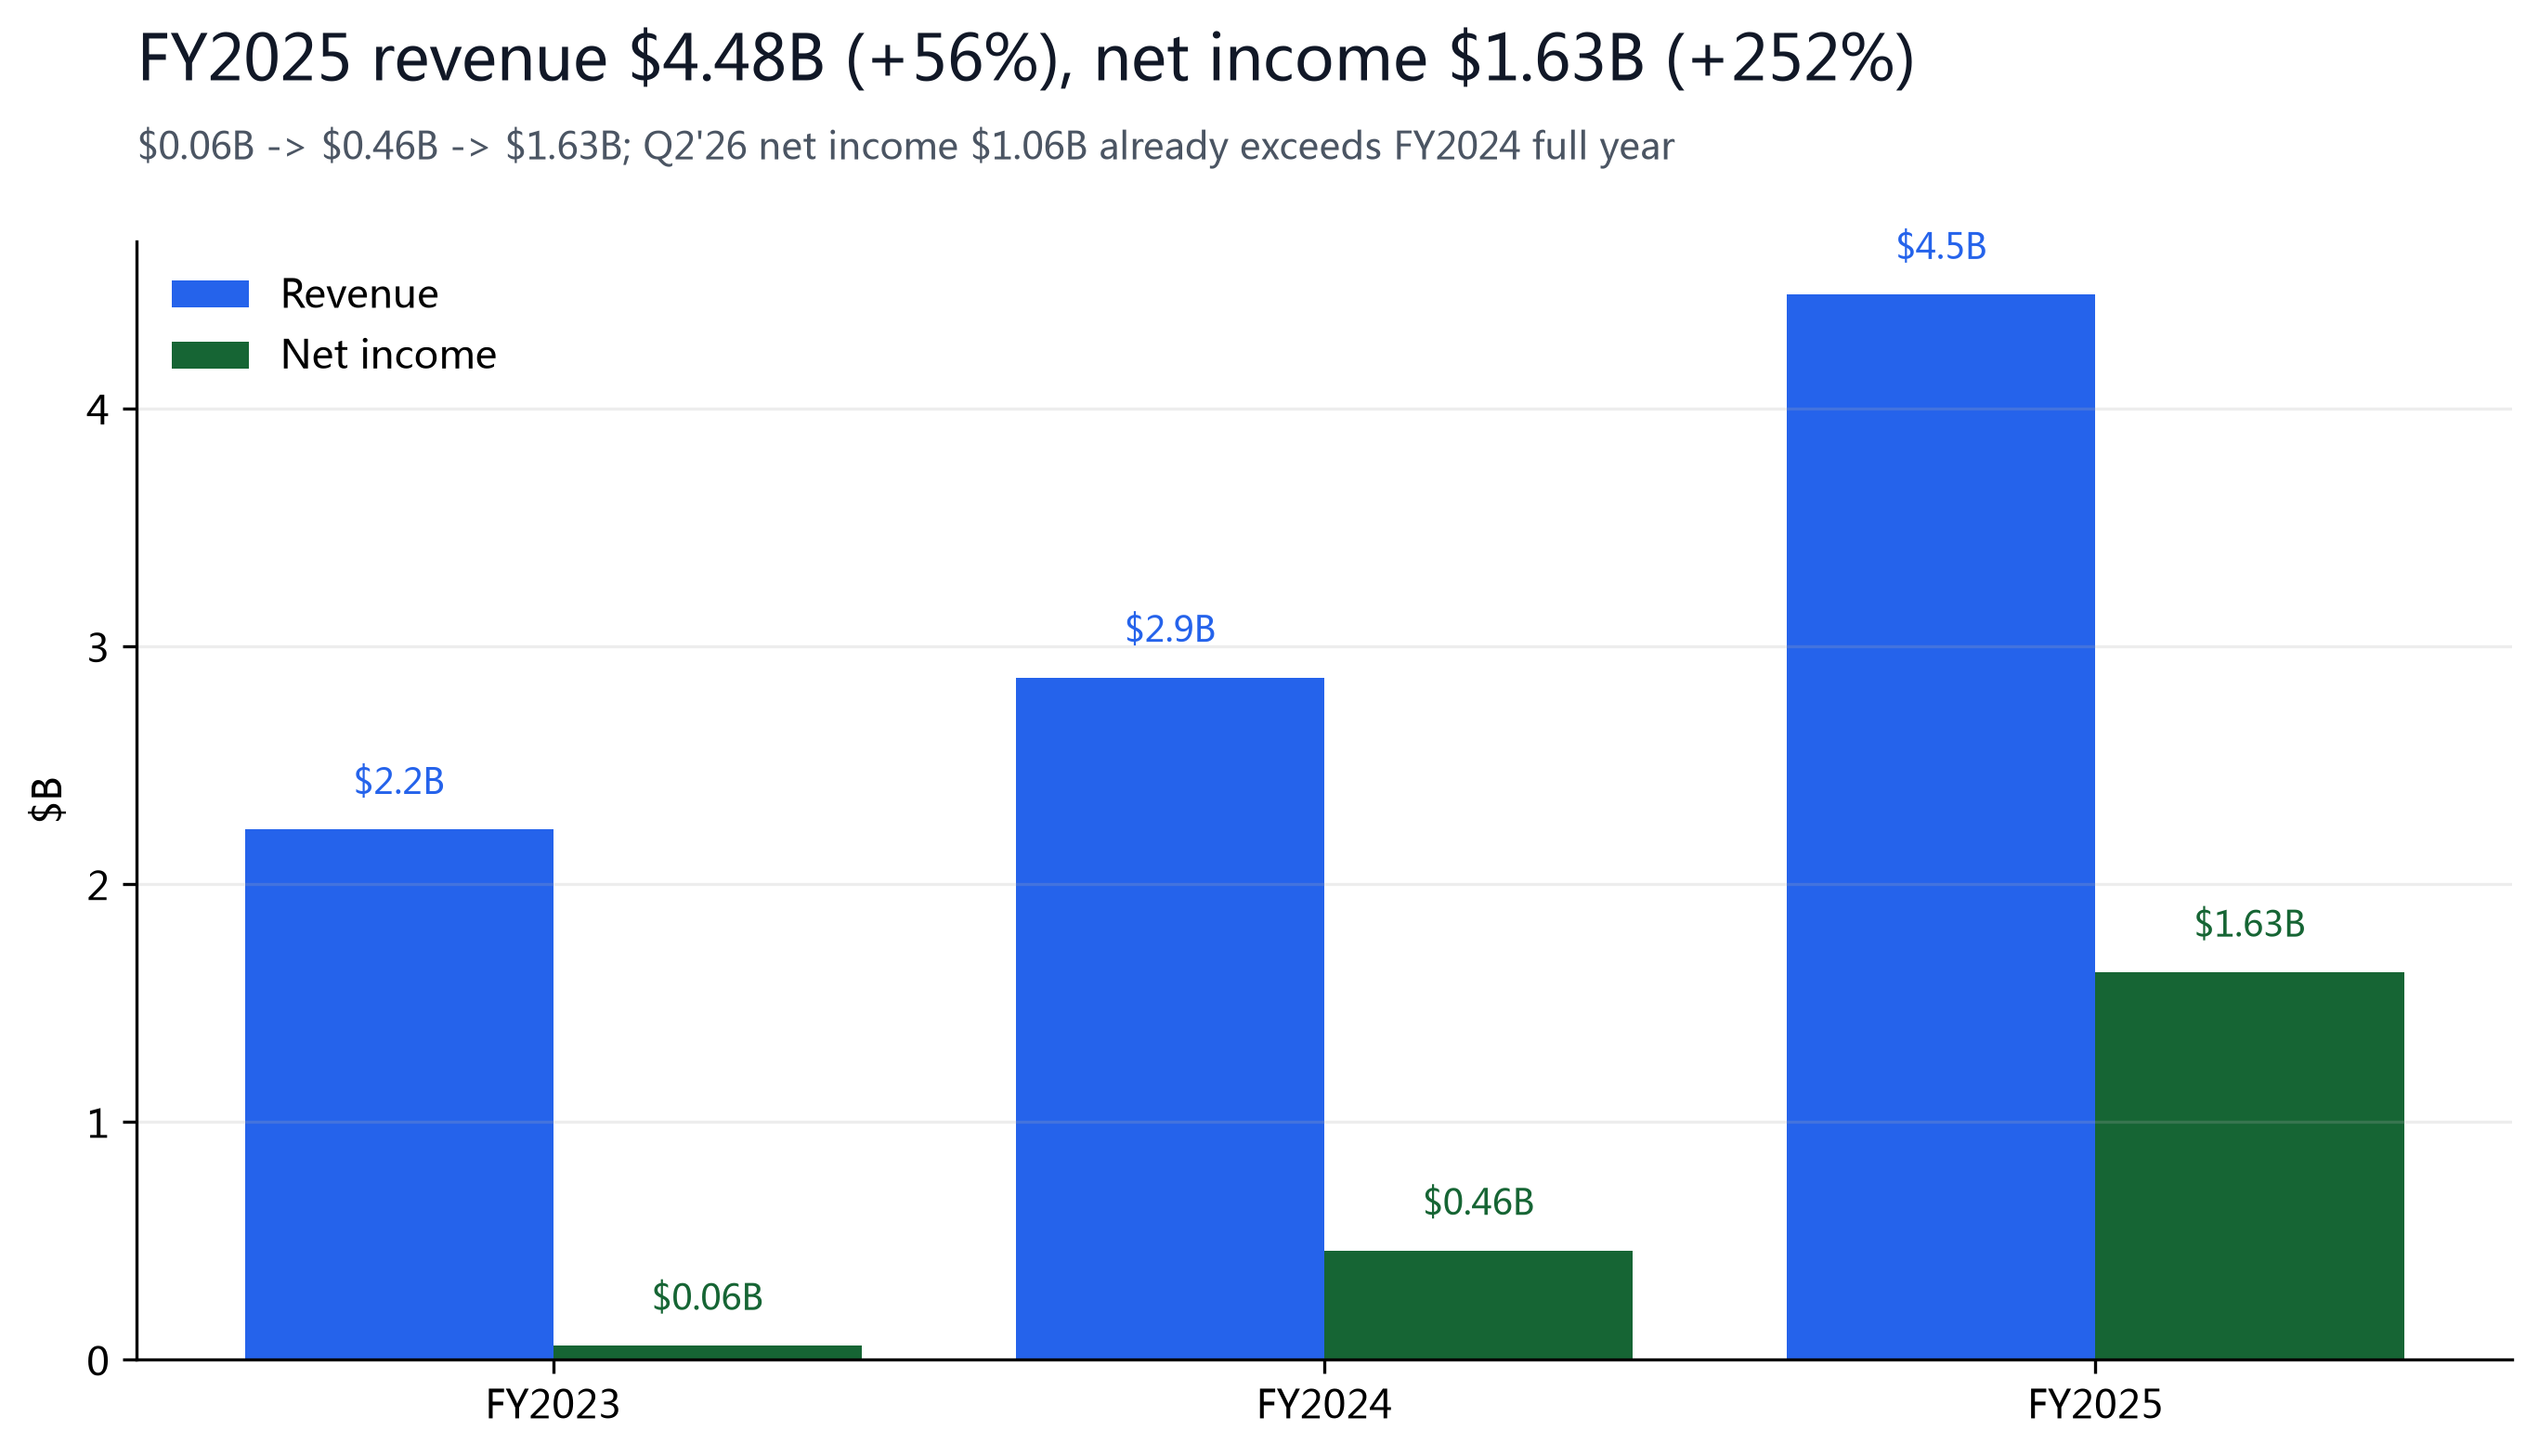
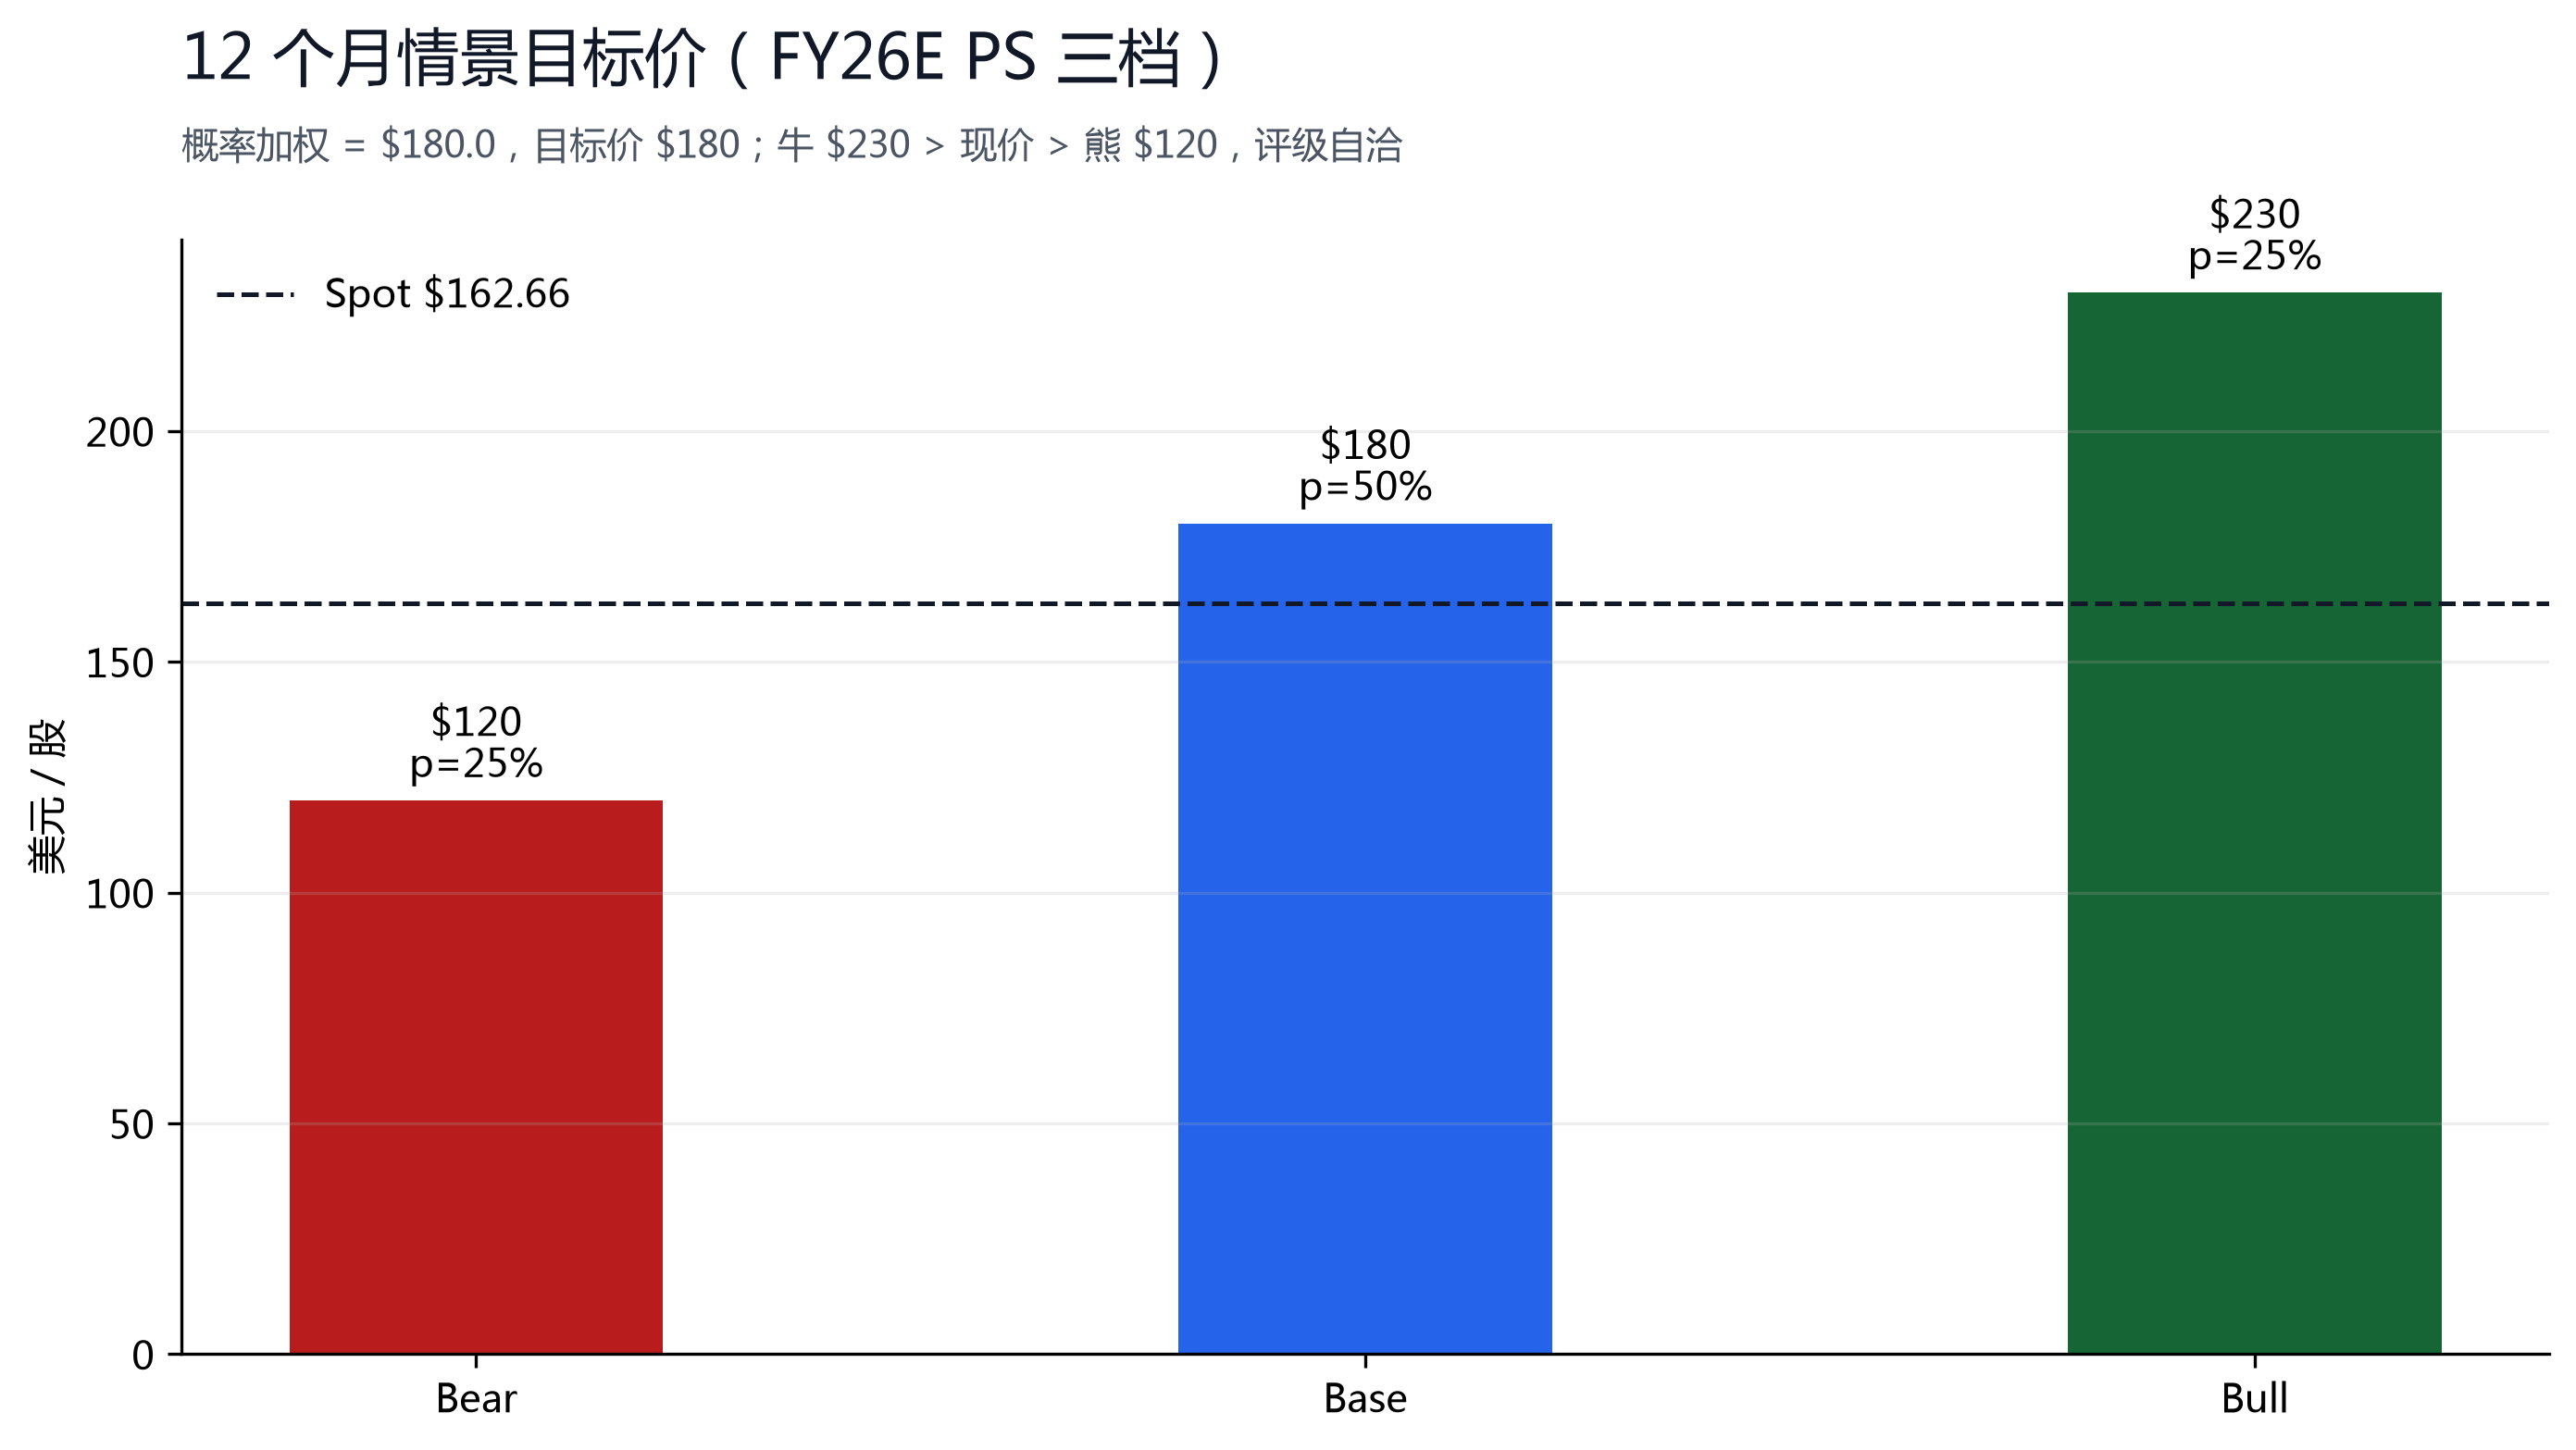
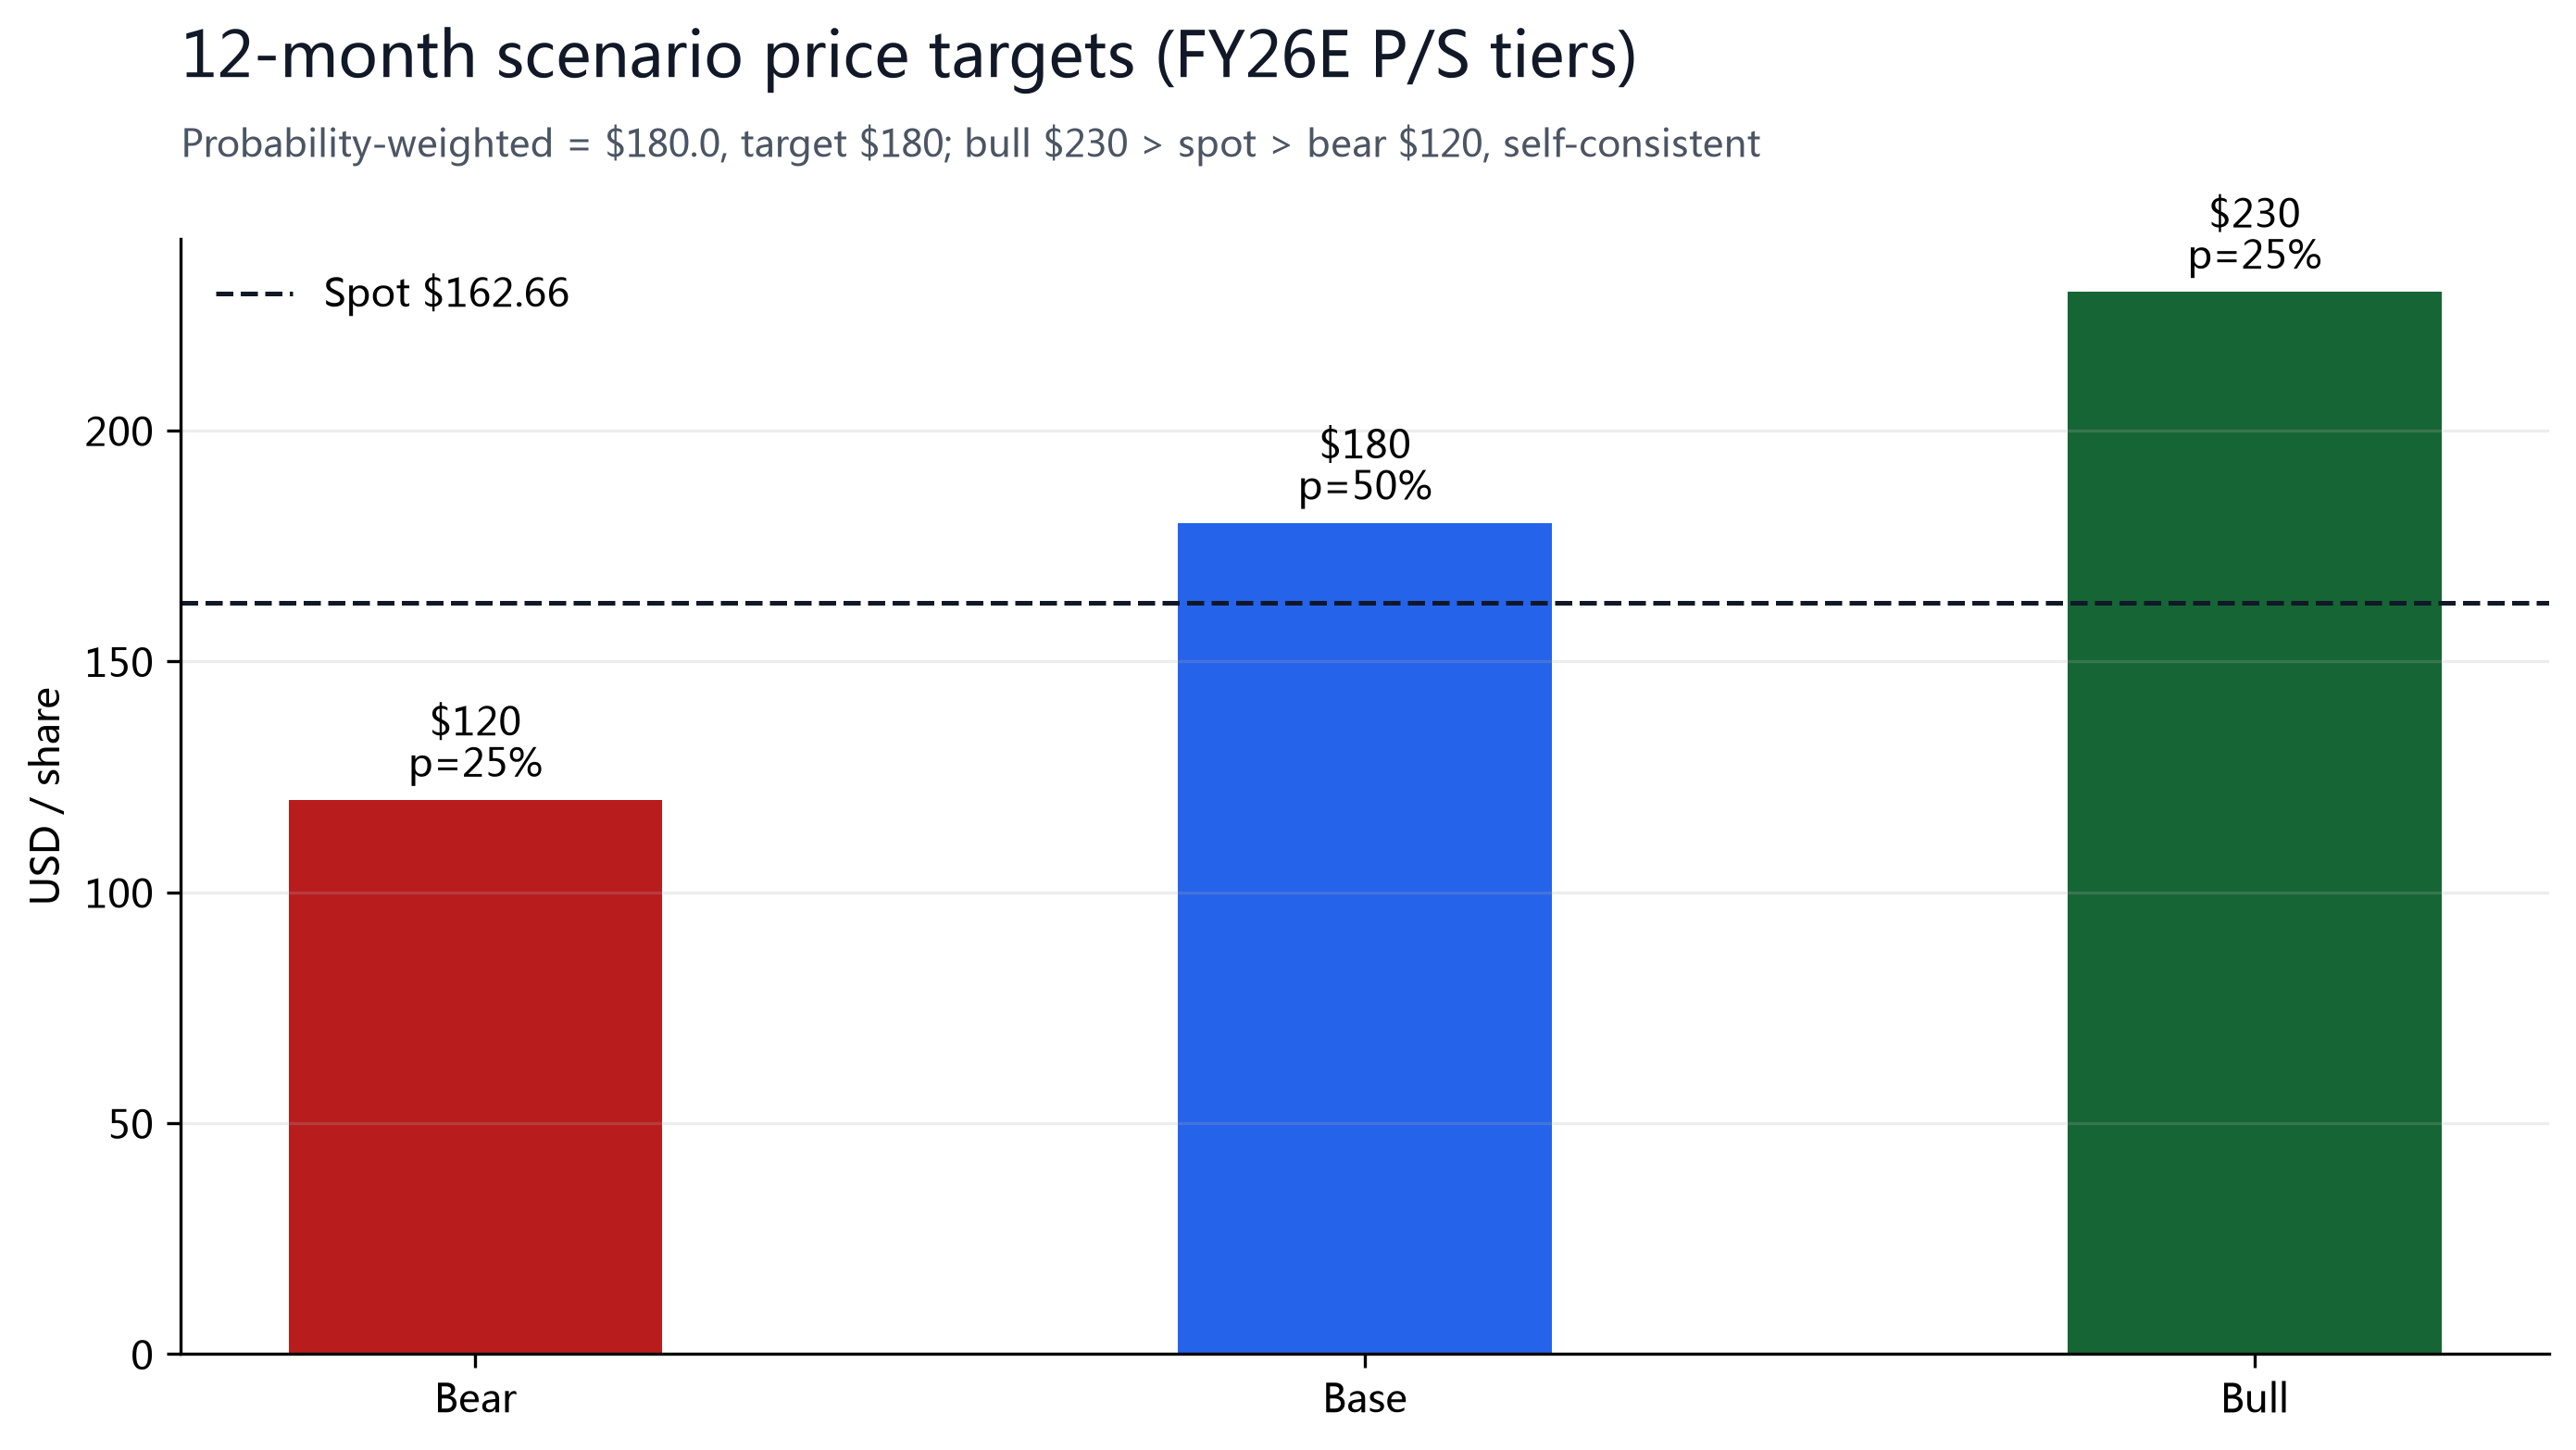
PLTR is profitable (FY2025 GAAP net income of $1.63B), but 139x trailing P/E lacks anchoring value for high-growth software, so we use three FY26E-revenue P/S scenarios on the $8.155B guidance midpoint: Bear $120 = 35x (U.S. demand slows, international disappoints, de-rating — ~$288B mcap); Base $180 = 53x (guidance delivered, U.S. commercial +134%, sovereign AI ramps — ~$432B mcap); Bull $230 = 68x (AI-app re-rating, continued beats, back above the $207.52 high — ~$552B mcap). Probabilities 25/50/25 weight to $180.0, giving a 12-month target of $180 (+10.7% vs spot). Rating and scenarios are self-consistent: bull $230 > spot $162.66 > bear $120. We do not adopt the $188.83 consensus — it may still be aligning to pre-spike data after a +29.45% day, and it under-prices international risk. As a cross-reference, MarketBeat EPS expectations are $1.17 for FY2026E (139x) and $1.66 for FY2027E (98x) — if the 82% guide is delivered, the high multiple gets digested by growth over time.
| Scenario | FY26E rev × P/S | PT | Weight |
|---|---|---|---|
| Bear | $81.55 亿 × 35x / 24.0 亿股 | $120 | 25% |
| Base | $81.55 亿 × 53x / 24.0 亿股 | $180 | 50% |
| Bull | $81.55 亿 × 68x / 24.0 亿股 | $230 | 25% |
| Weighted PT | 0.25×120 + 0.50×180 + 0.25×230 | $177.5 | 100% |
§08Catalysts and Risks
| Date / Window | Event | Direction |
|---|---|---|
| 2026 Q3 | RDV conversion and Q3 guide delivery ($2.162B) | Validates growth visibility |
| Ongoing | Sovereign AI contracts (US/ally gov & commercial) | Positive; disclosure cadence lumpy |
| 2026-08-07 / 08-12 | Payrolls / July CPI; 10Y at 4.68% | Rate-sensitive for long-duration high-multiple |
| 2026-09-16 | FOMC (3.50%-3.75%, 3 members lean to hike) | A hike would pressure the multiple |
| Late Oct / early Nov | Q3 earnings (tests +134% US commercial & margin expansion) | Key test |
| 2027 | International acceleration / model-labs app-layer push | Bulls watch intl, bears watch disruption |
(1) Extreme valuation: 139x trailing P/E and 47.9x FY26E P/S embed 80-90%+ sustained growth; any quarter below ~50% growth could trigger a double de-rate;
(2) Weak international: ~19% of revenue (10-Q: $362M, +33.7%) and growing slower than the U.S. (+114.7%), monetization scale unproven;
(3) Model-lab disruption: OpenAI/Anthropic pushing down the stack could erode AIP's differentiation;
(4) Post-squeeze overbought: RSI likely overbought after +29.45% in a day, raising pullback risk;
(5) Rates: 10Y at 4.68%, a Fed hike would pressure long-duration growth;
(6) GAAP quality: net income includes tax benefits and SBC adjustments; operating-cash-flow alignment needs monitoring;
(7) Customer concentration and government reliance: Top-20 average revenue of $124M (rising concentration) and U.S. government at ~42% of sales ($809M/$1,935M), with shutdowns and procurement cadence disrupting quarterly results.
Upside risk: if Q3 beats again, sovereign AI ramps and international accelerates, the market could re-classify PLTR from 'expensive AI concept' to 'the AI application-layer standard', re-rating to 68x FY26E P/S — the $230 bull case (+41% vs spot).
§09Sources, Limits and Disclosure
- Palantir Q2 2026 earnings (2026-08-03 after close): revenue/net income/EPS/segments/guidance (8-K cross-checked with 澎湃/腾讯/stockstotrade/smartinvestorsdaily)
- Price and valuation: stockanalysis.com (Aug 4: $162.66, mcap $390.9B, P/E 139x, 52W $106.37-207.52), moomoo (PT $196.68/22)
- Analyst ratings: S&P Global via stockanalysis (32, avg $188.83, range $80-255); quote feed (35, 66/29/5); individual: DB upgrade to Buy $200, HSBC $151->$162, Benchmark Hold
- Ownership: quote-feed holder table (BlackRock 7.88%, Vanguard 6.04%, State Street 4.24%, Thiel 4.10%, Karp 2.45%), marketbeat (institutions 45.65%)
- Squeeze and market reaction: 腾讯新闻 (shorts $2.7B gain -> $3B loss), 新浪财经 (DB/Benchmark views, YTD -11.3%)
- Macro and market: Jin10 / Wall Street CN / ATB Weekly (2026-08-04): 10Y 4.68%, Fed 3.50%-3.75%
Limitations: spot is the 2026-08-04 close (after-hours $160.38); Q2'25 revenue (~$1,003M) and Q2'26 international segment (~$365M) are derived, not company-disclosed (marked DERIVED); short interest has no single public % (we describe the squeeze via Tencent's report of short P&L swings rather than a specific %); analyst PTs differ by source (stockanalysis $188.83 / moomoo $196.68 / quote feed $196.96, flagged); RSI is inferred (likely overbought after +29.45% in a day; no realtime source); FY2023 revenue $2.23B and net income $0.06B are public historicals; Beta 1.56 per stockanalysis. This report is not investment advice.