Nebius Group N.V.NASDAQ:NBIS
Published 2026-08-14; market data is through the 2026-08-13 close [TwelveData / Stocknear]. Financials are through June 30, 2026 and are based on the Q2 2026 official release, shareholder letter and attached [official 6-K].
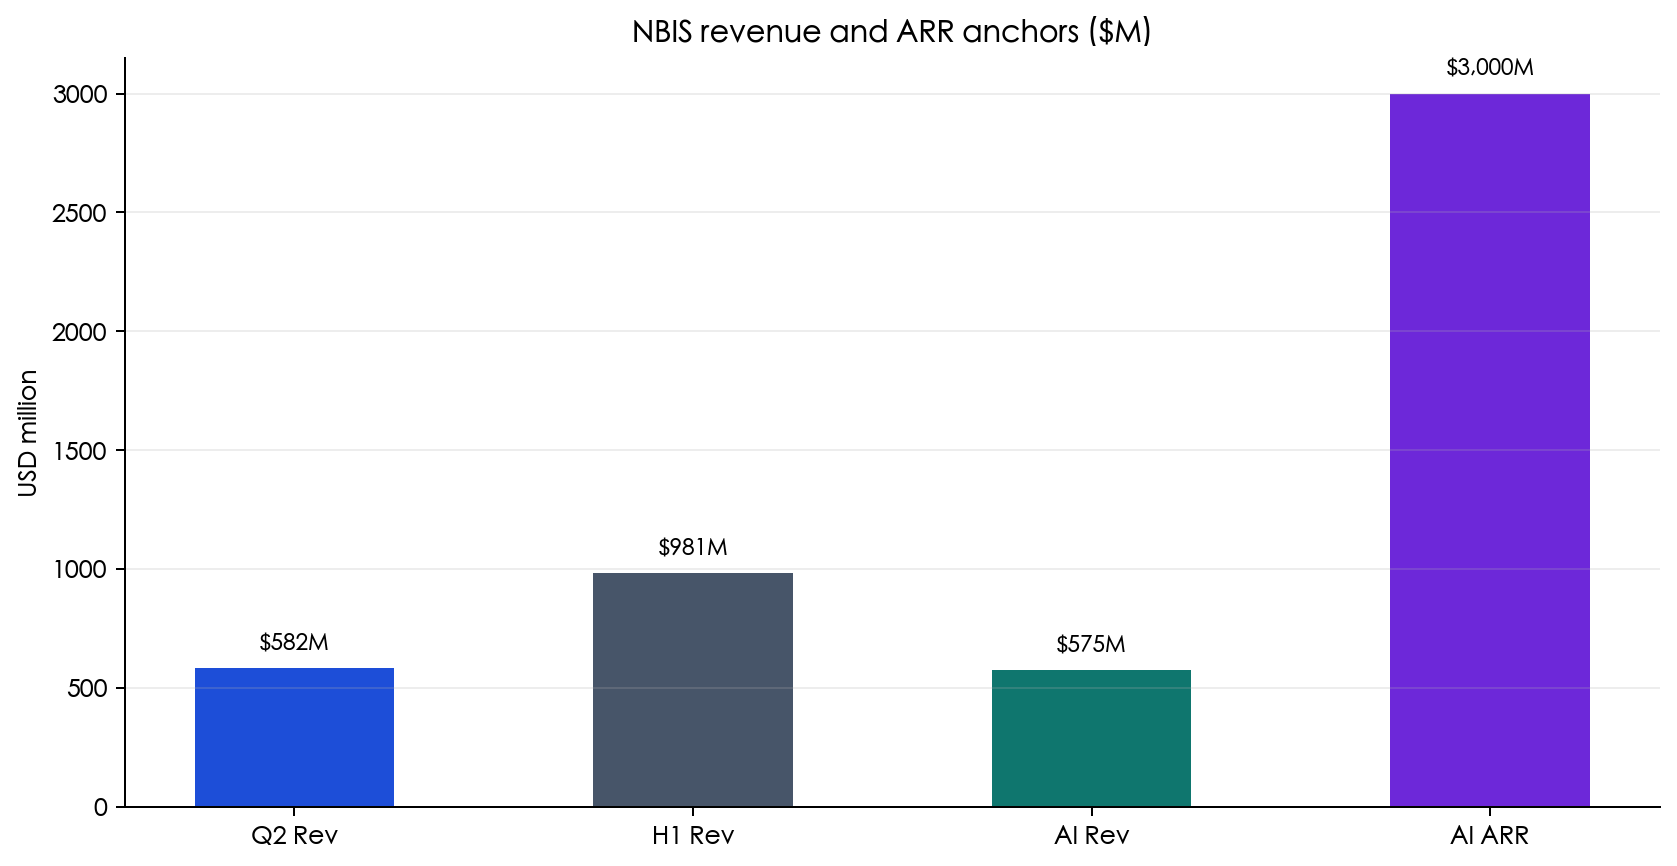
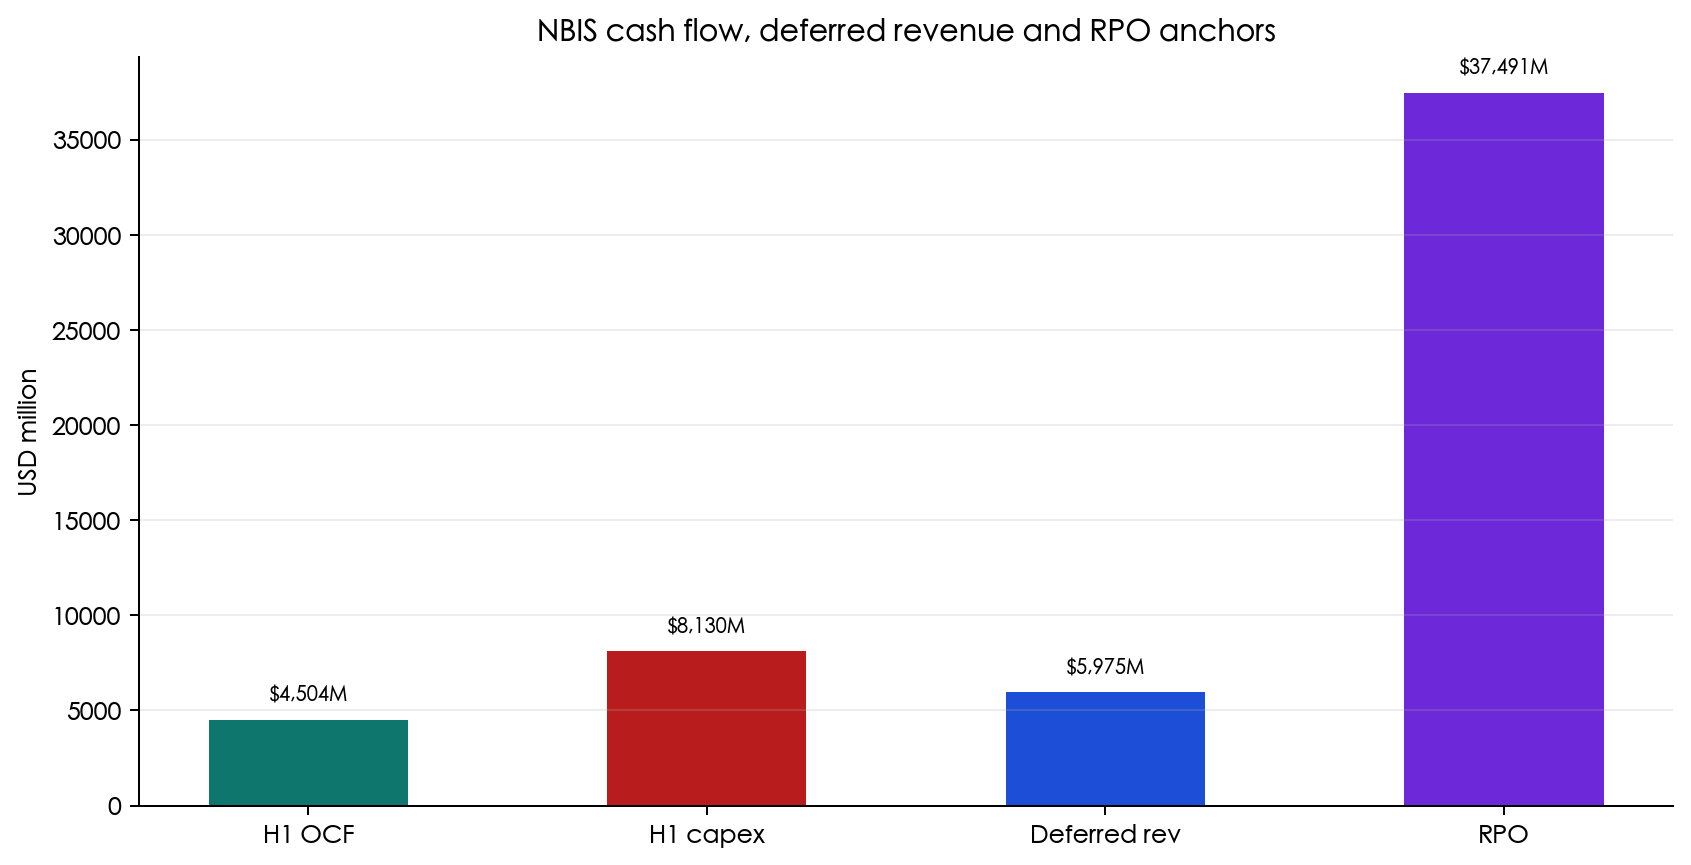
Q2 2026 group revenue was $582.3M (+454% YoY), AI-cloud revenue was $574.9M, AI-cloud ARR was about $3.0B and AI-cloud adjusted EBITDA margin was 49.7% [official 6-K][shareholder letter]. H1 capex of $8.13B exceeded H1 operating cash flow of $4.50B, making capital execution and financing the key valuation constraint.
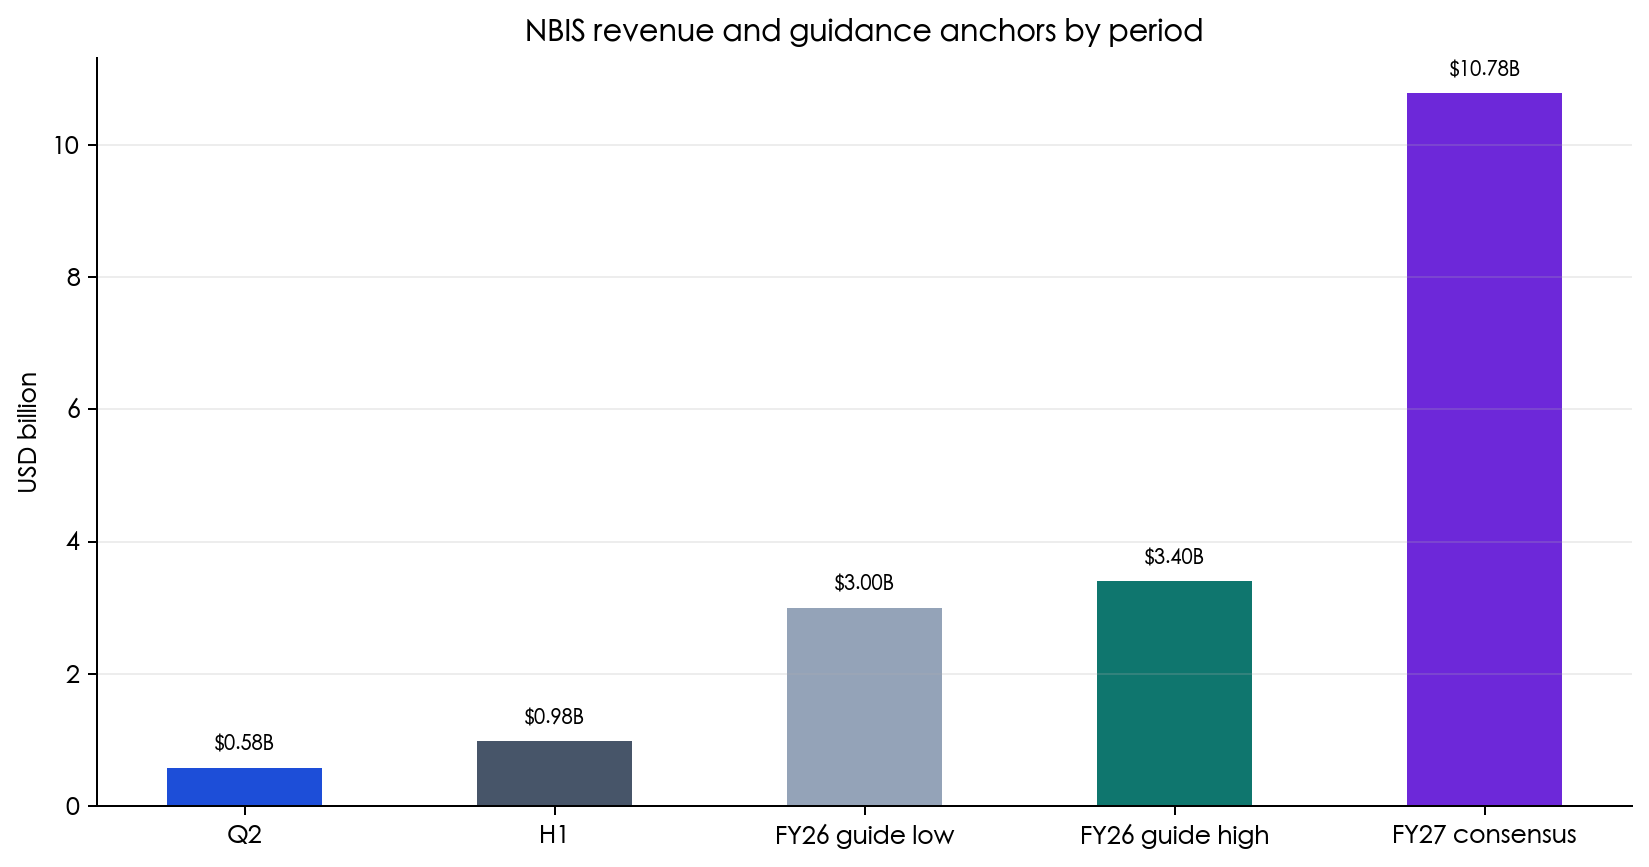
Conclusion: HOLD, with a 12-month target of $279, or 9.4% upside from $255.04. We use FY2027E revenue of $10.78B, 8.0x EV/Sales, 0.3026187B diluted shares and an explicit 1.523% execution discount.
§01Investment Summary
Nebius has moved from an AI-cloud narrative into revenue execution: Q2 group revenue was $582.3M, AI-cloud revenue $574.9M and AI-cloud adjusted EBITDA $285.7M; H1 operating cash flow of $4.50B still did not cover $8.13B of capex [official 6-K].
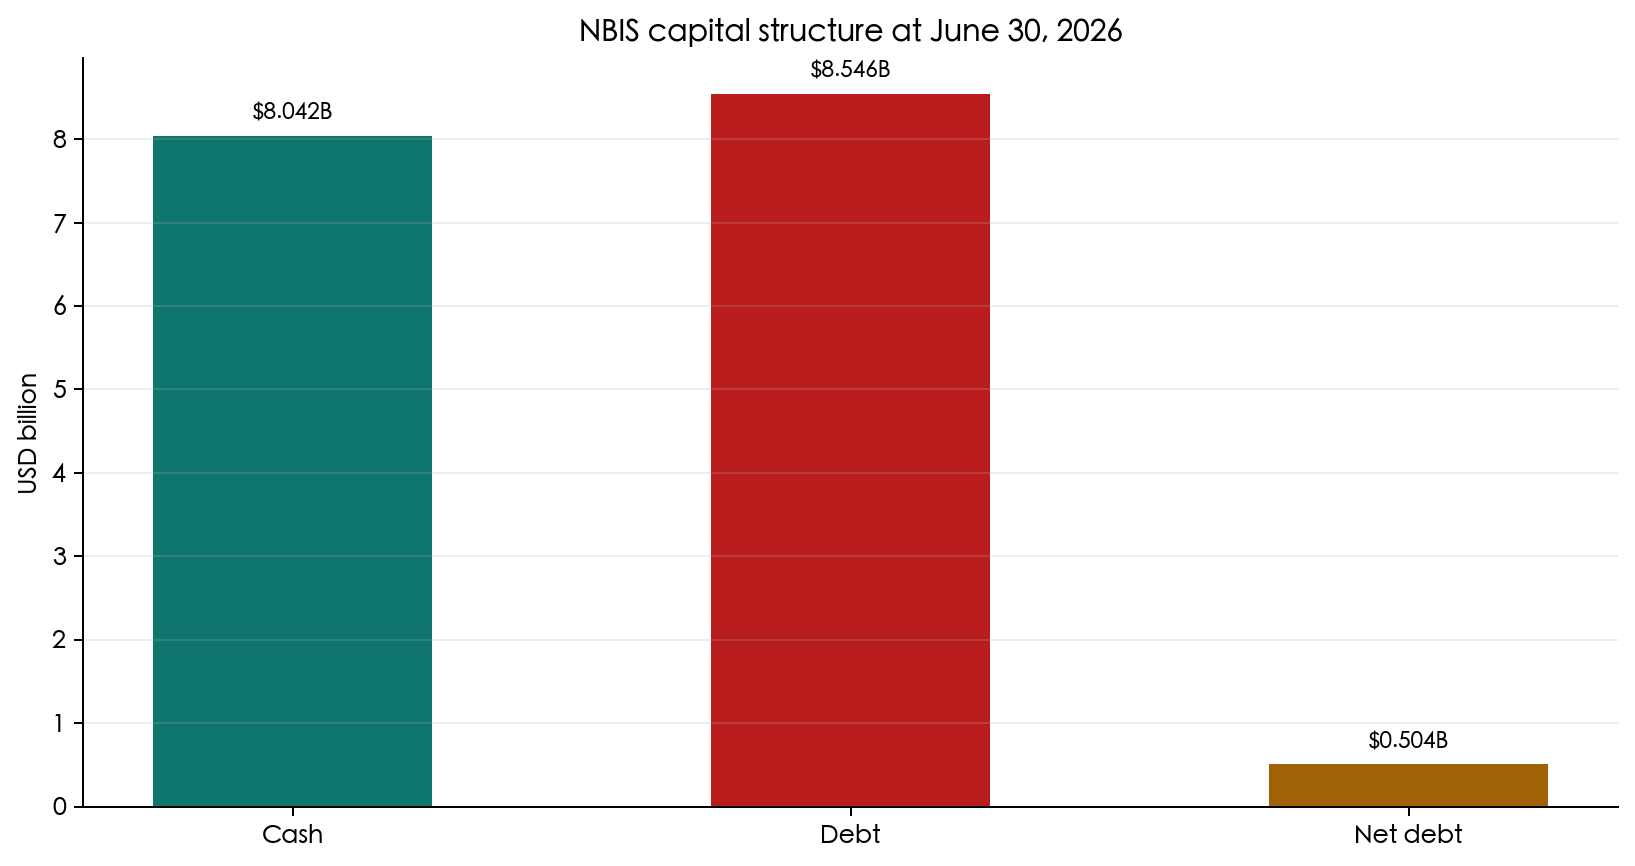
Three supports for HOLD: (1) AI-cloud revenue was 98.7% of Q2 group revenue and adjusted EBITDA margin was 49.7%; (2) deferred revenue of $5.98B and RPO of $37.49B provide visibility; (3) customer prepayments ease part of funding pressure. Three constraints: (1) FY2027 still depends on capacity and GPU delivery; (2) $0.504B net debt and potential financing dilution; (3) spot EV/FY2027 sales of 6.48x leaves little room to substitute a high-multiple narrative for cash-flow proof.
| 项目 / Item | 结论 / Conclusion | 证据 / Evidence |
|---|---|---|
| Rating | HOLD | Strong growth, high execution risk |
| 12M PT | $279 | 8.0x EV/Sales + execution discount |
| Street PT | $312.67 | 4 analysts; small sample |
| Key KPI | AI cloud ARR $3.0B | shareholder letter |
| Top risk | Capex / dilution / financing | H1 cash flow vs capex |
§02Price & Analysts
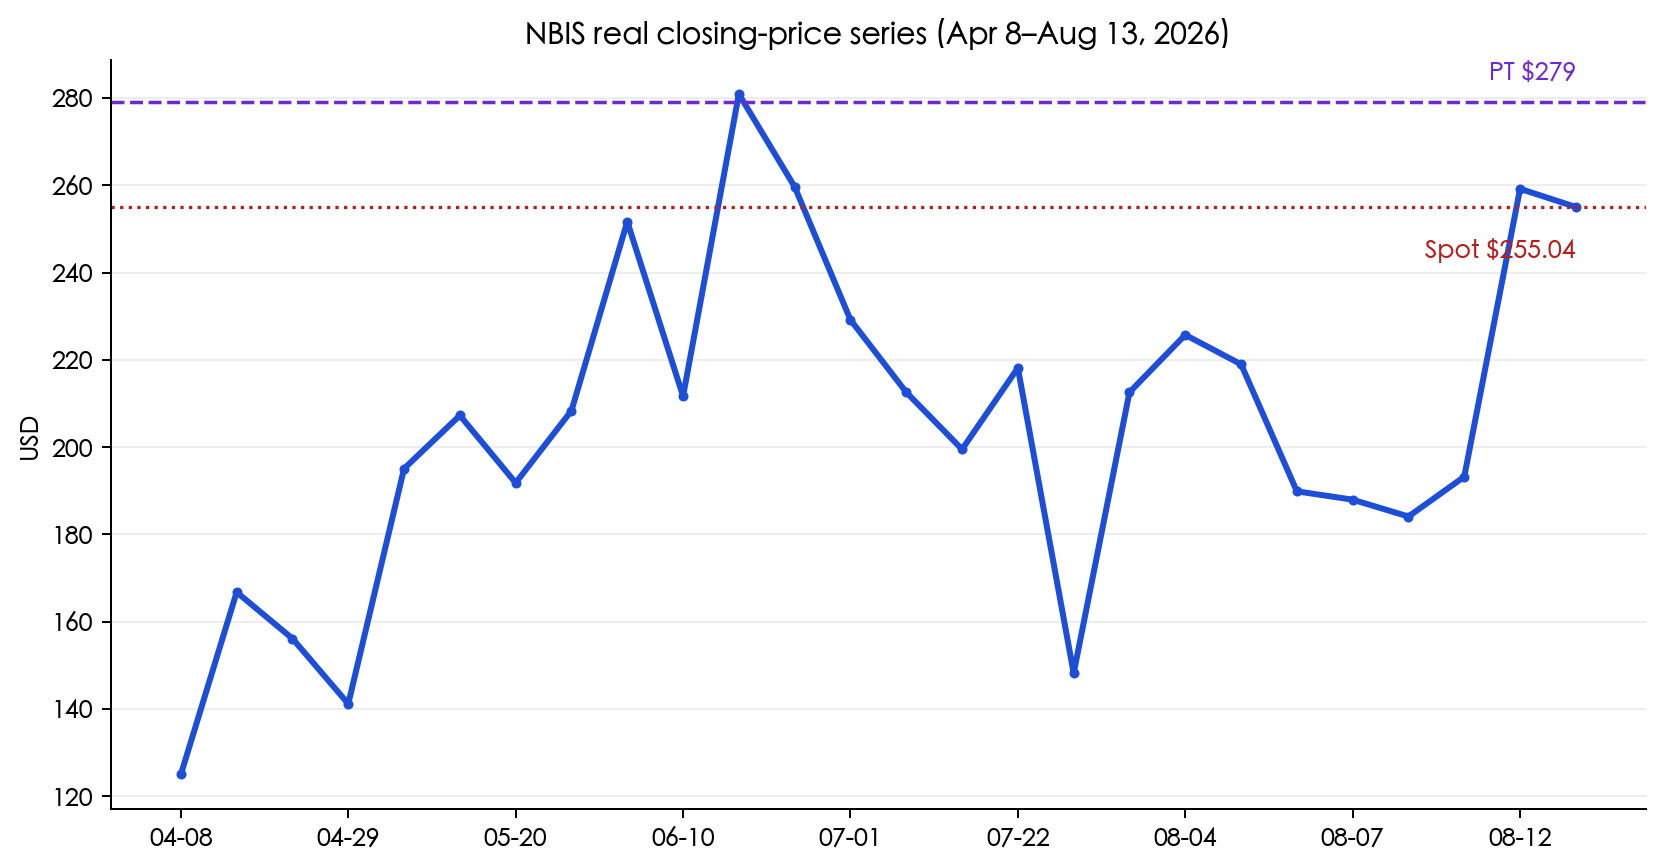
The 2026-08-13 close was $255.04, versus a 52-week range of $50.10–$299.86; spot is at the 82.05th percentile. RSI14 is 68.93, near overbought but not a standalone reversal signal [historical closes][range and beta].
| 项目 / Metric | 数值 / Value | 来源与口径 / Source |
|---|---|---|
| Current price | $255.04 | 2026-08-13 close [TwelveData] |
| 52W range | $50.10–$299.86 | StockAnalysis / forecast [range] |
| Beta | 1.40 | market-data snapshot [beta] |
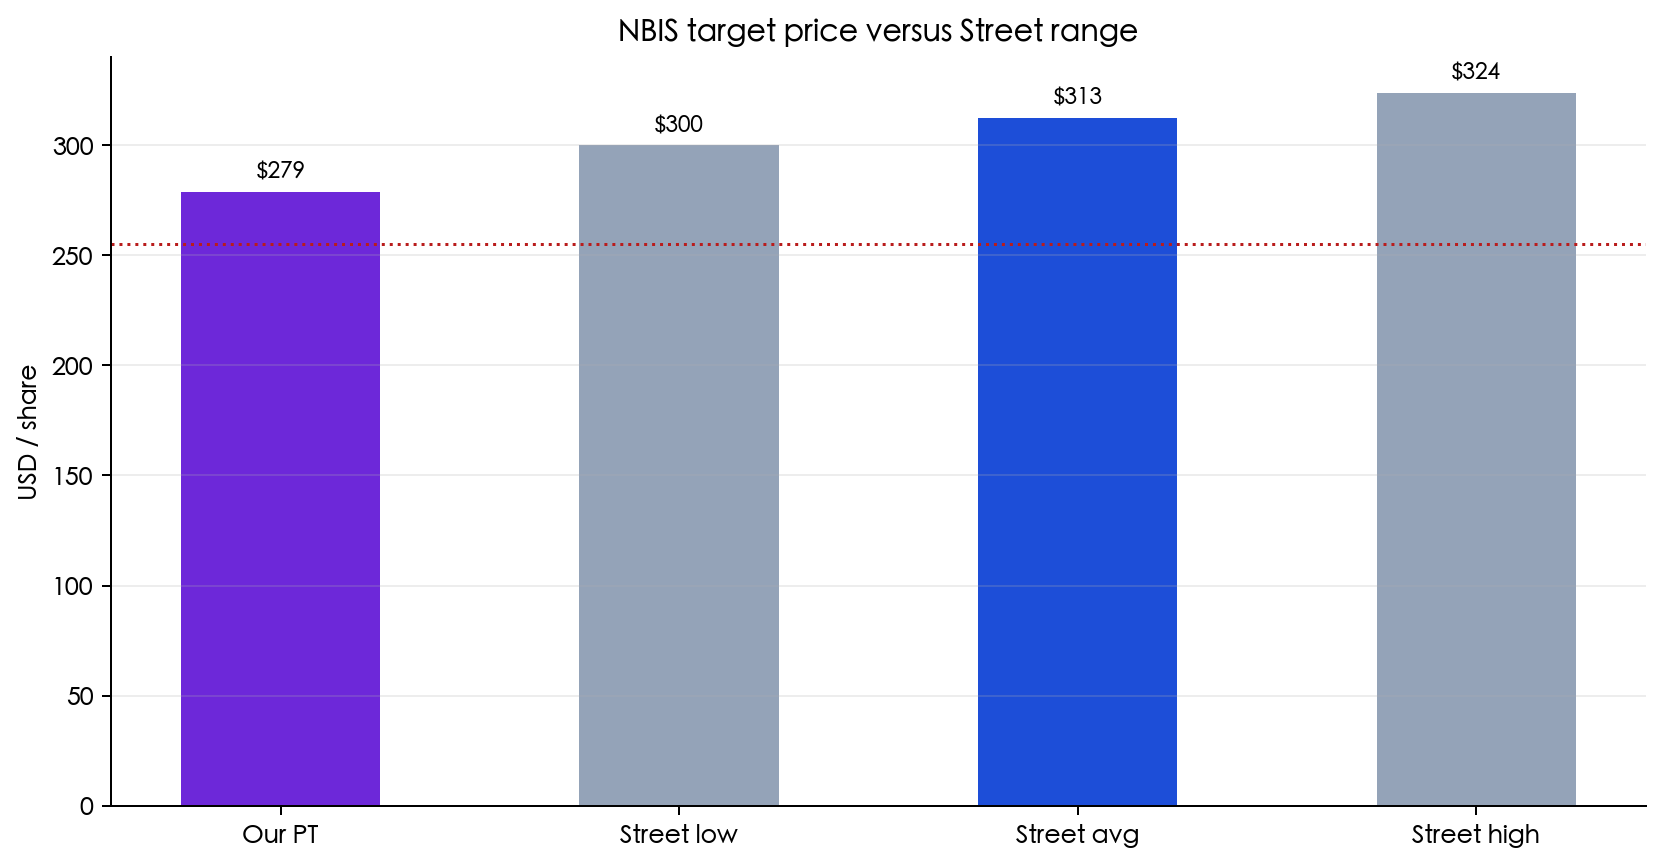
| Street PT | $300 / $312.67 / $324 | low / average / high; 4 analysts [S&P Global] |
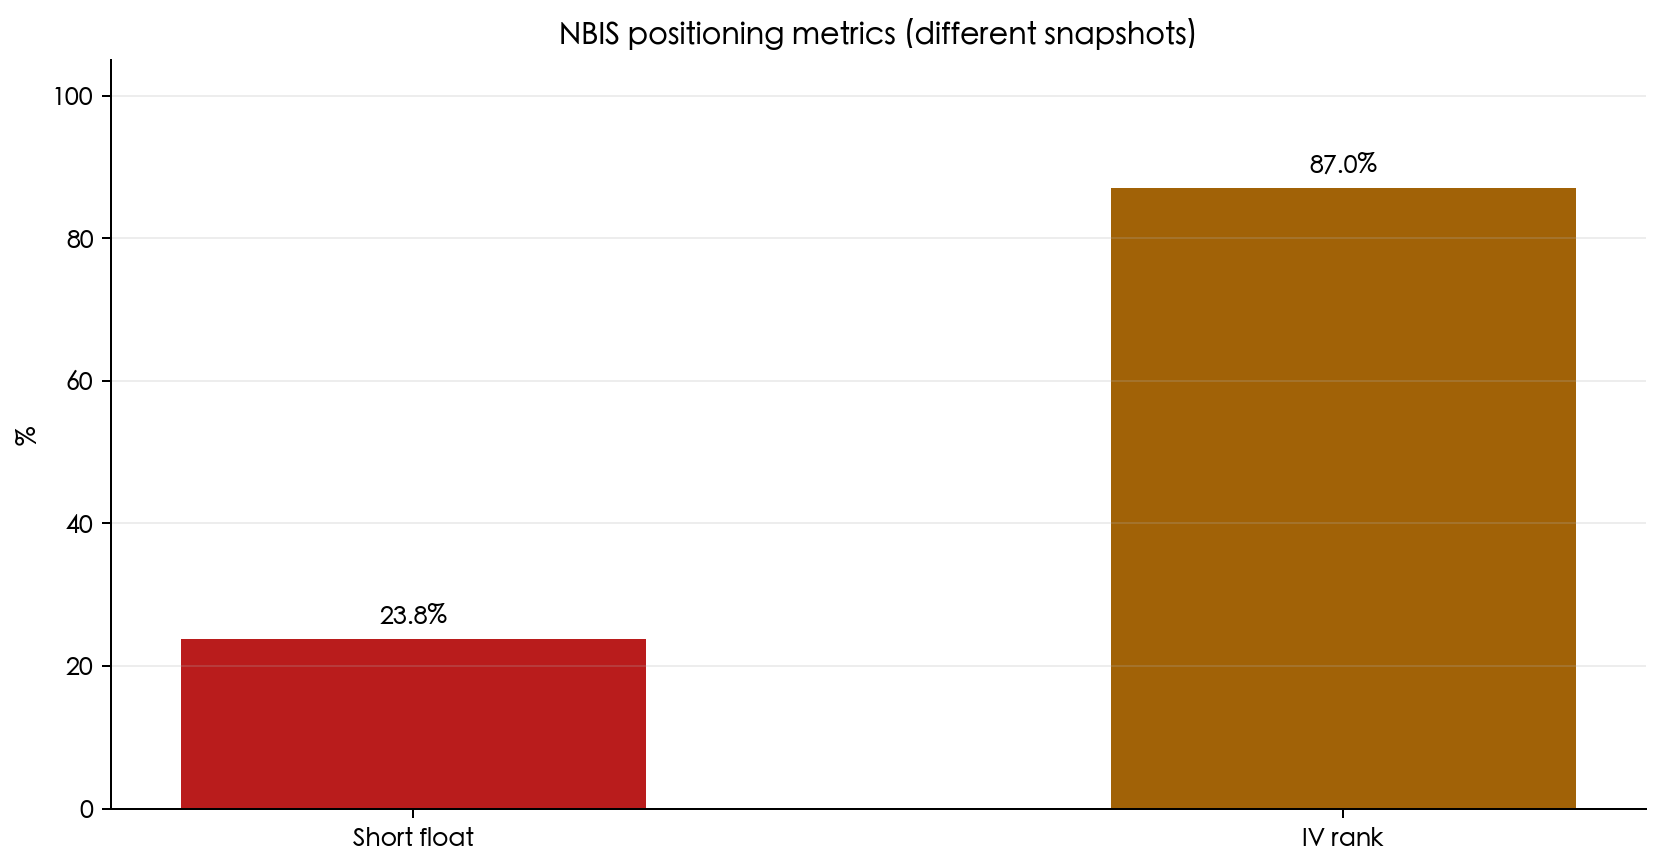
| Short float / IV Rank | 23.79% / 87.0% | different dated snapshots [short interest][options snapshot] |
§03Bull / Bear Thesis
Bull: AI-cloud revenue and visibility
The bull case is measurable: Q2 AI-cloud revenue was $574.9M, AI-cloud ARR $3.0B, deferred revenue and RPO were $5.98B and $37.49B, and AI-cloud adjusted EBITDA margin was 49.7%, suggesting incremental revenue is not purely low-margin growth.[shareholder letter]
Bear: capital intensity, dilution and valuation tolerance
The bear case is not that revenue is absent; it is that revenue requires sustained capital: H1 capex of $8.13B versus H1 operating cash flow of $4.50B. If customer prepayments, GPU delivery or power-on dates slip, the FY2027E consensus of $10.78B may be revised down.[official 6-K][shareholder letter]
§04Financial Truth
The official 6-K reconciliation: Q2 revenue $582.3M, H1 revenue $981.3M; Q2 adjusted EBITDA $236.2M, H1 $365.7M; cash $8.0421B and debt $8.5457B. Q2 and H1 are different periods and are not a continuous quarterly series.[official 6-K][Q2 release]
| 指标 / Metric | 数值 / Value | 期间 / Period | 来源 / Source |
|---|---|---|---|
| Group revenue | $582.3M / $981.3M | Q2 / H1 2026 | [official 6-K] |
| AI-cloud revenue | $574.9M | Q2 2026 | [official 6-K] |
| AI-cloud adj EBITDA | $285.7M; $49.7% margin | Q2 2026 | [shareholder letter] |
| Operating cash flow | $4,504.1M | H1 2026 | [official 6-K] |
| Capex + intangibles | $8,130.3M | H1 2026 | [official 6-K] |
| Deferred revenue / RPO | $5.98B / $37.49B | 2026-06-30 | [official 6-K] |
§05Comparables
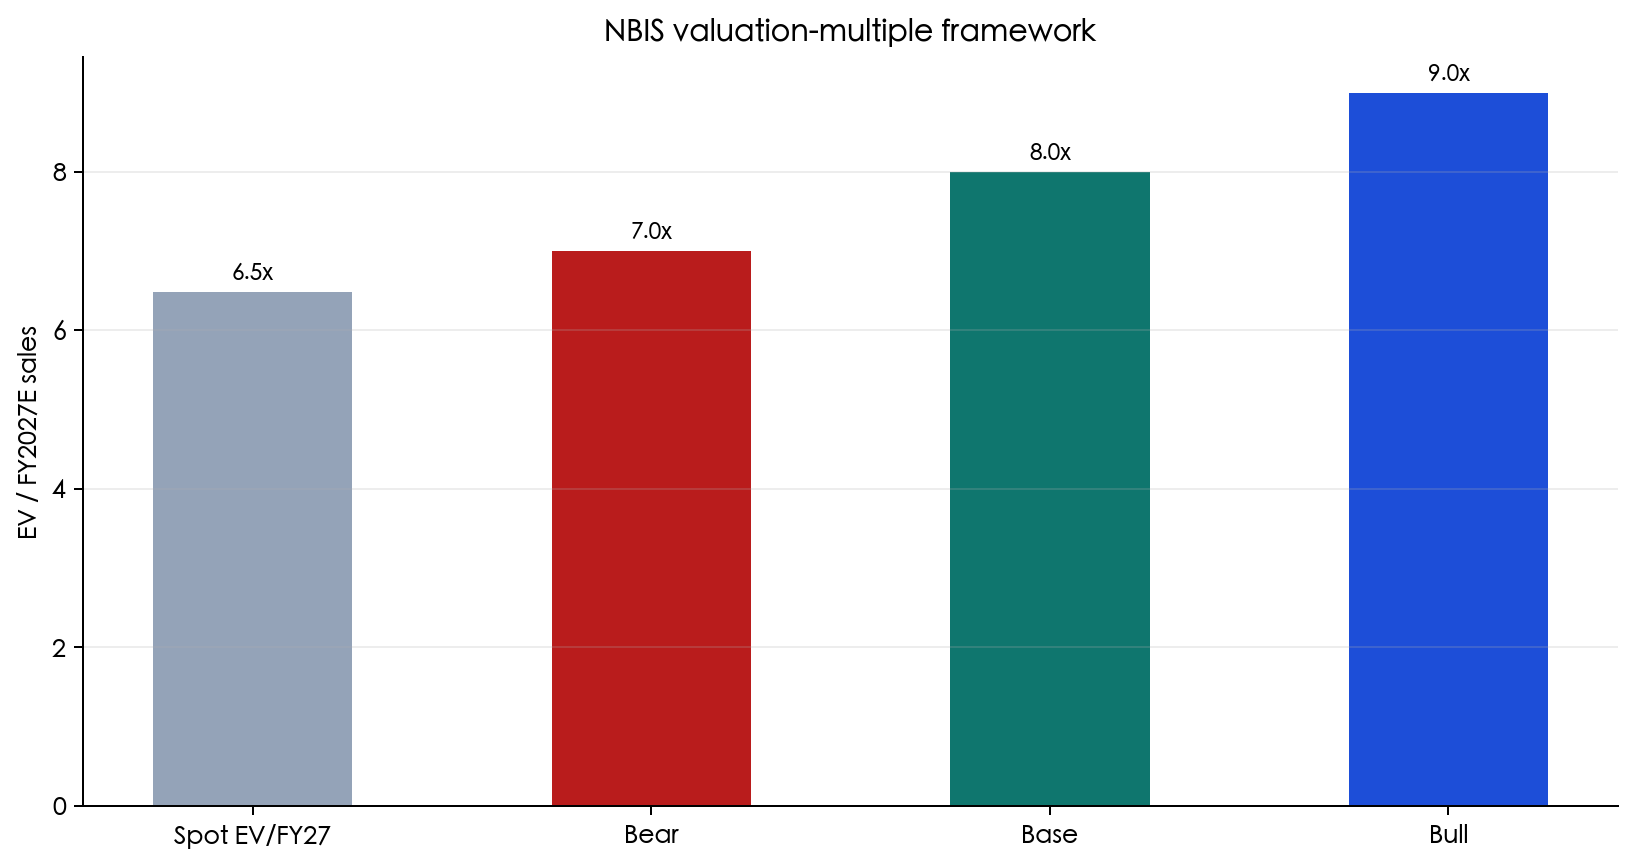
We do not combine un-reconciled peer P/S or EV/EBITDA figures into the target. NBIS FY2027E EPS consensus is negative, so EV/Sales is primary; real-time peer valuation is marked [DATA UNAVAILABLE] in this filing-led reconciliation to avoid false precision.| 估值锚 / Anchor | EV/FY2027E Sales | 含义 / Read-through |
|---|---|---|
| NBIS spot | 6.48x | market-implied multiple |
| Bear framework | 7.0x | funding / capacity miss |
| Our base | 8.0x | capacity broadly on track |
| Bull framework | 9.0x | conversion and financing both improve |
| External peer set | [DATA UNAVAILABLE] | not used in PT |
§06Ownership
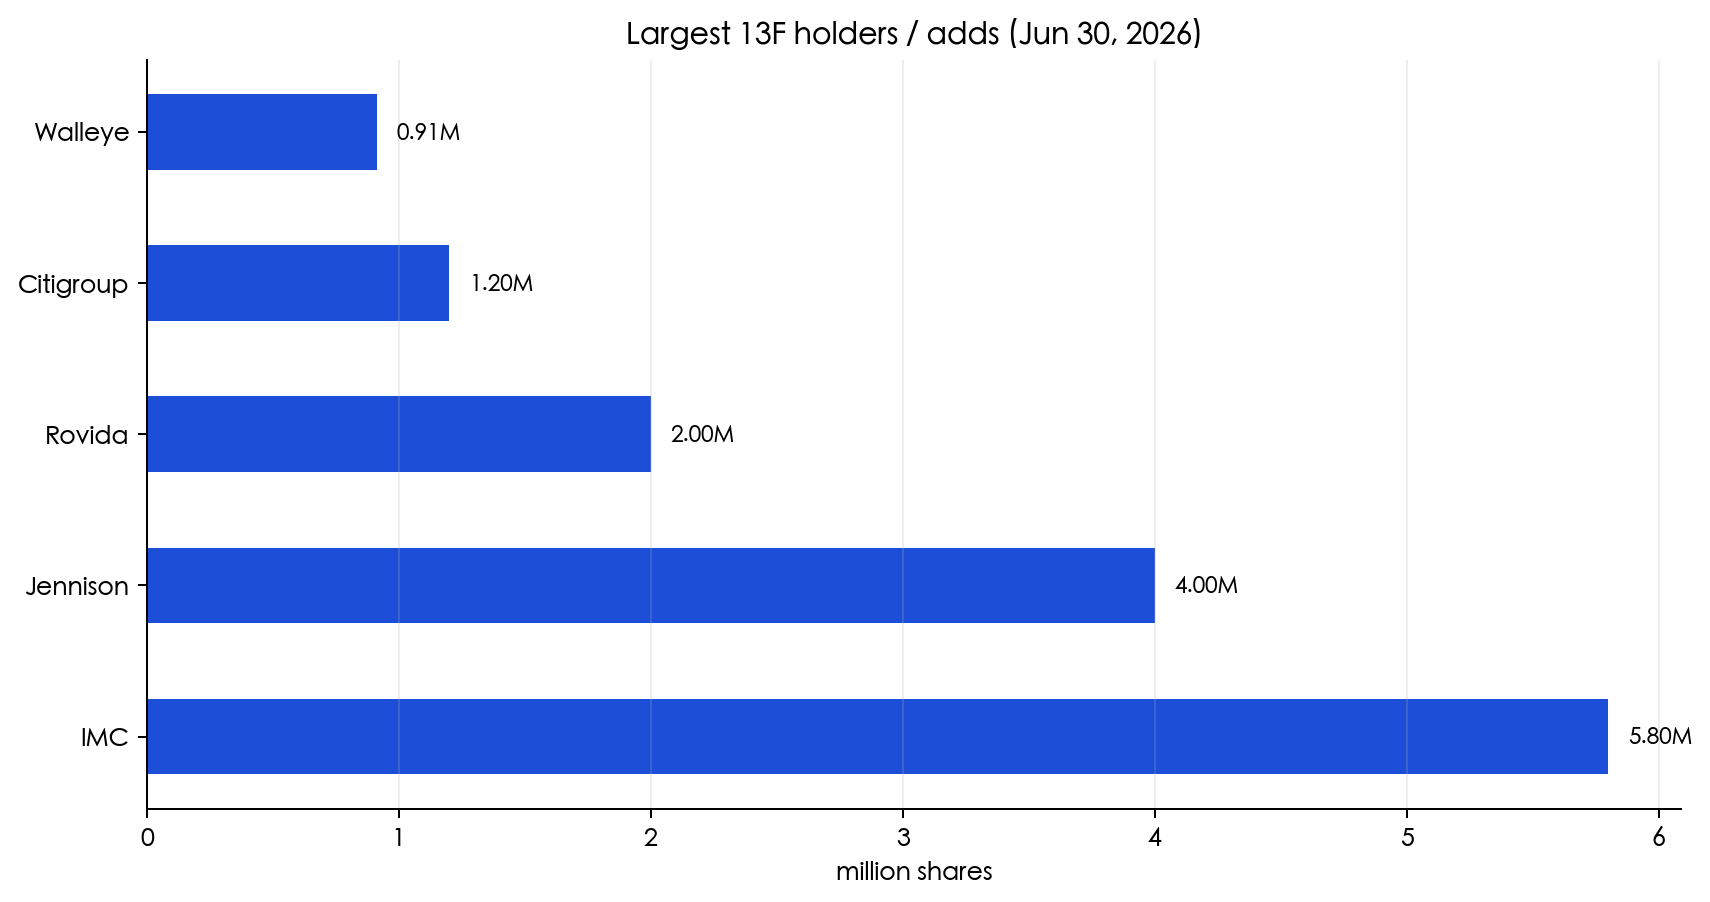
SEC 13F aggregation as of June 30, 2026 shows about 549 institutions and approximately $6.10B of reported value; the largest adds include IMC, Jennison, Rovida, Citigroup and Walleye. This is quarterly-lagged, not real-time ownership.[SEC 13F aggregation]
Insider sample
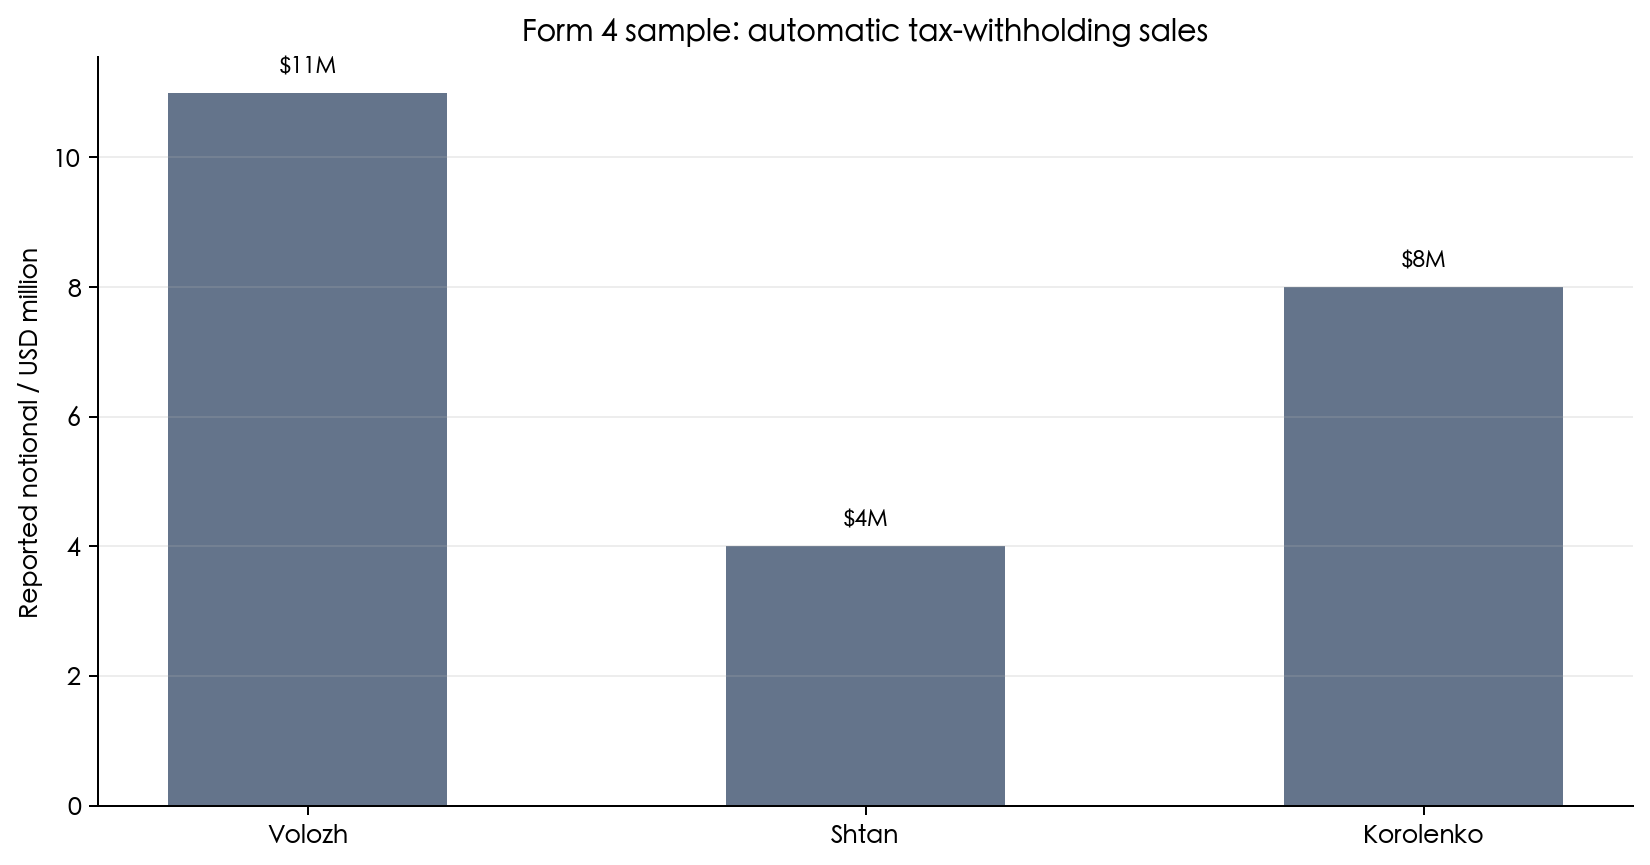
The verifiable Form 4 sample is mainly RSU-vesting tax-withholding sales by the CEO/CTO/CIO, with reported notionals of about $11M, $4M and $8M; another filing was a 10b5-1 planned sale. The sample is incomplete and should not be read as discretionary management-wide bearishness.[SEC Form 4]
§07Valuation & Target
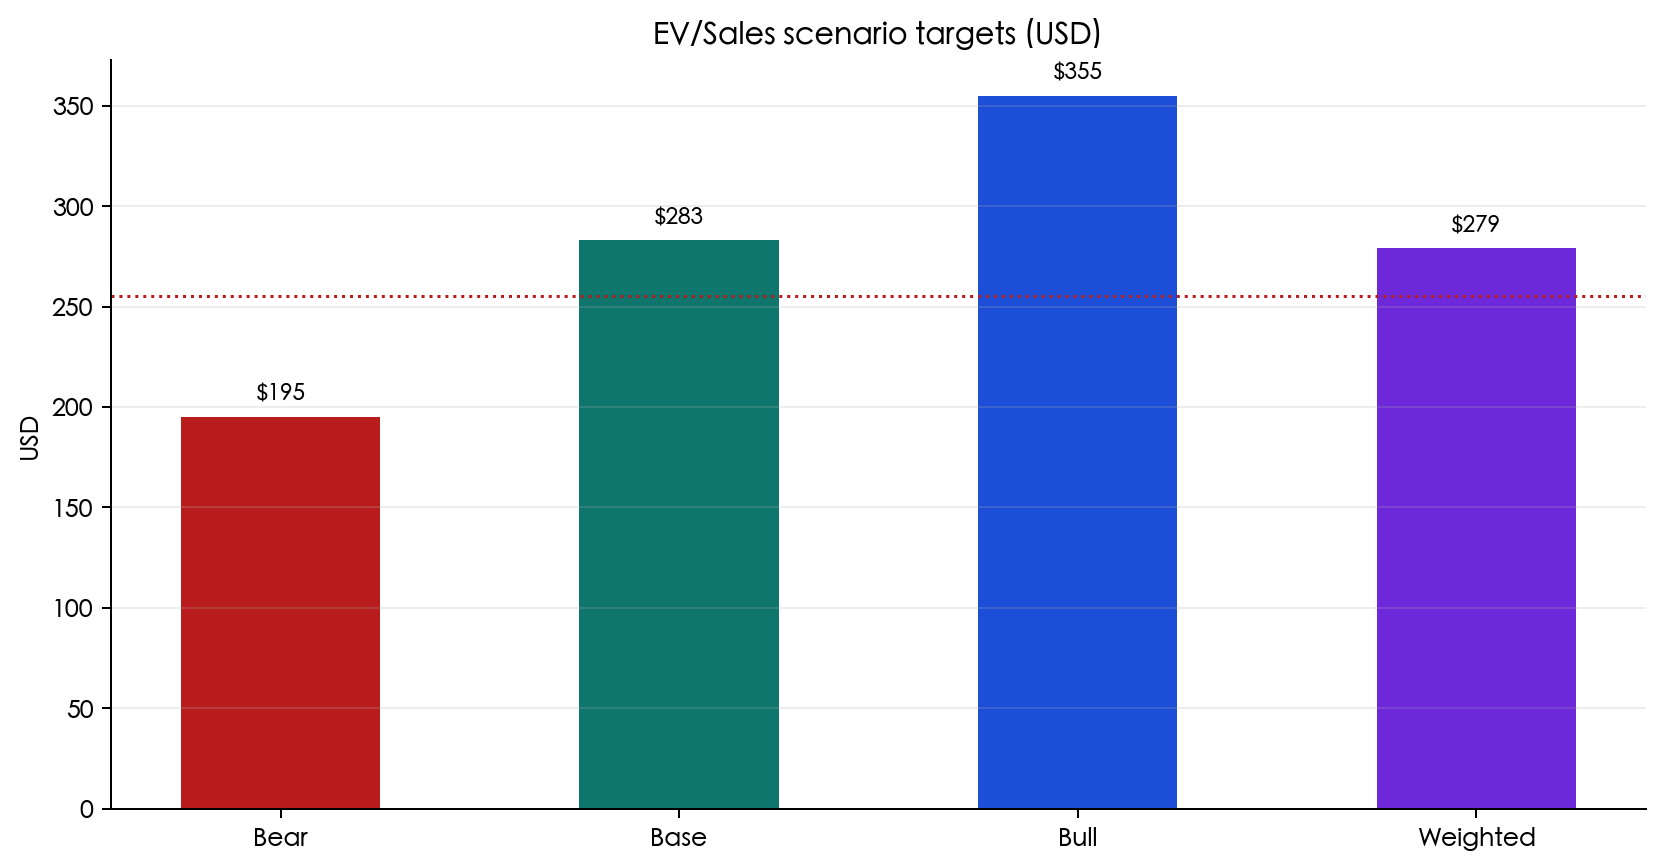
Primary method: (8.0x × FY2027E $10.78B − $0.5036B net debt) ÷ 0.3026187B diluted shares = $283.31; after a 1.523% execution discount, the method PT is $279.00. P/E is rejected because FY2026E/FY2027E EPS consensus is negative.[consensus revenue and EPS]
| 情景 / Scenario | 概率 | FY2027E revenue | EV/Sales | 目标价 |
|---|---|---|---|---|
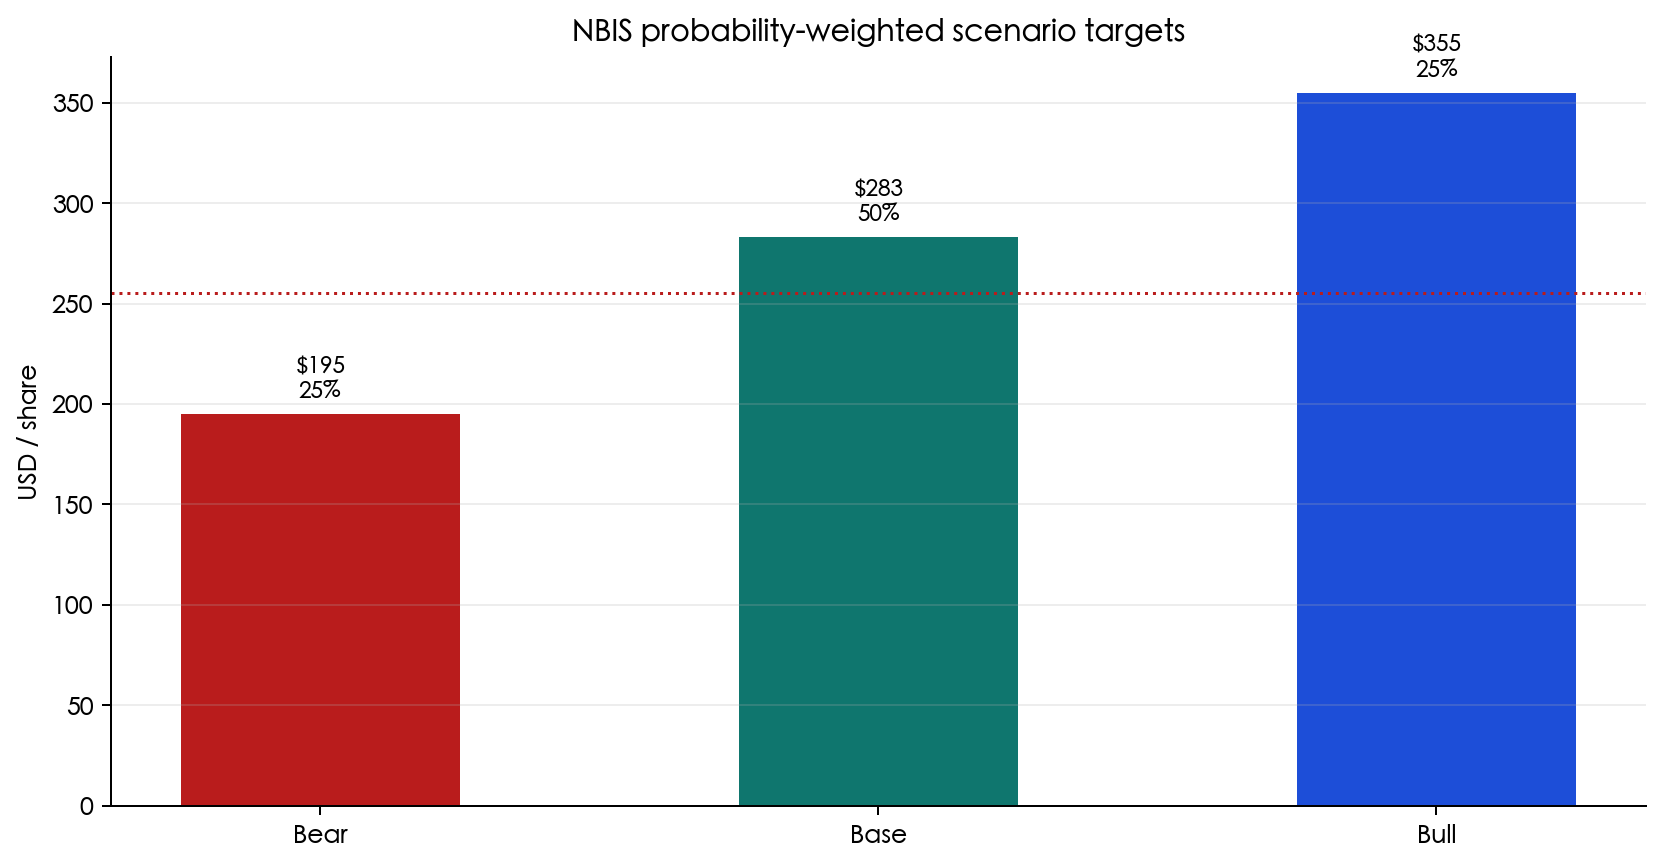
| Bear / 悲观 | 25% | $8.50B | 7.0x | $195 |
| Base / 基准 | 50% | $10.78B | 8.0x | $283 |
| Bull / 乐观 | 25% | $12.00B | 9.0x | $355 |
概率加权校验:25% × $195 + 50% × $283 + 25% × $355 = $279.00;与方法目标价 $279 的偏离为 0.00%。
§S9 情景压力测试 / Scenario Stress Test
This is a stress test, not the primary pricing path. Falsifiers: Bear is FY2027 revenue below $8.50B or a funding miss; Bull requires revenue above $12.00B with customer-prepayment funding intact. IRR direction check: target upside is 9.4%, consistent with HOLD.
§08Catalysts & Risks
| 日期 / Date | 催化剂 / Catalyst | 看多条件 / Bull | 风险条件 / Bear |
|---|---|---|---|
| 2026-09-11 | CPI | 核心通胀回落,长久期资产重估 | 通胀反复,倍数压缩 |
| 2026-09-15–16 | FOMC + SEP | 偏鸽,融资环境改善 | 偏鹰,EV/Sales 下修 |
| 2026-10-22* | Q3 earnings | 收入 ≥ $1.00B 且 FY26 guide raise | 收入 < $0.90B 或 guide cut |
| 2026-11-12 | 供应链/融资复核 | GPU、电力、预付款兑现 | 5GW 延迟或融资稀释 |
* Q3 具体财报日期尚未以公司公告核实,2026-10-22 为第三方估计 [third-party calendar]。
| 风险 / Risk | 影响 / Impact | 跟踪 / Monitor |
|---|---|---|
| 资本开支与电力 | 现金流缺口、上线延期 | 季度 capex、power-on dates |
| 融资与稀释 | 每股价值下降 | debt terms、shares outstanding、ATM |
| 客户兑现 | FY2027 revenue miss | ACV/MW、billings、prepayments |
| 短仓与期权 | 波动放大、逼空反转 | short interest、IV snapshots |
§S10 操作建议 / Operating Advice
Rating: HOLD. Do not chase the post-earnings impulse; treat $279 as a model target, not a promise; for new positions, wait for $218, $193.23 and $184.11 support zones while financing and capacity execution remain intact.
§09Sources & Disclosure
Primary filing: official attached 6-K [SEC filing index]; source file: /Users/womenaitongtong/Desktop/自媒体/nbis-6k.pdf. Key pages: operations 18–19, balance sheet 17, cash flow 22–23, deferred revenue/RPO 34, segments 48–49, convertible debt 42–44.
| 数据类型 / Data | 来源 / Source | 局限 / Limitation |
|---|---|---|
| Q2/H1 financials | official 6-K / release | Q2 cash flow not separately presented; H1 used |
| Revenue / ARR / capacity | shareholder letter | ARR and capacity are management disclosures |
| Price / RSI | TwelveData / Stocknear | daily closes; monthly RSI unavailable |
| Street / short / options | StockAnalysis / MarketBeat / OptionsAnalysisSuite | different dates and coverage samples |
| DXY / peer real-time valuation | [DATA UNAVAILABLE] | not substituted with non-same-day data |
本报告不构成投资建议。未提供持仓披露。