Microsoft CorporationNASDAQ:MSFT
Published 2026-07-30, with market data as of the 2026-07-29 close. All figures are sourced from Microsoft's official FY2026 annual report (Form 10-K, filed 2026-07-29, fiscal year ended 2026-06-30).
Microsoft's FY2026 revenue was $331.8B (+18% YoY), net income $133.7B (+31% YoY), and diluted EPS $17.95 (+32% YoY); Microsoft Cloud revenue reached $214.4B (+27% YoY) and commercial remaining performance obligations (cRPO) hit a record $678B (+84% YoY), with Azure growth reaccelerating to +41%.
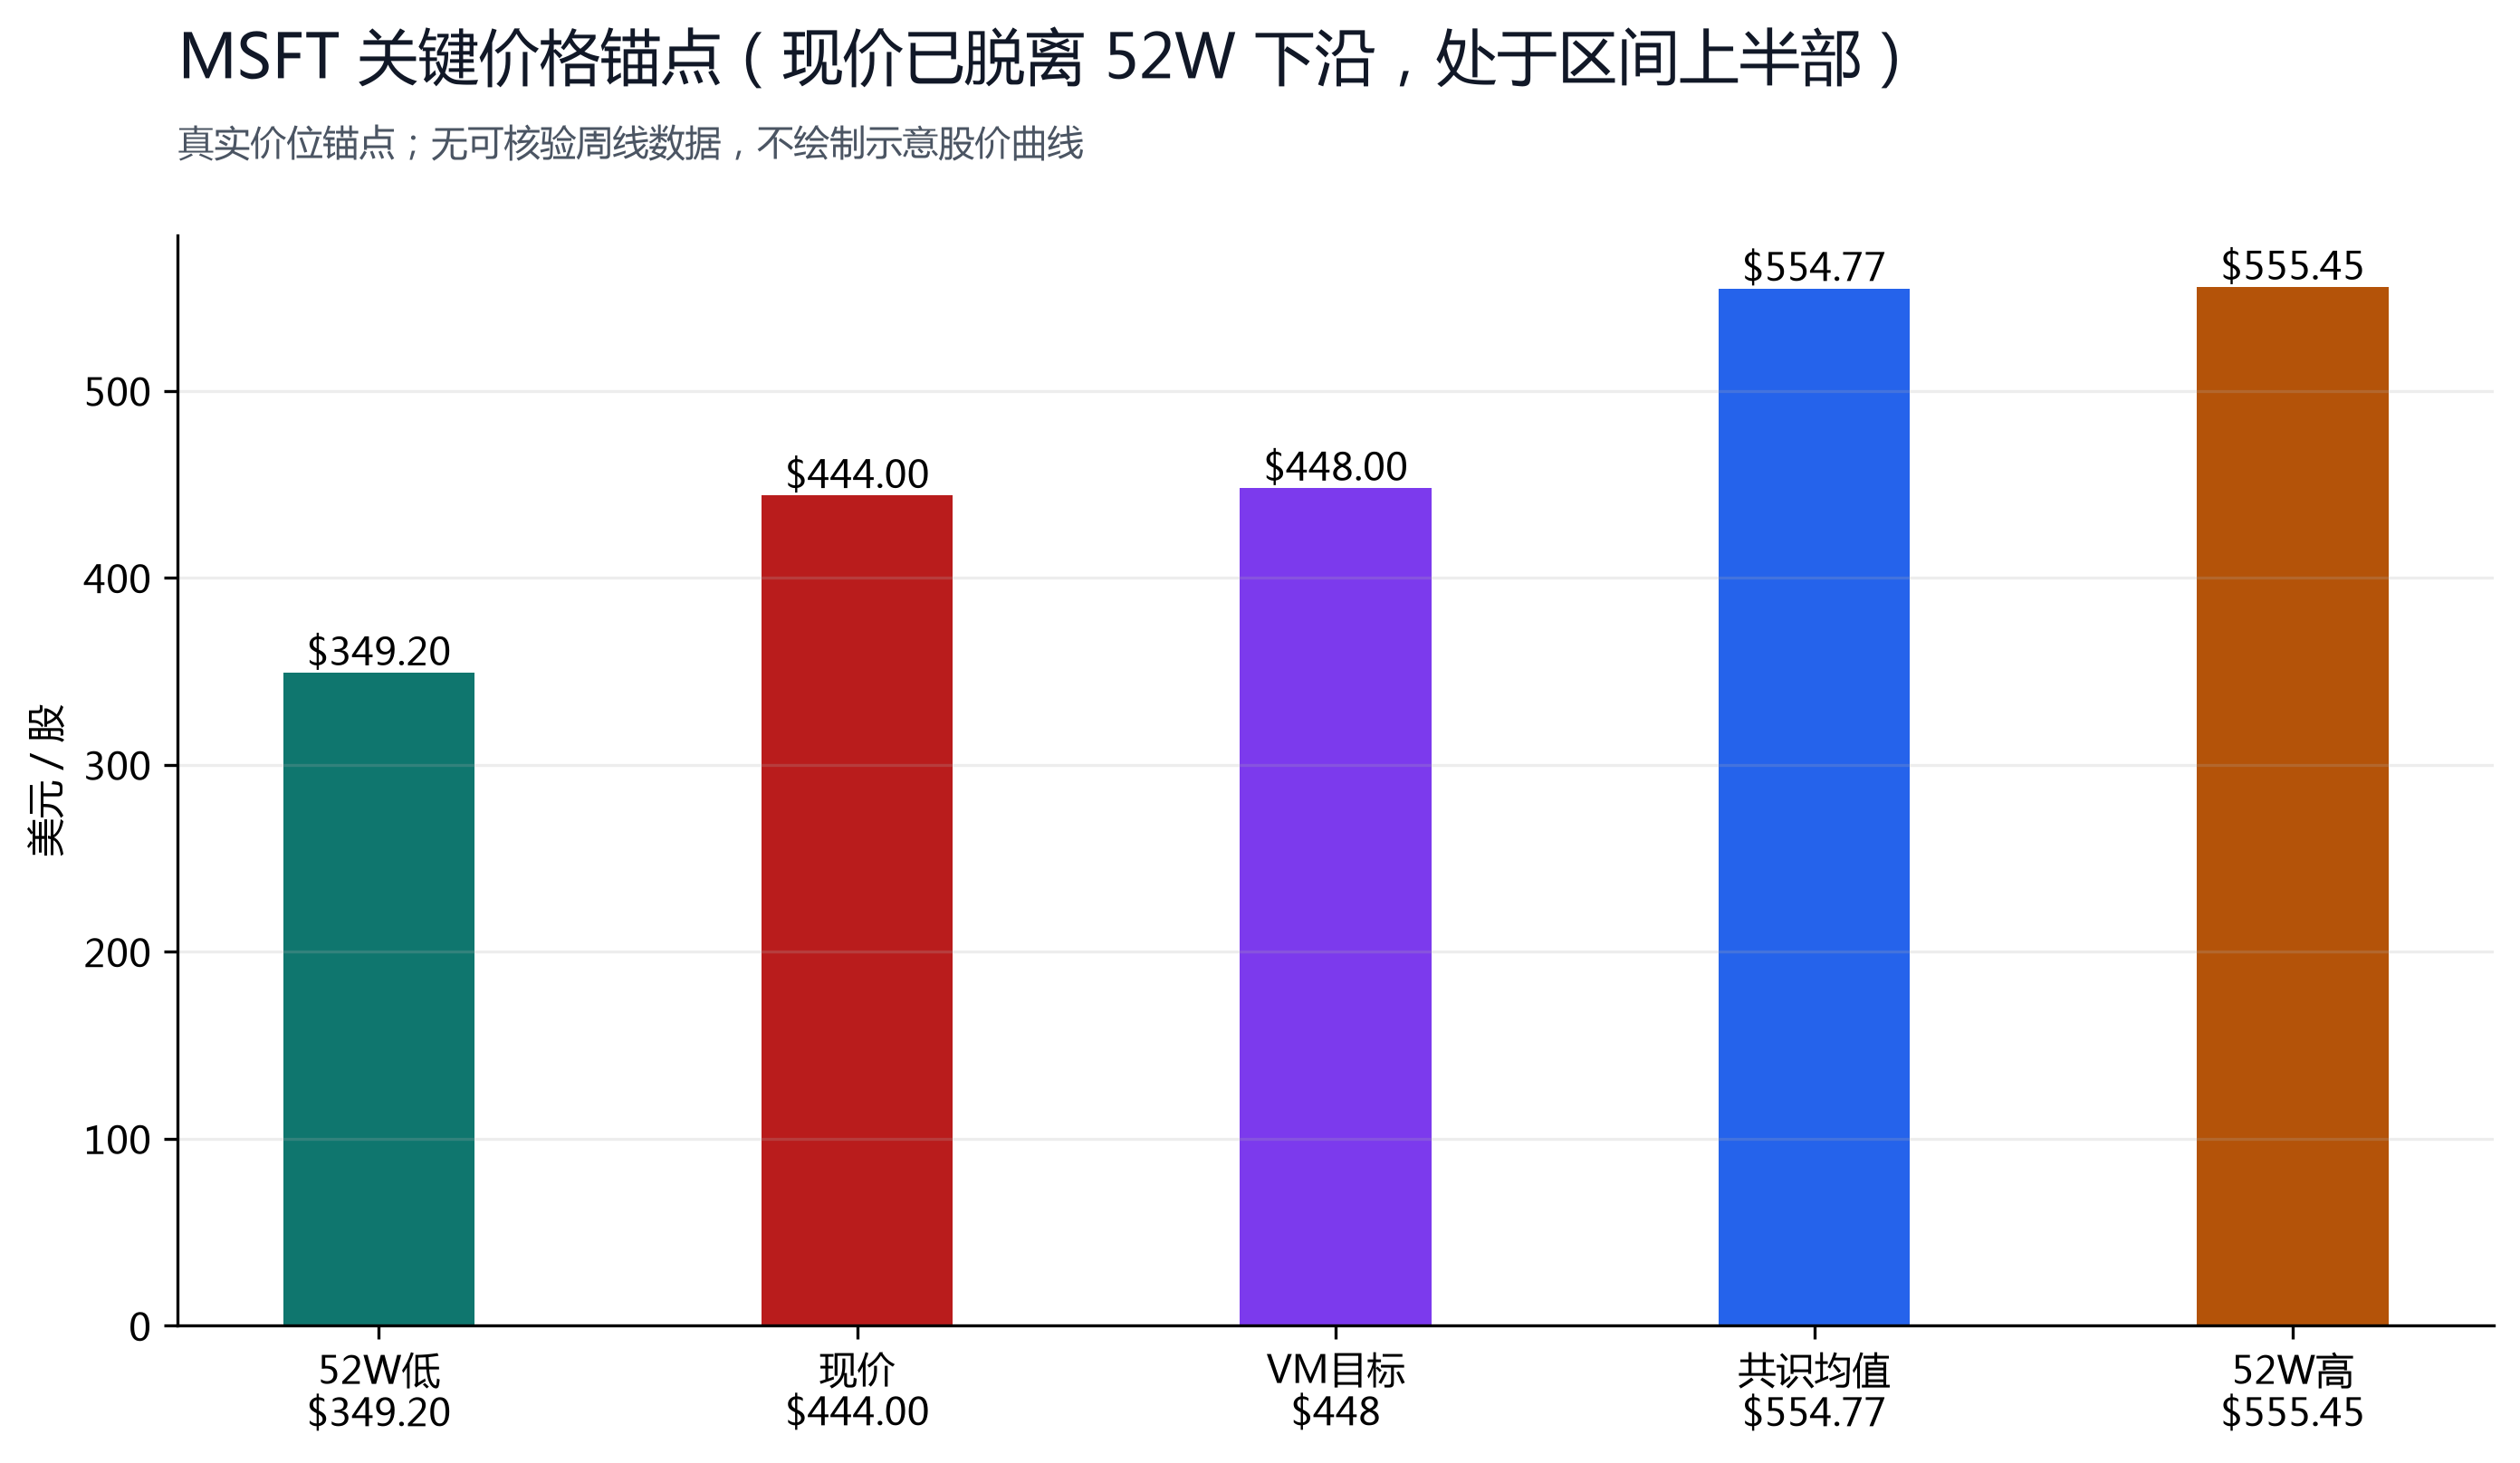
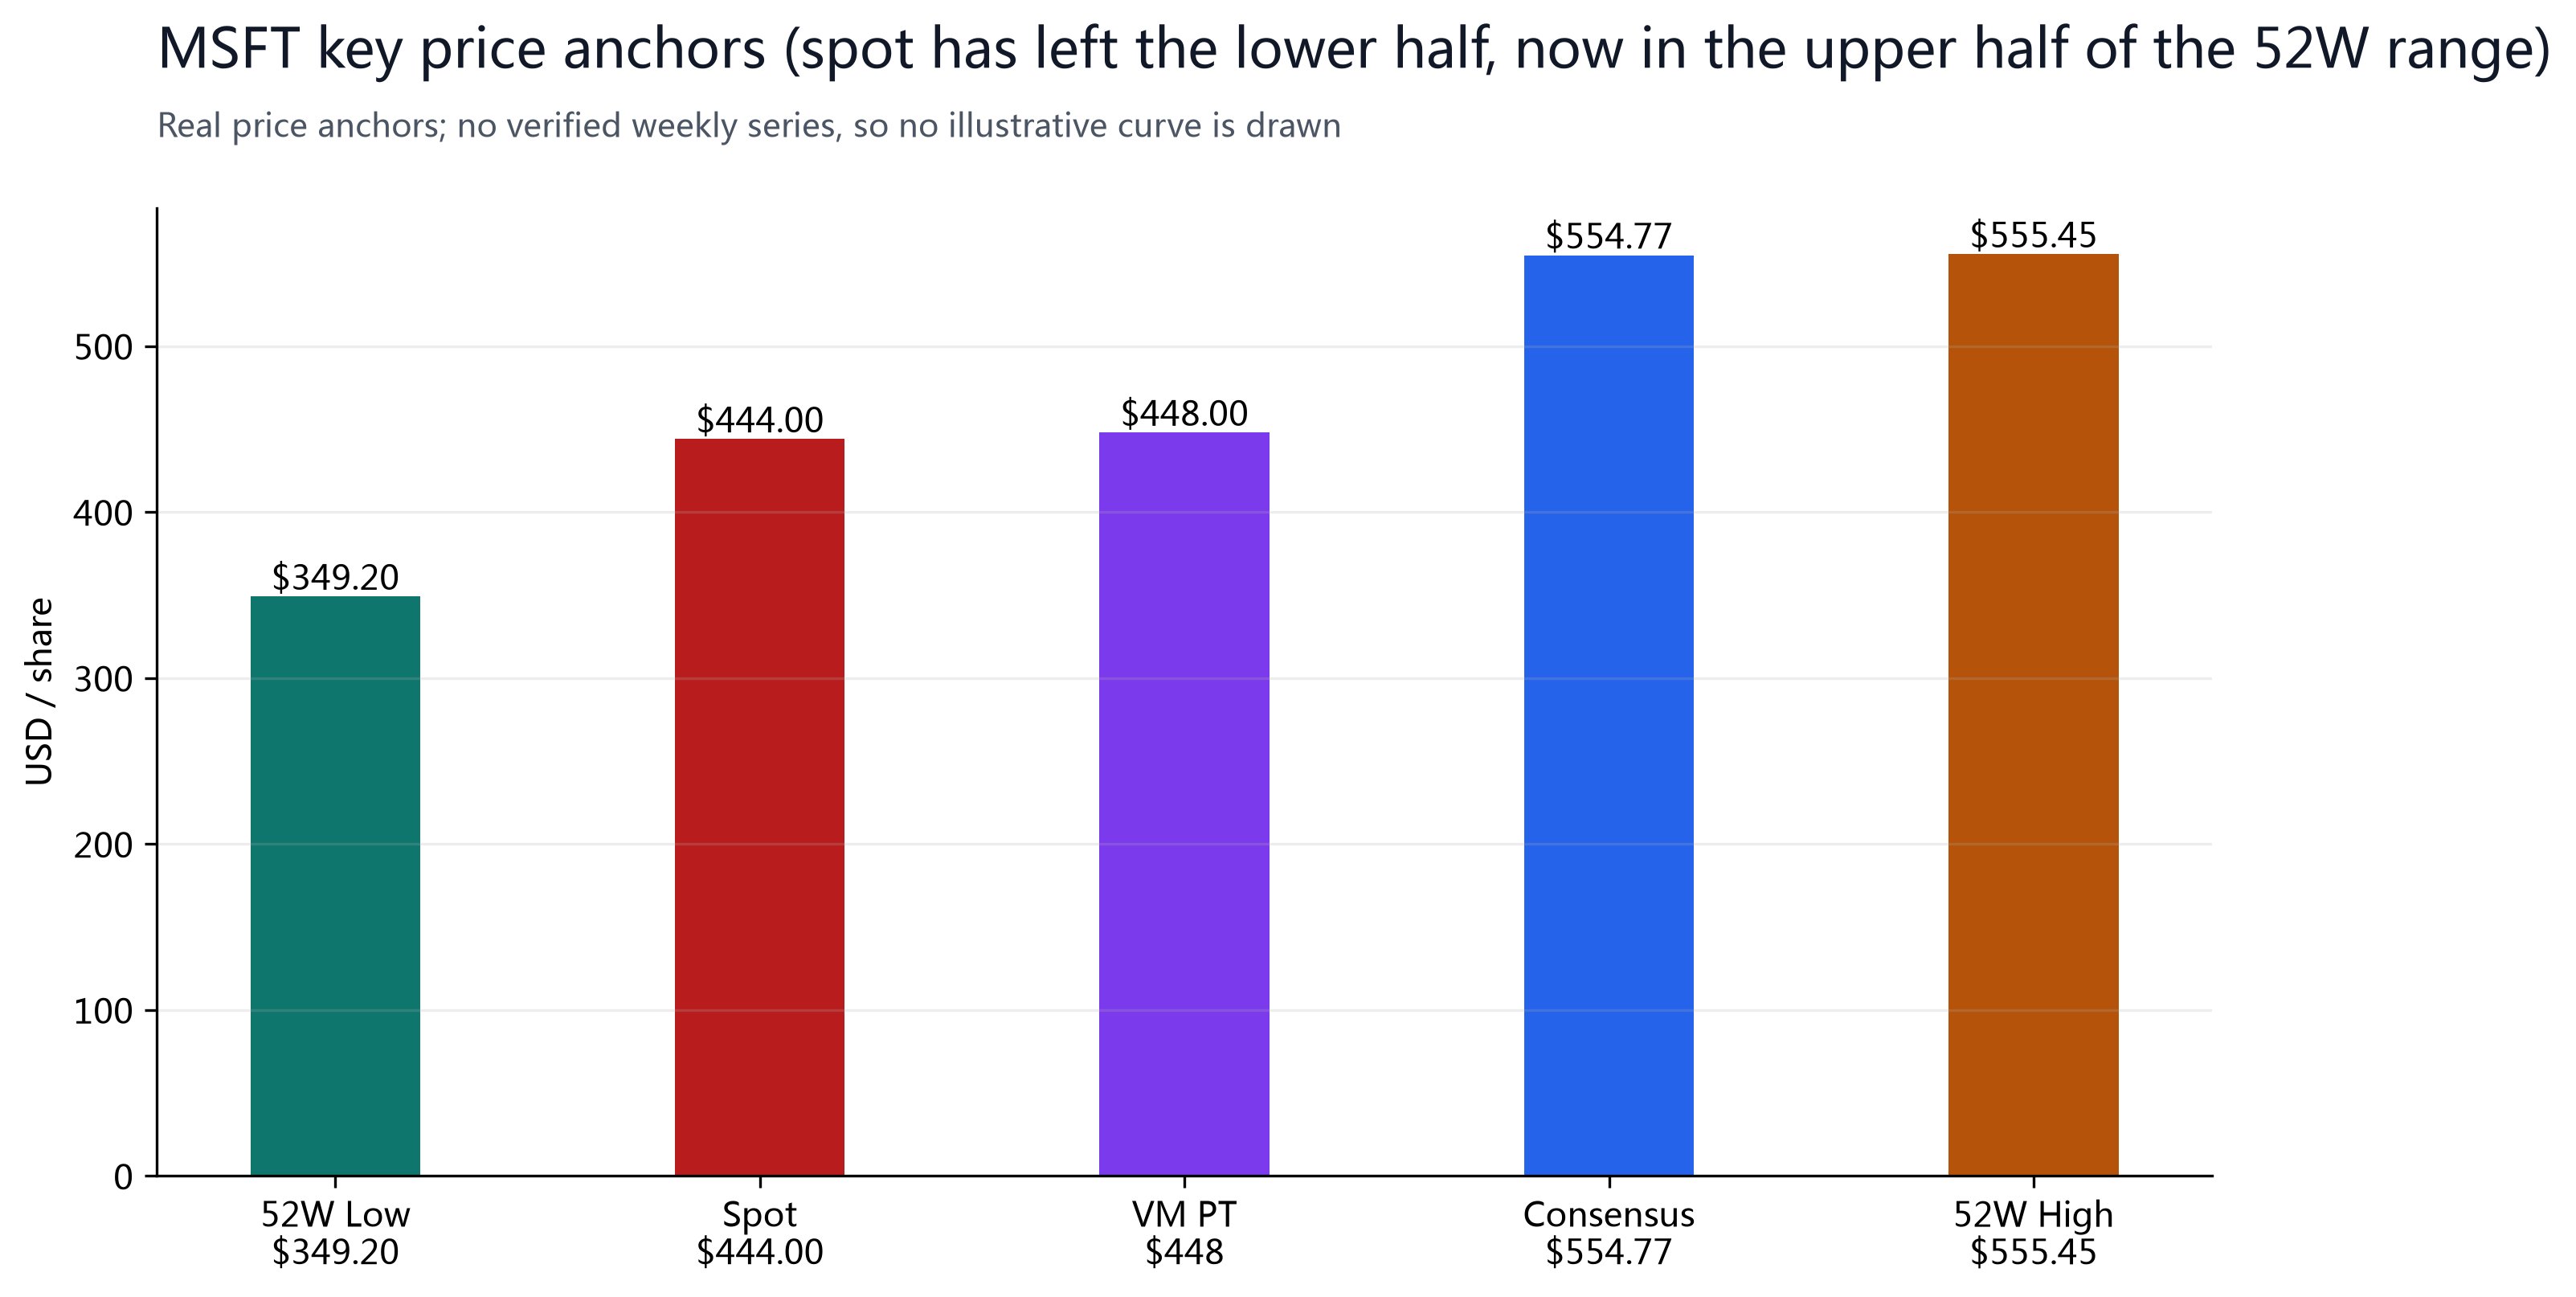
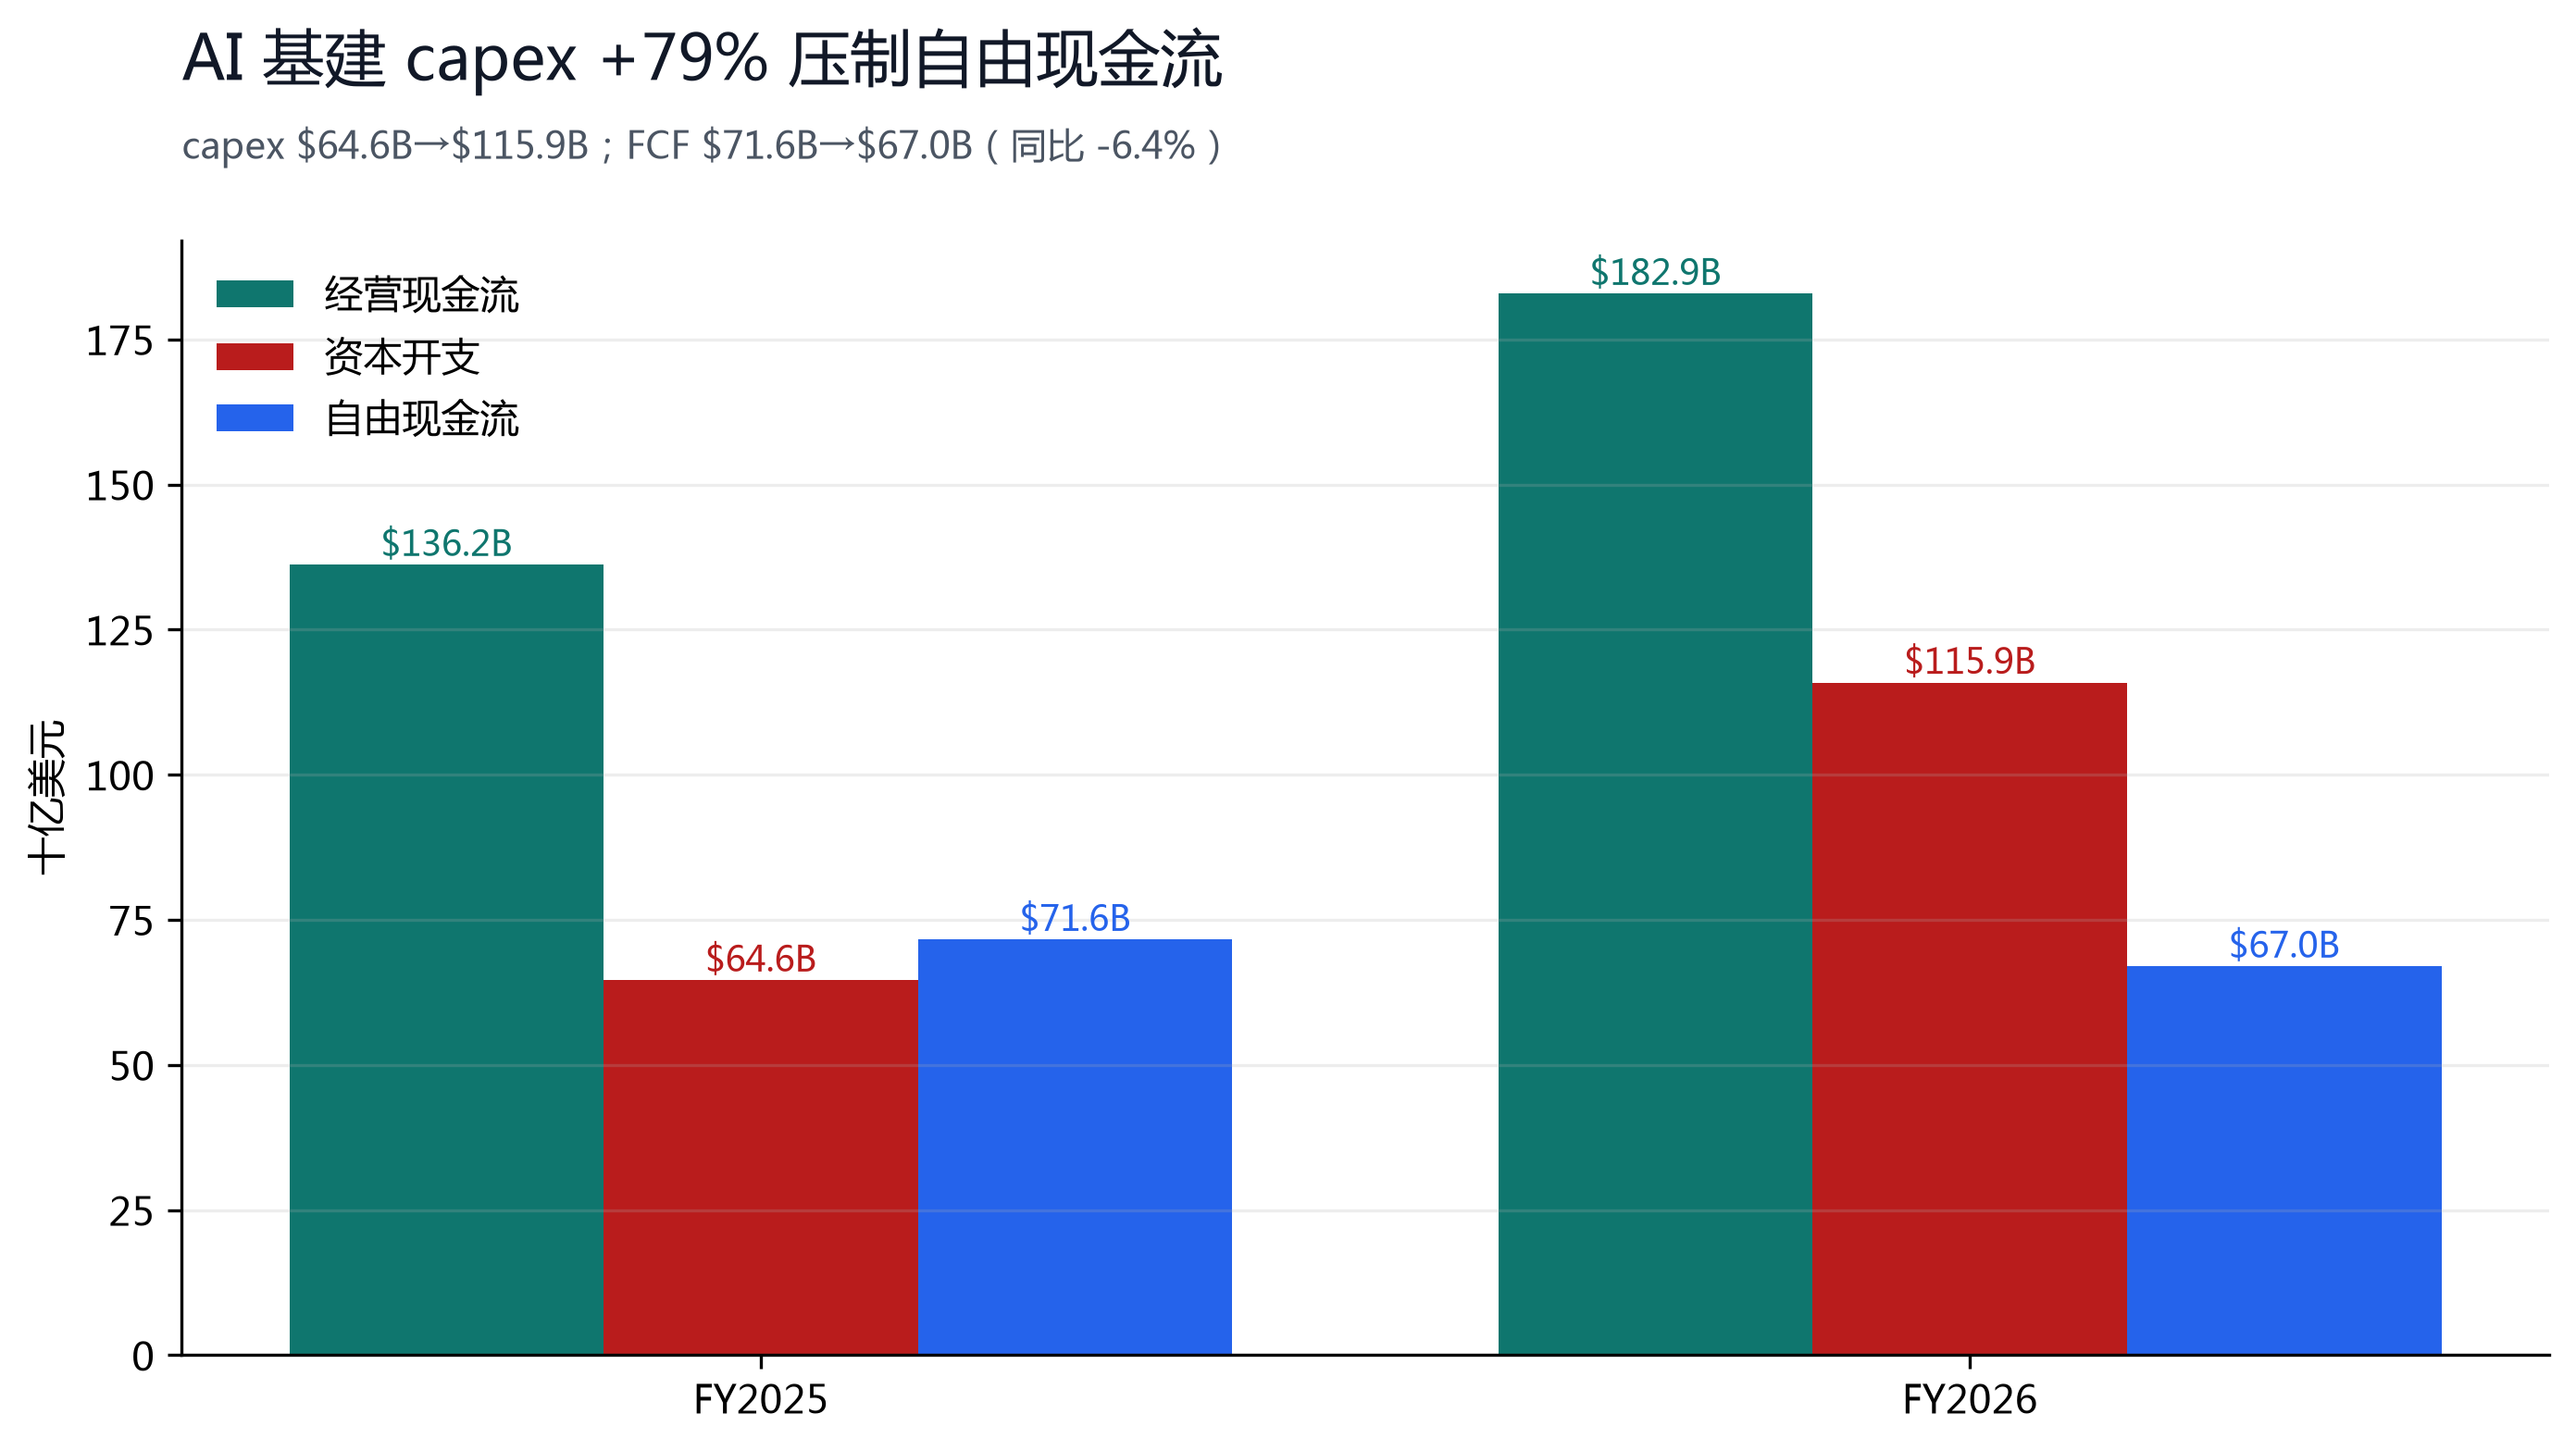
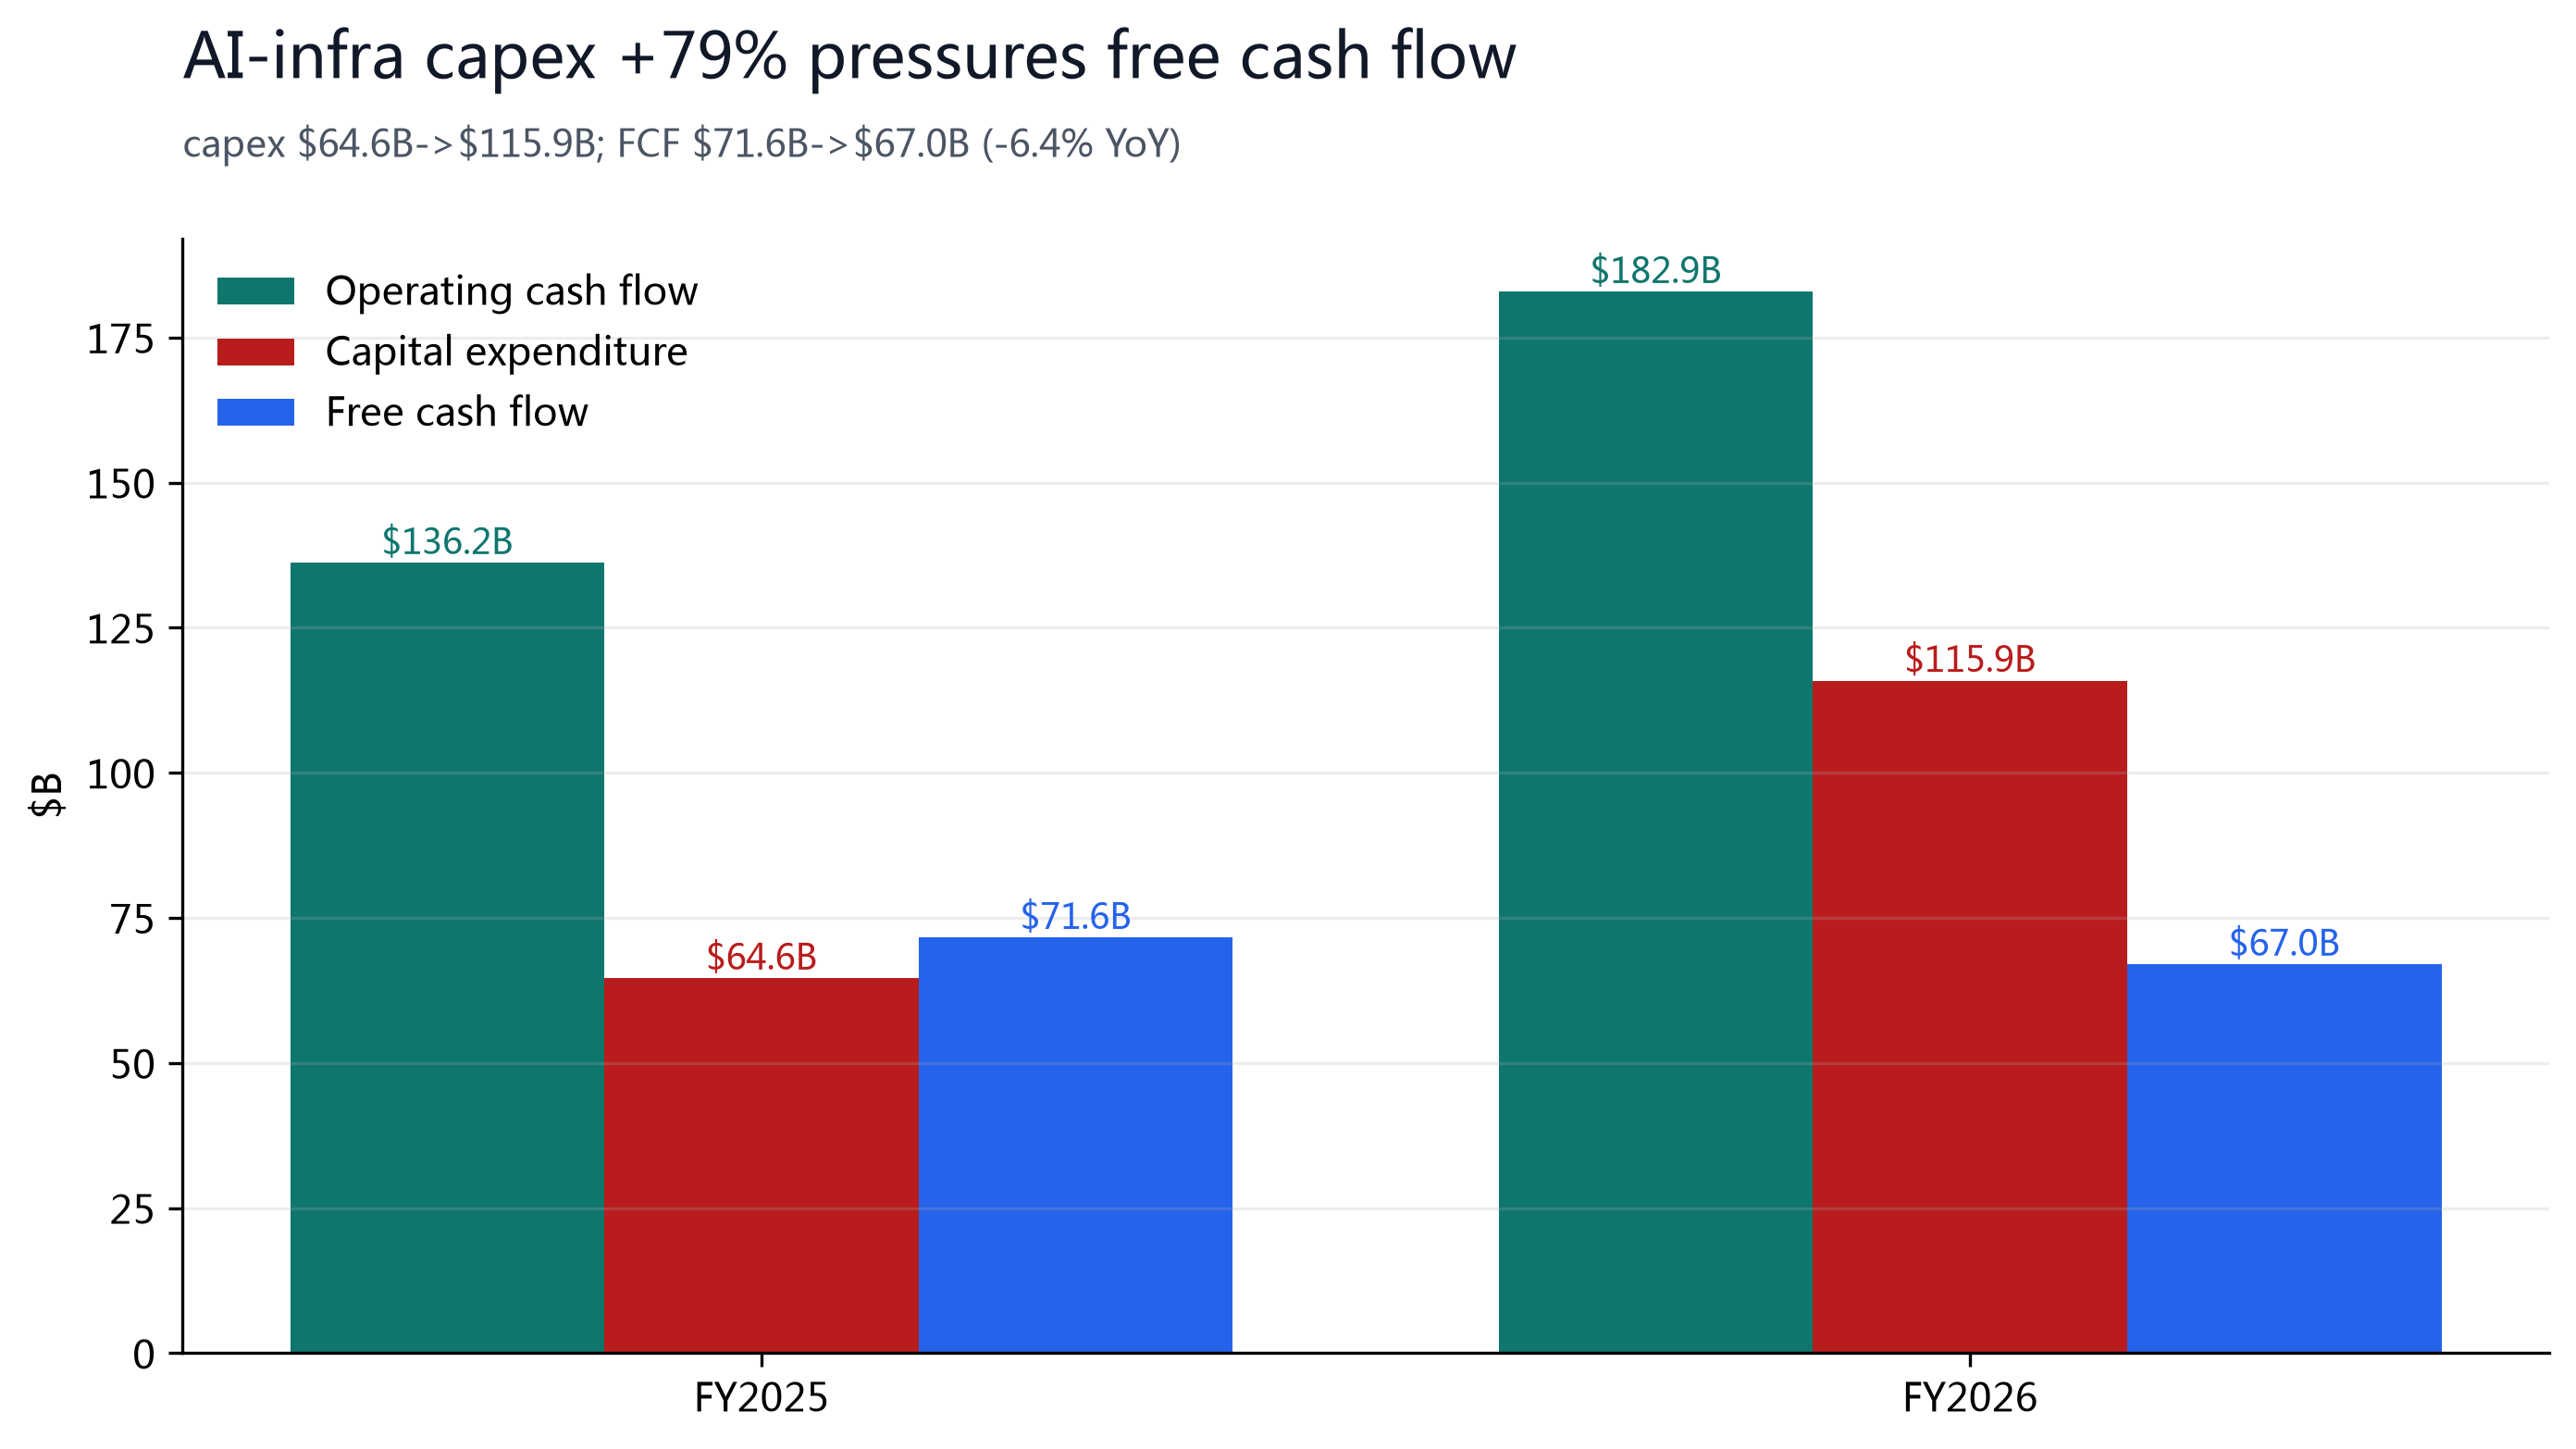
But AI-infrastructure capex rose 79% YoY to $115.9B and free cash flow fell 6.4% YoY to $67.0B, stoking market worries about AI returns; since the 10-K filing the stock has re-rated from $390.54 to $444.00 (+13.7%). We rate it Buy with a 12-month target of $448, about 0.9% above the current price.
§01Investment Summary
For Microsoft, the core question today is not whether cloud and AI are still worth investing in, but what multiple the market will pay for a blue-chip tech asset that is still growing at a mid-teens-to-high-teens clip, posting record margins, and carrying a net-cash balance sheet. We cross-check three P/E scenarios (FY27E EPS of $19.47 times 18/23/28x) to a 12-month price target of $448. The worry was triggered by AI-infra capex surging and pressuring free cash flow — not by any deterioration in fundamentals.
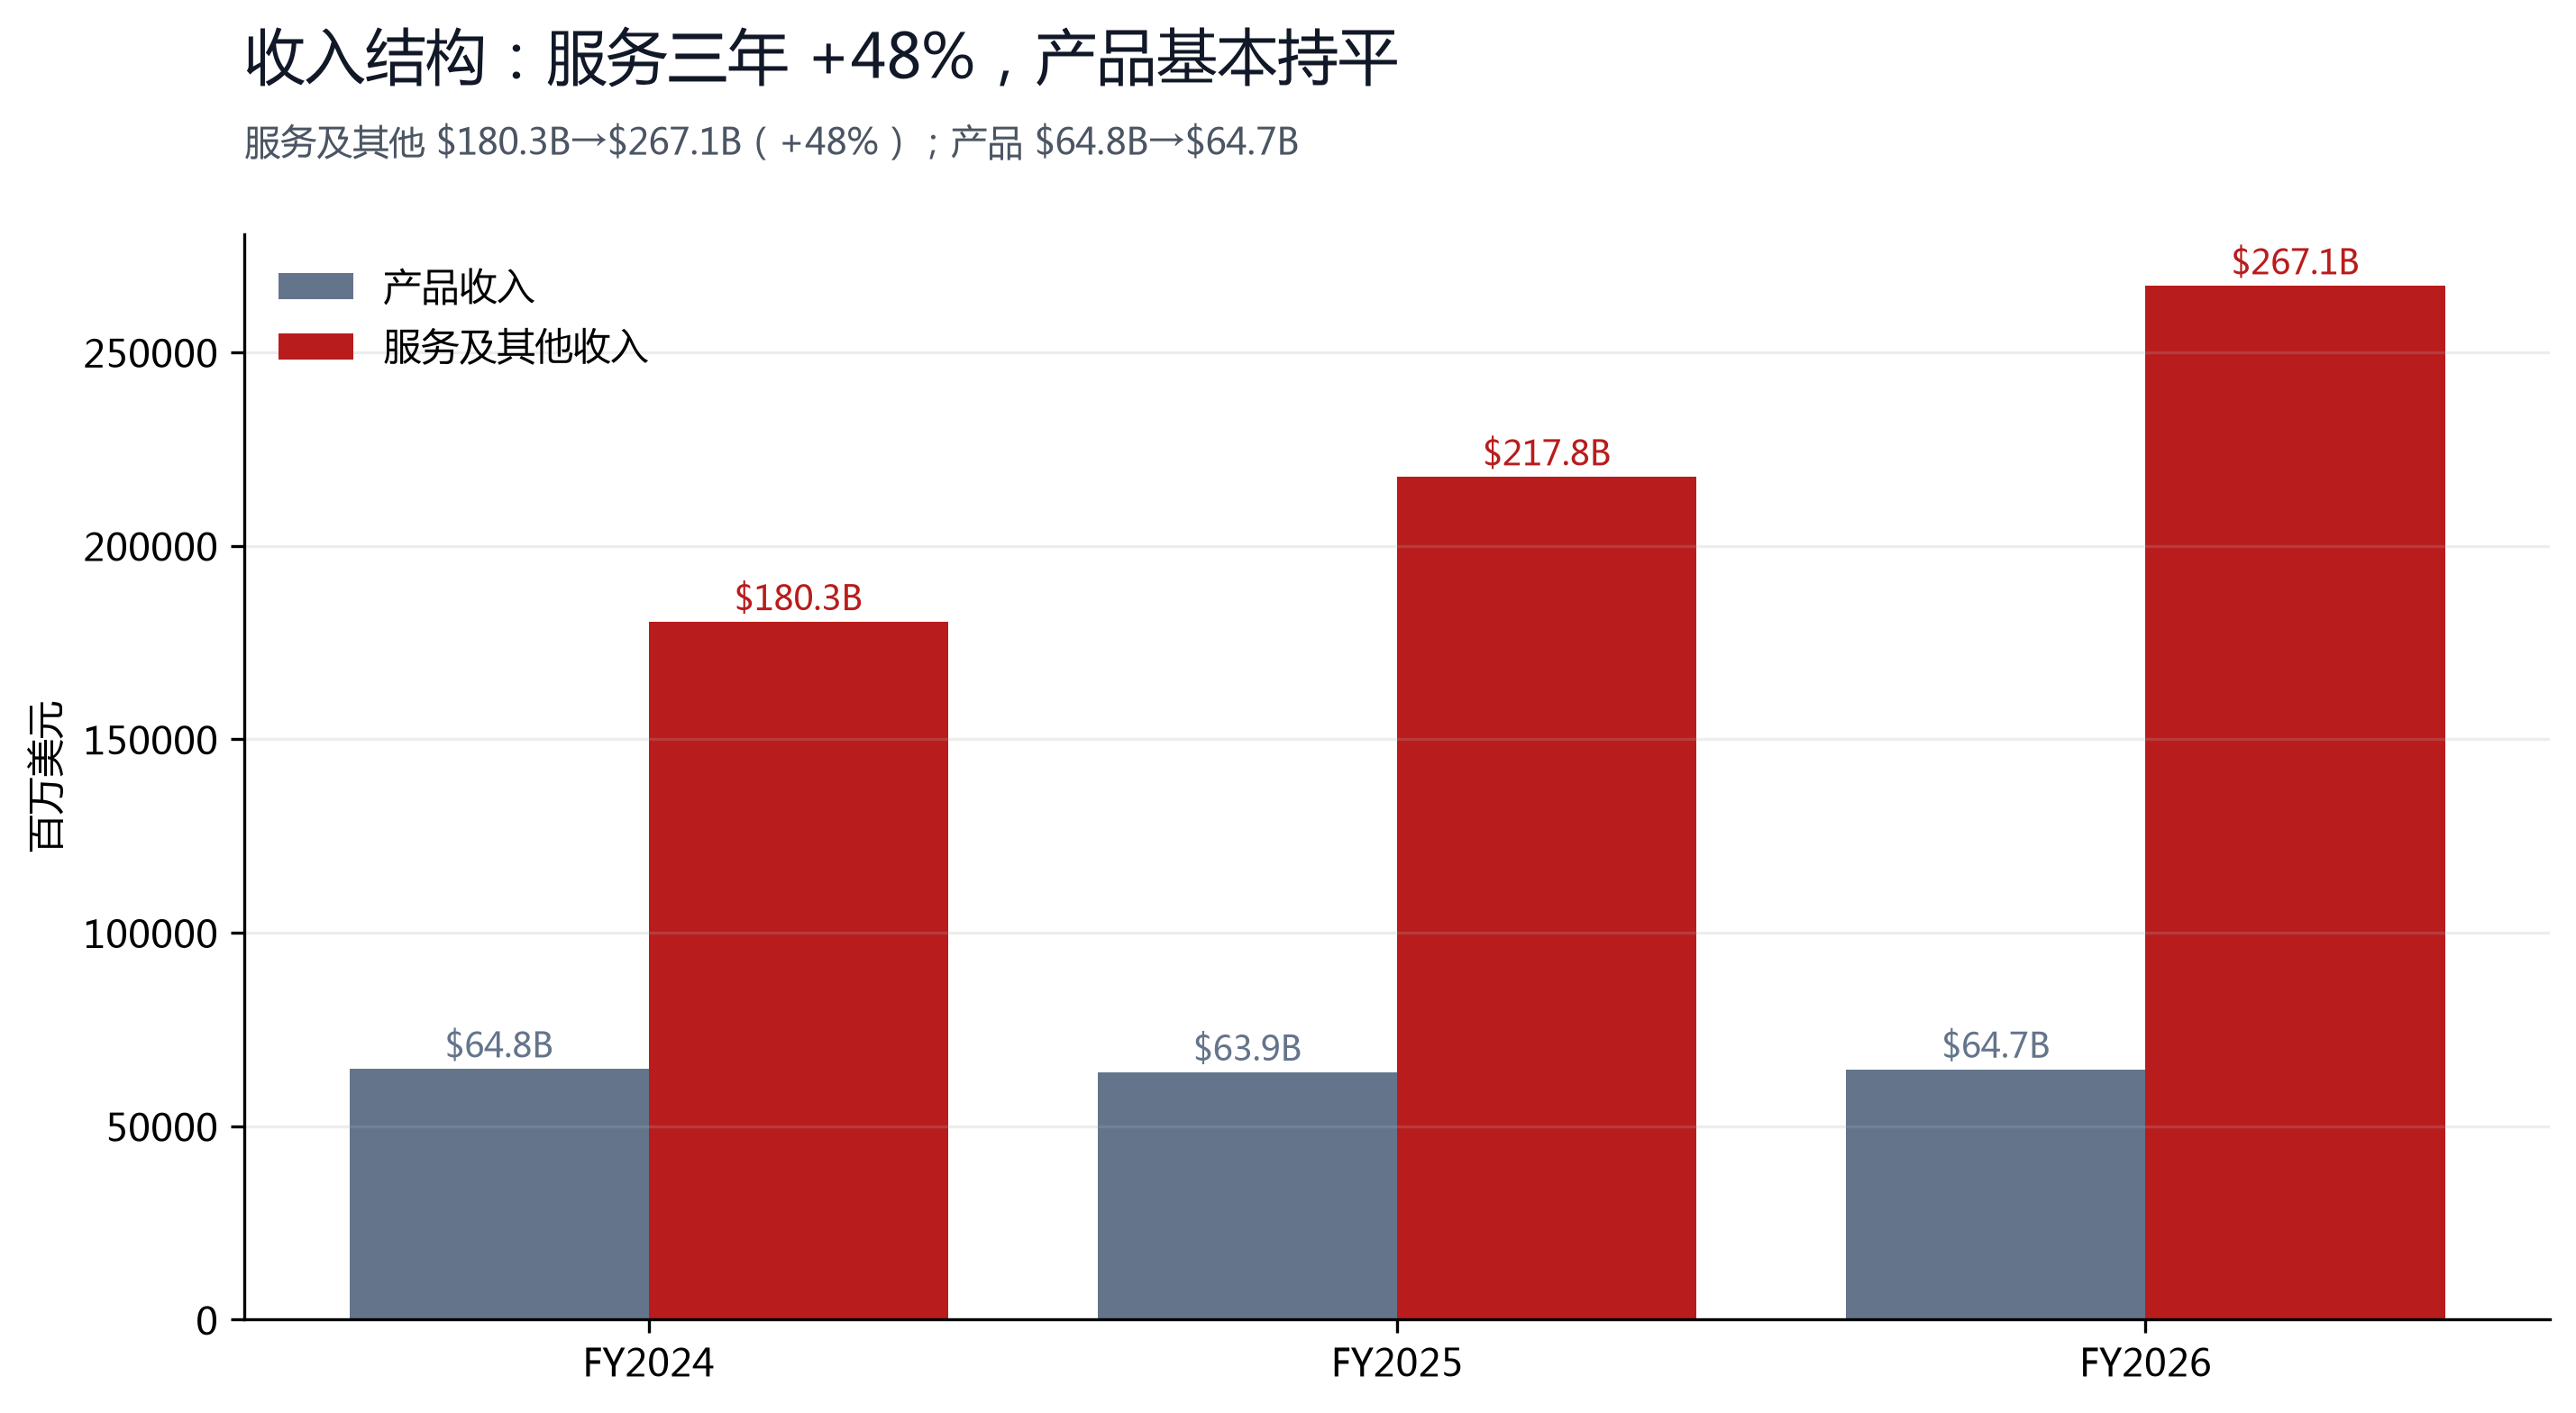
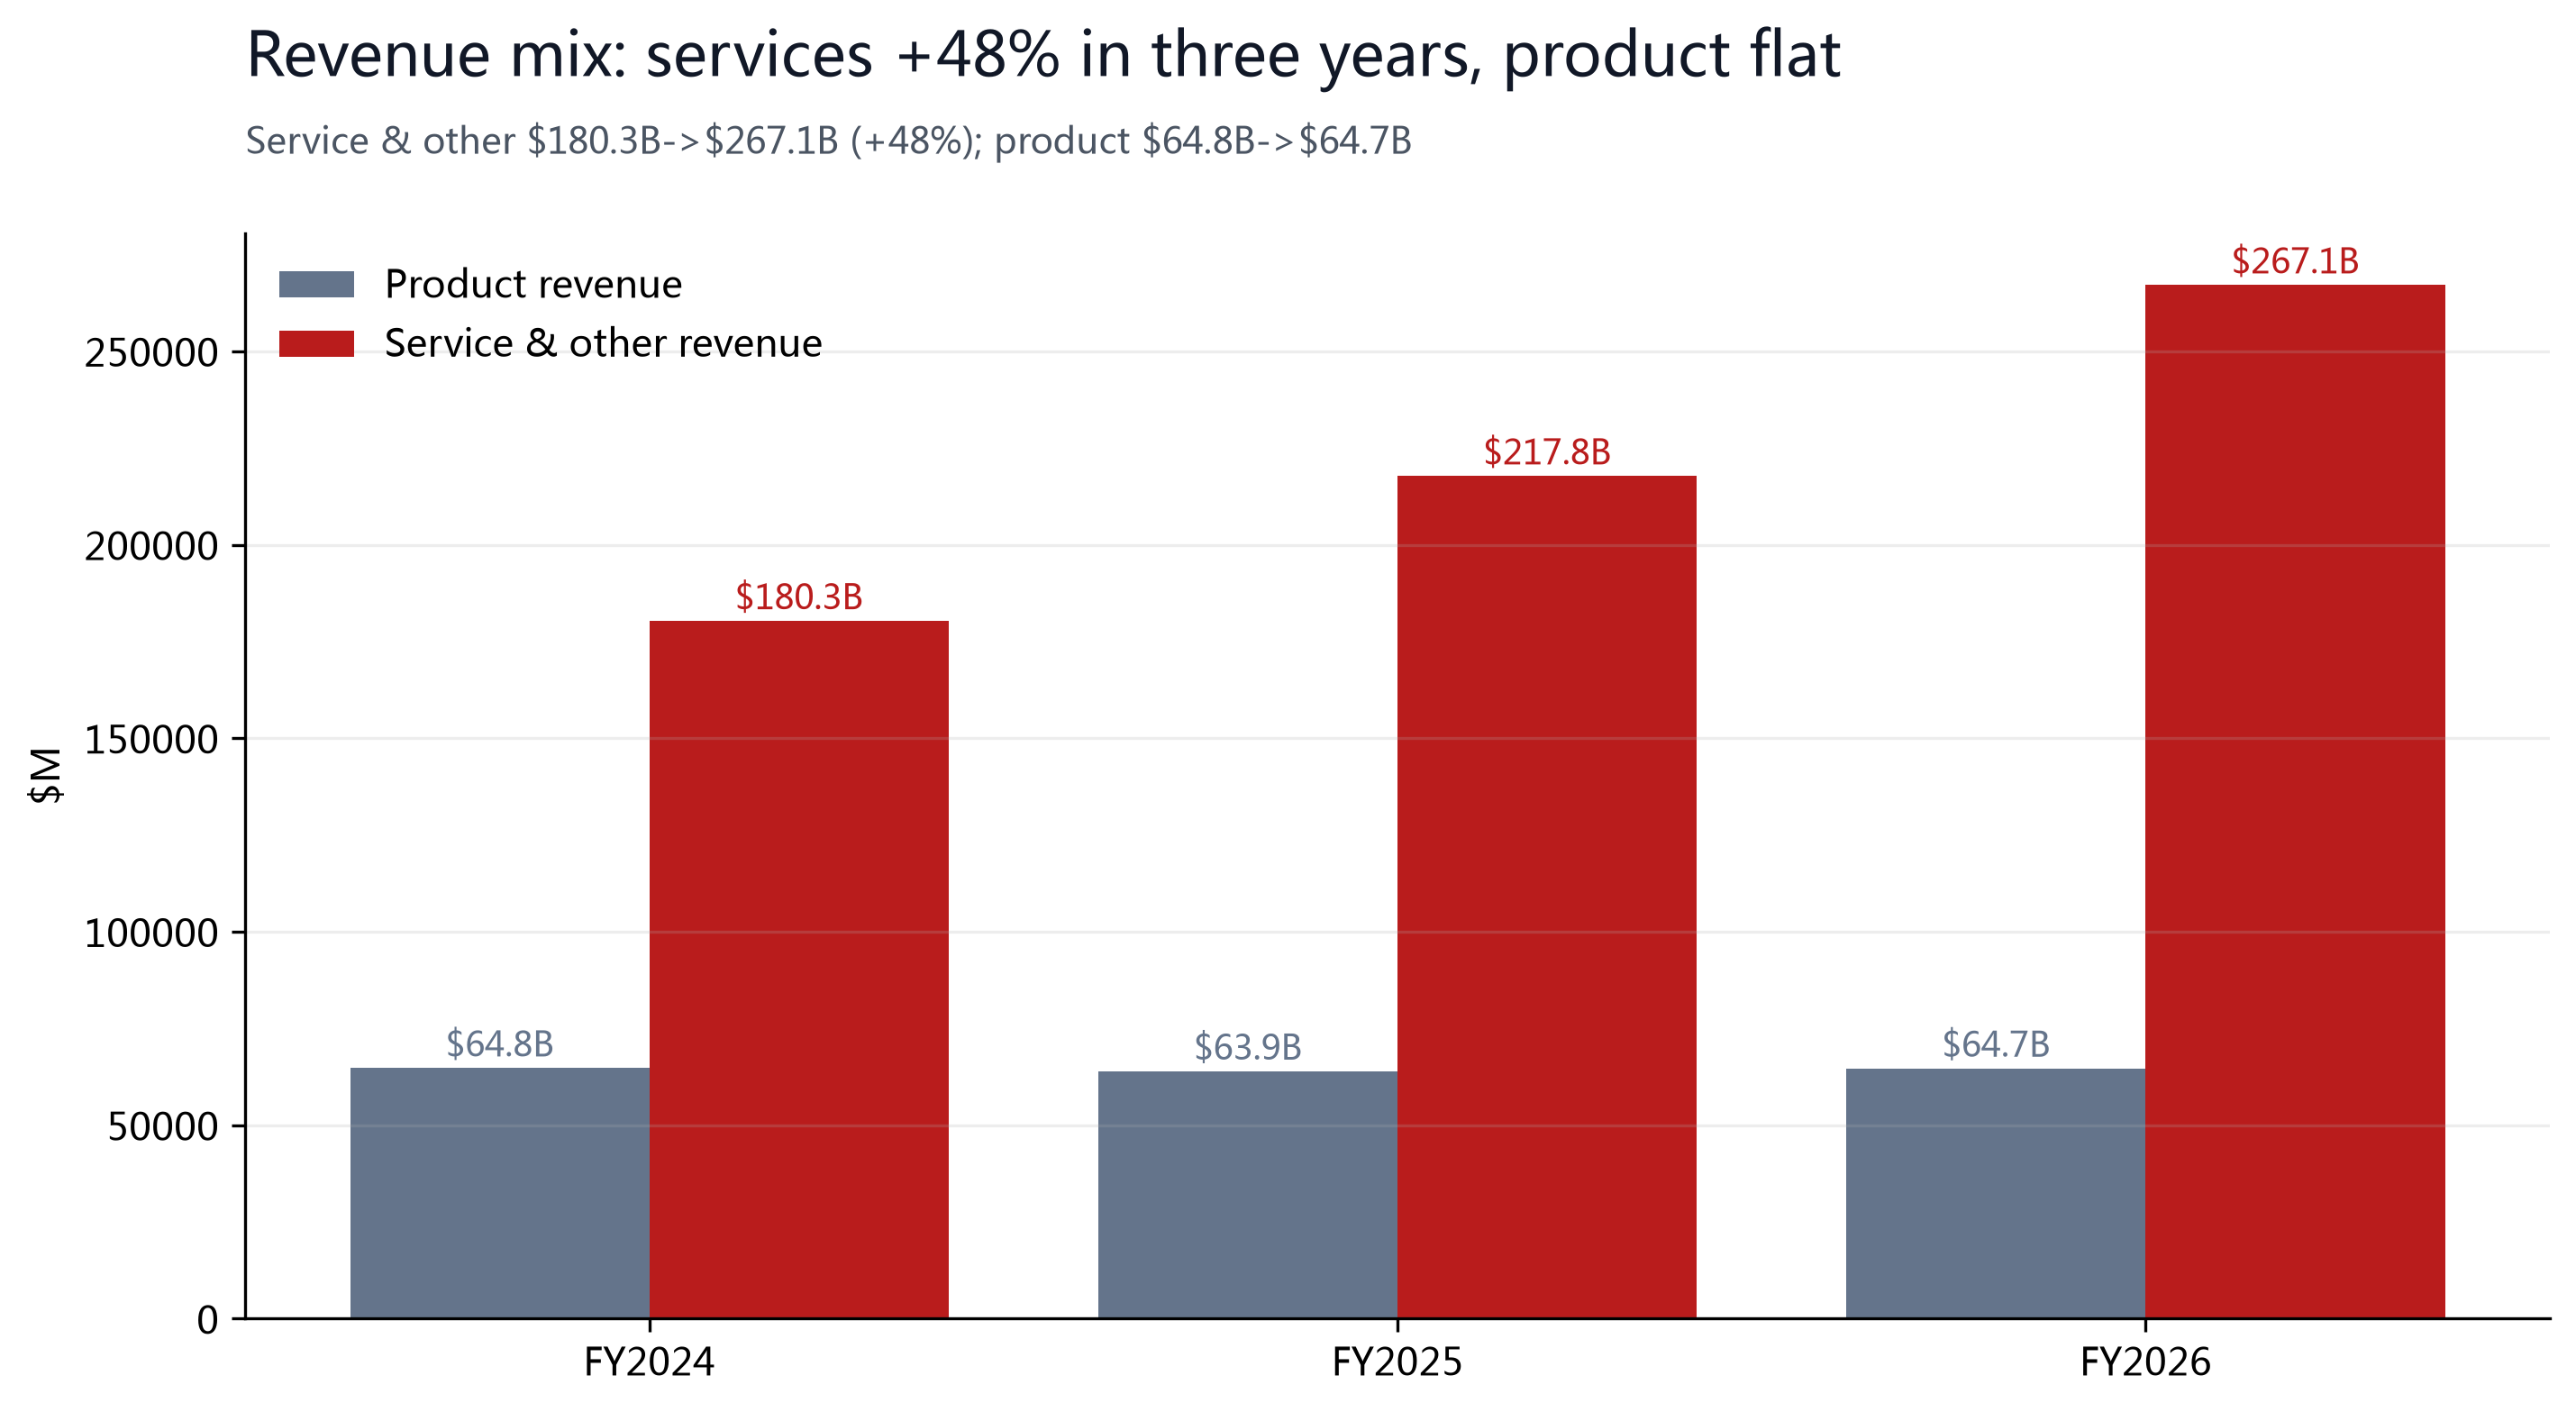
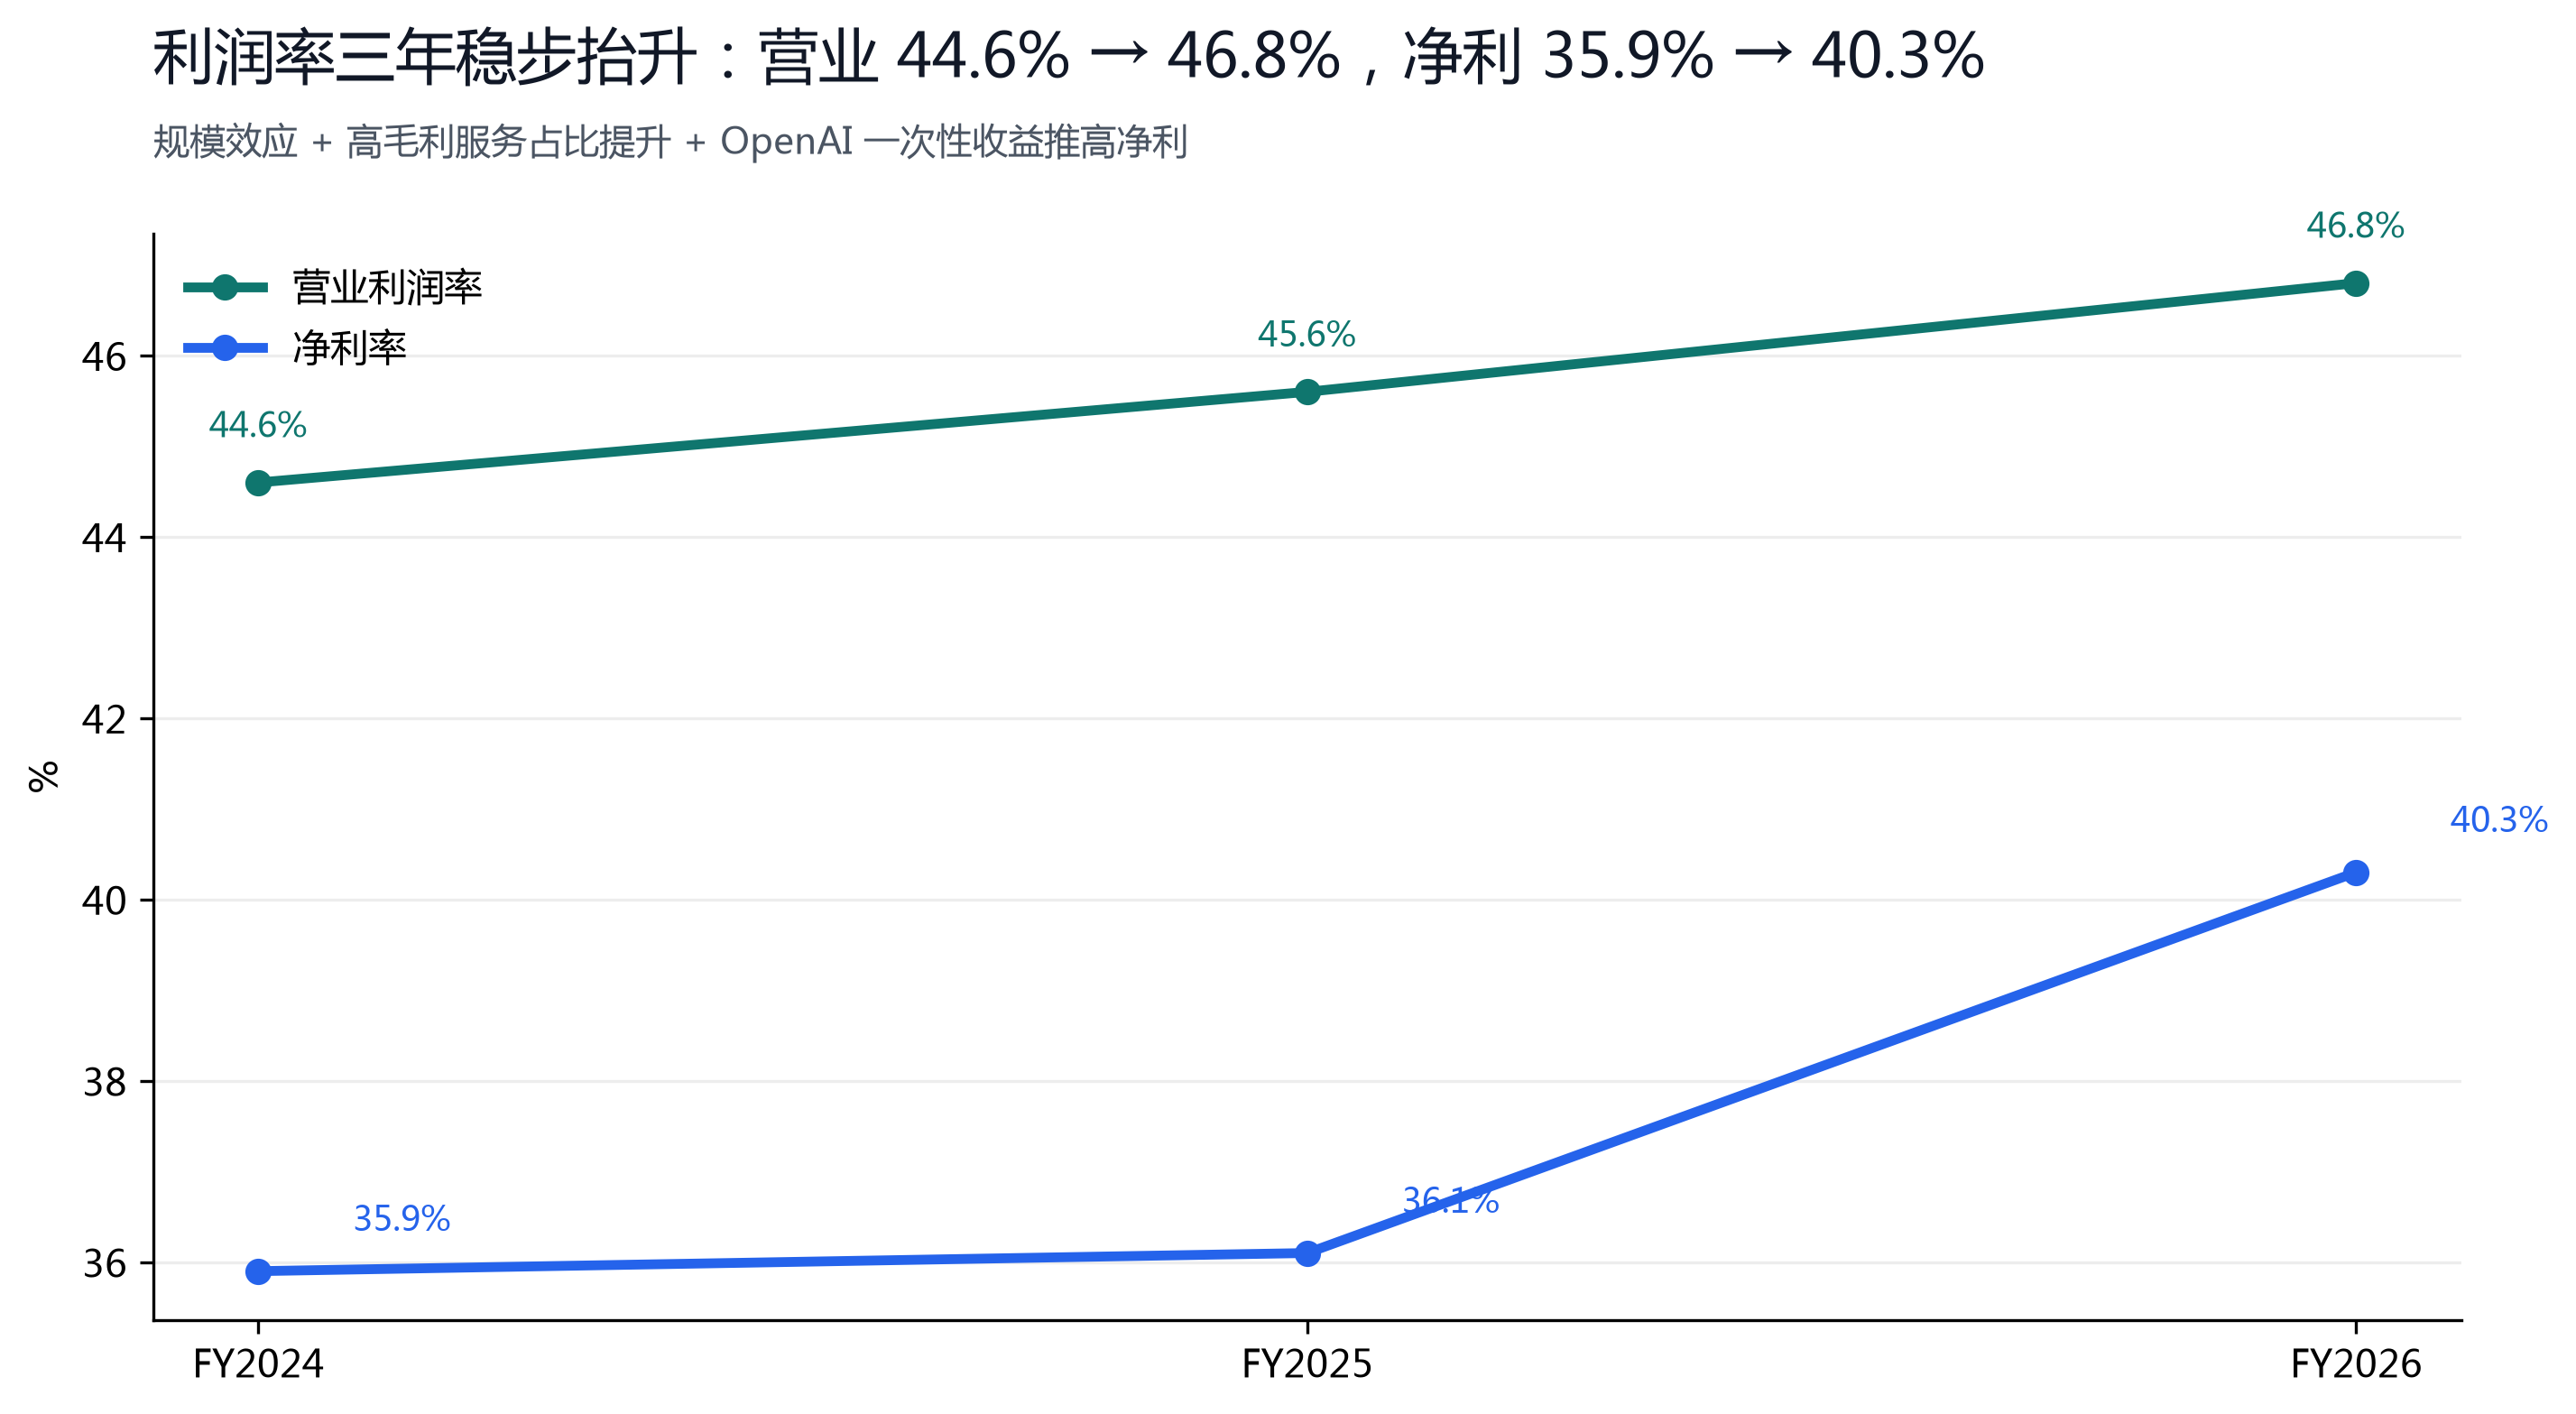
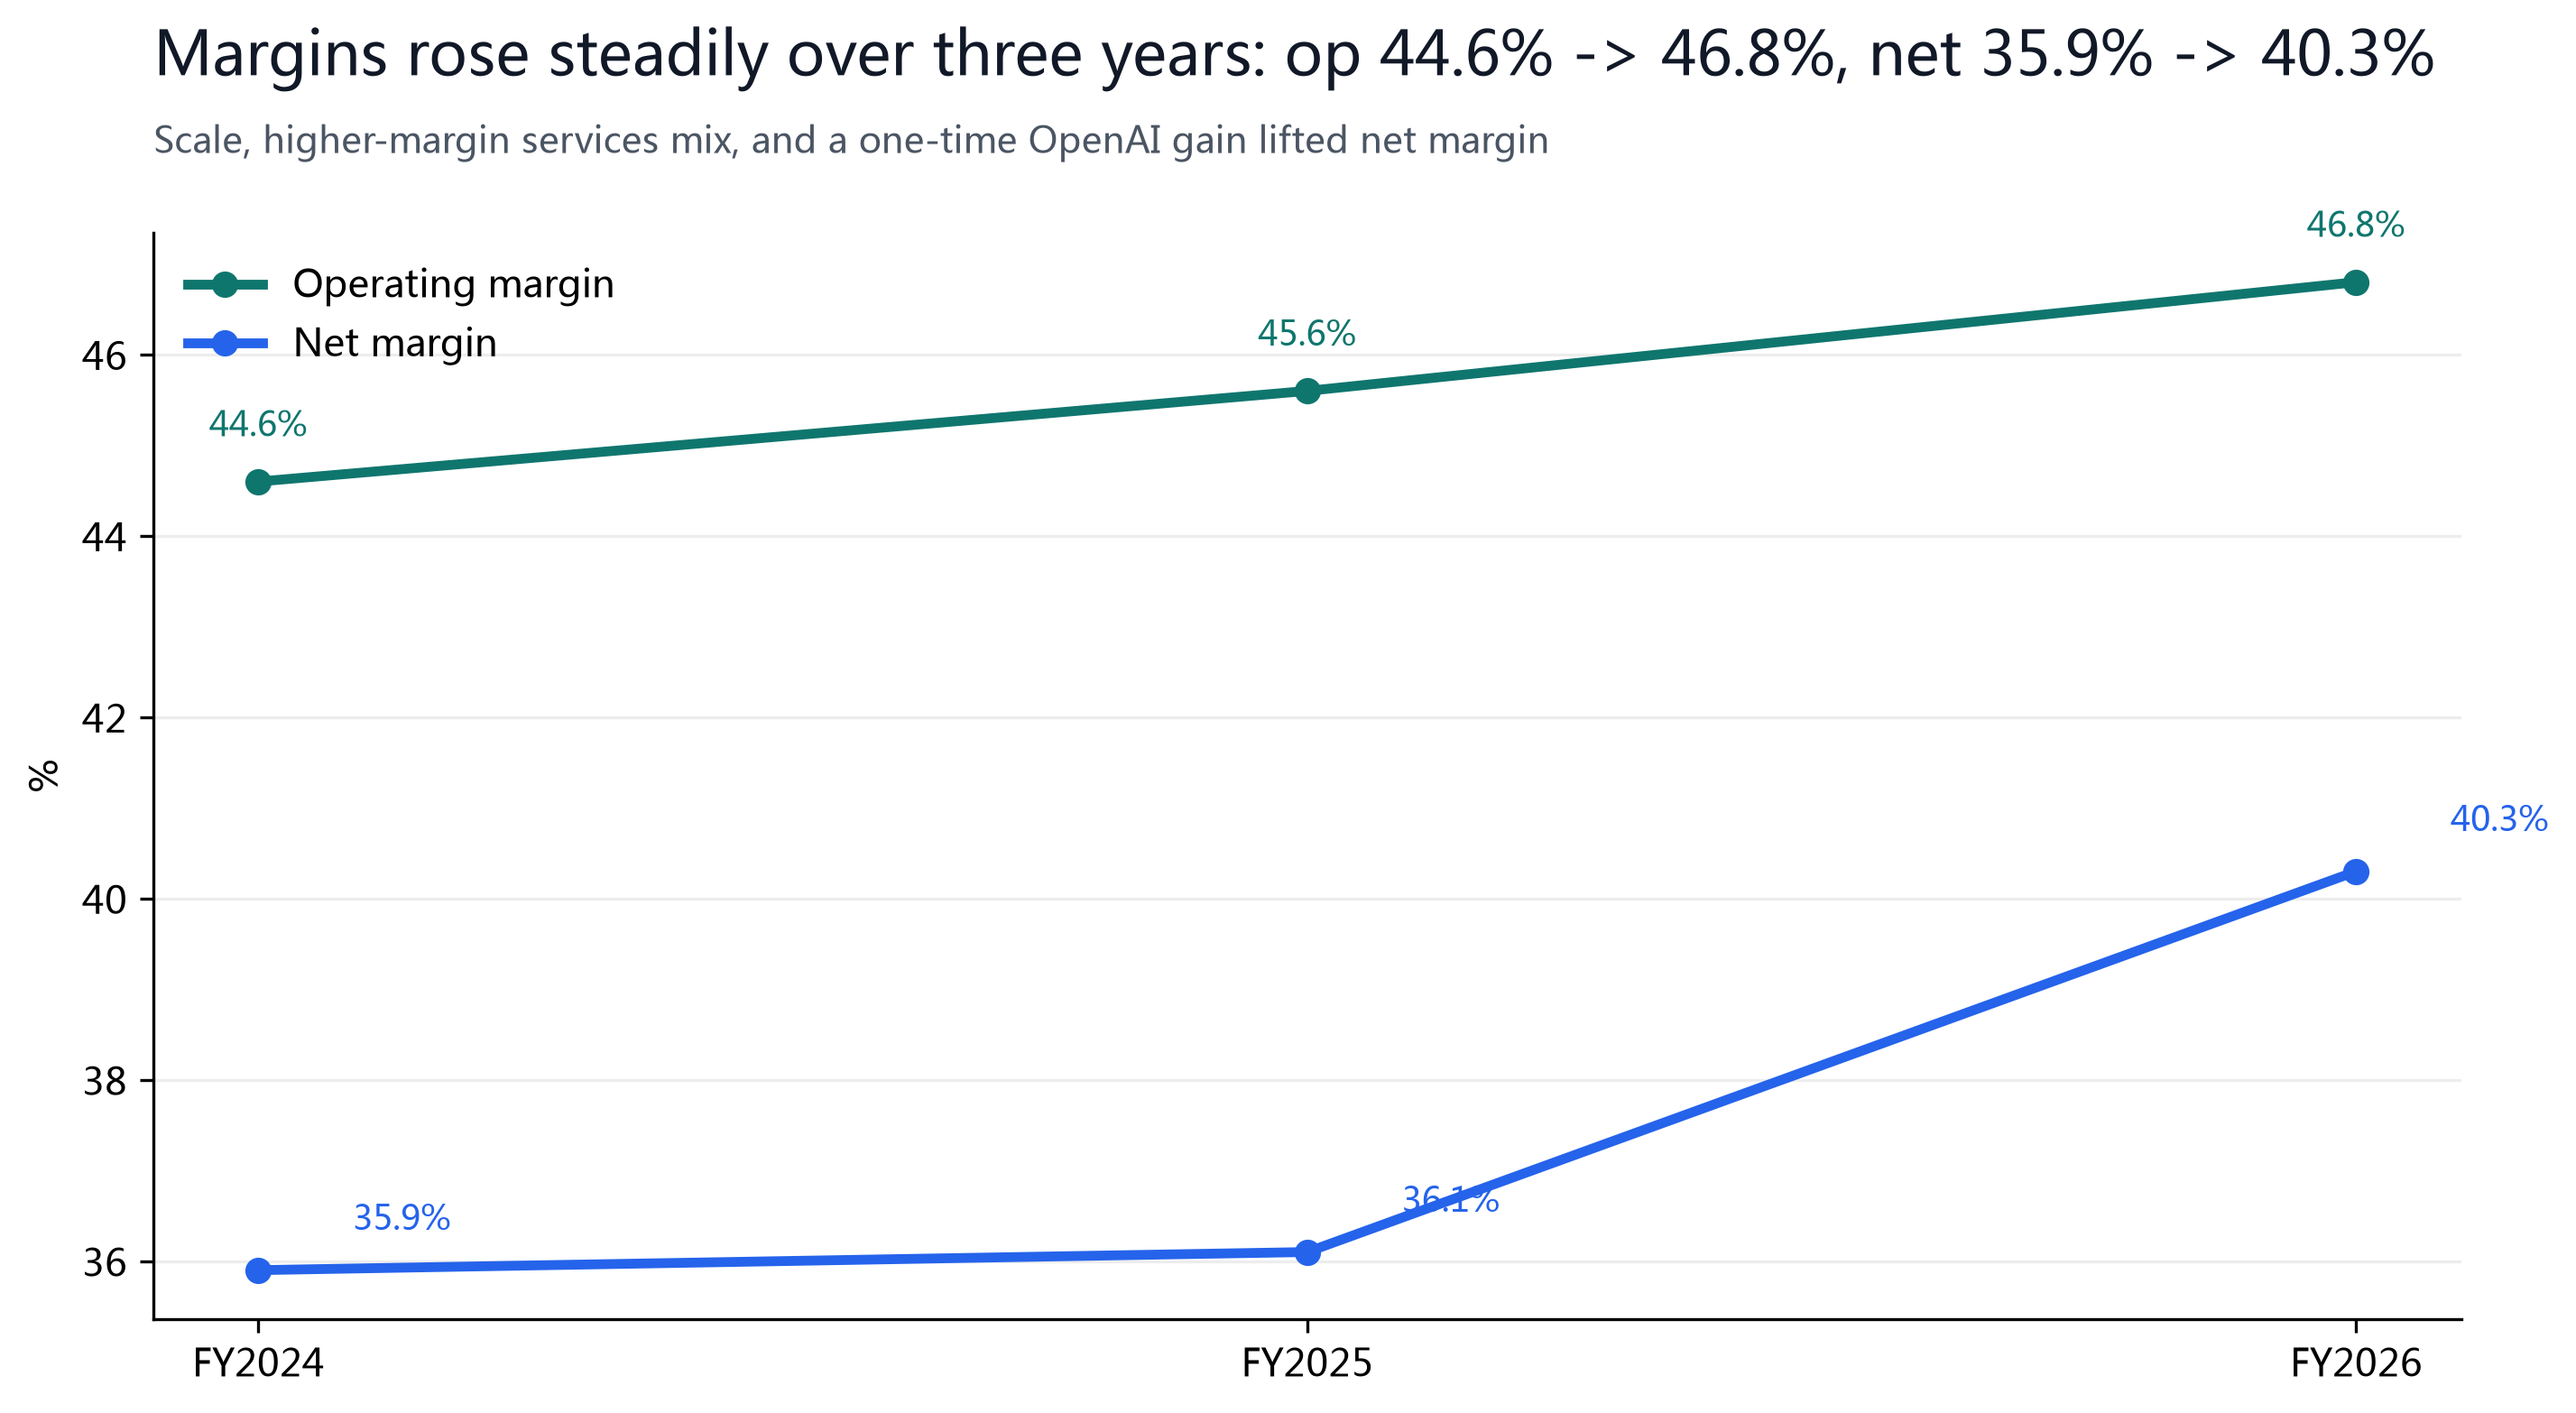
Four reasons to buy: Microsoft Cloud revenue of $214.4B (+27%) and a record cRPO of $678B (+84%) with Azure reaccelerating to +41%; operating margin rising three years running (44.6%->46.8%); service revenue up 48% over three years to $267.1B, steadily lightening and thickening the mix; and the company still buying back shares at $16.7B a year.
Three main risks: AI-infra capex +79% pushed FY2026 free cash flow down 6.4% YoY; the More Personal Computing segment fell -1% and has become a drag; and 22.8x forward is no longer cheap for a decelerating blue chip — the reason we lowered conviction to Low.
§02Price and Street View
| Metric | Value | Source / Note |
|---|---|---|
| Current price | $444.00 | Realtime quote · 2026-07-30 (user-provided) |
| Market cap | $3.31T | 444.00 x 7,453M shares (10-K) |
| 52W range | $349.20-$555.45 | MarketWatch / finviz |
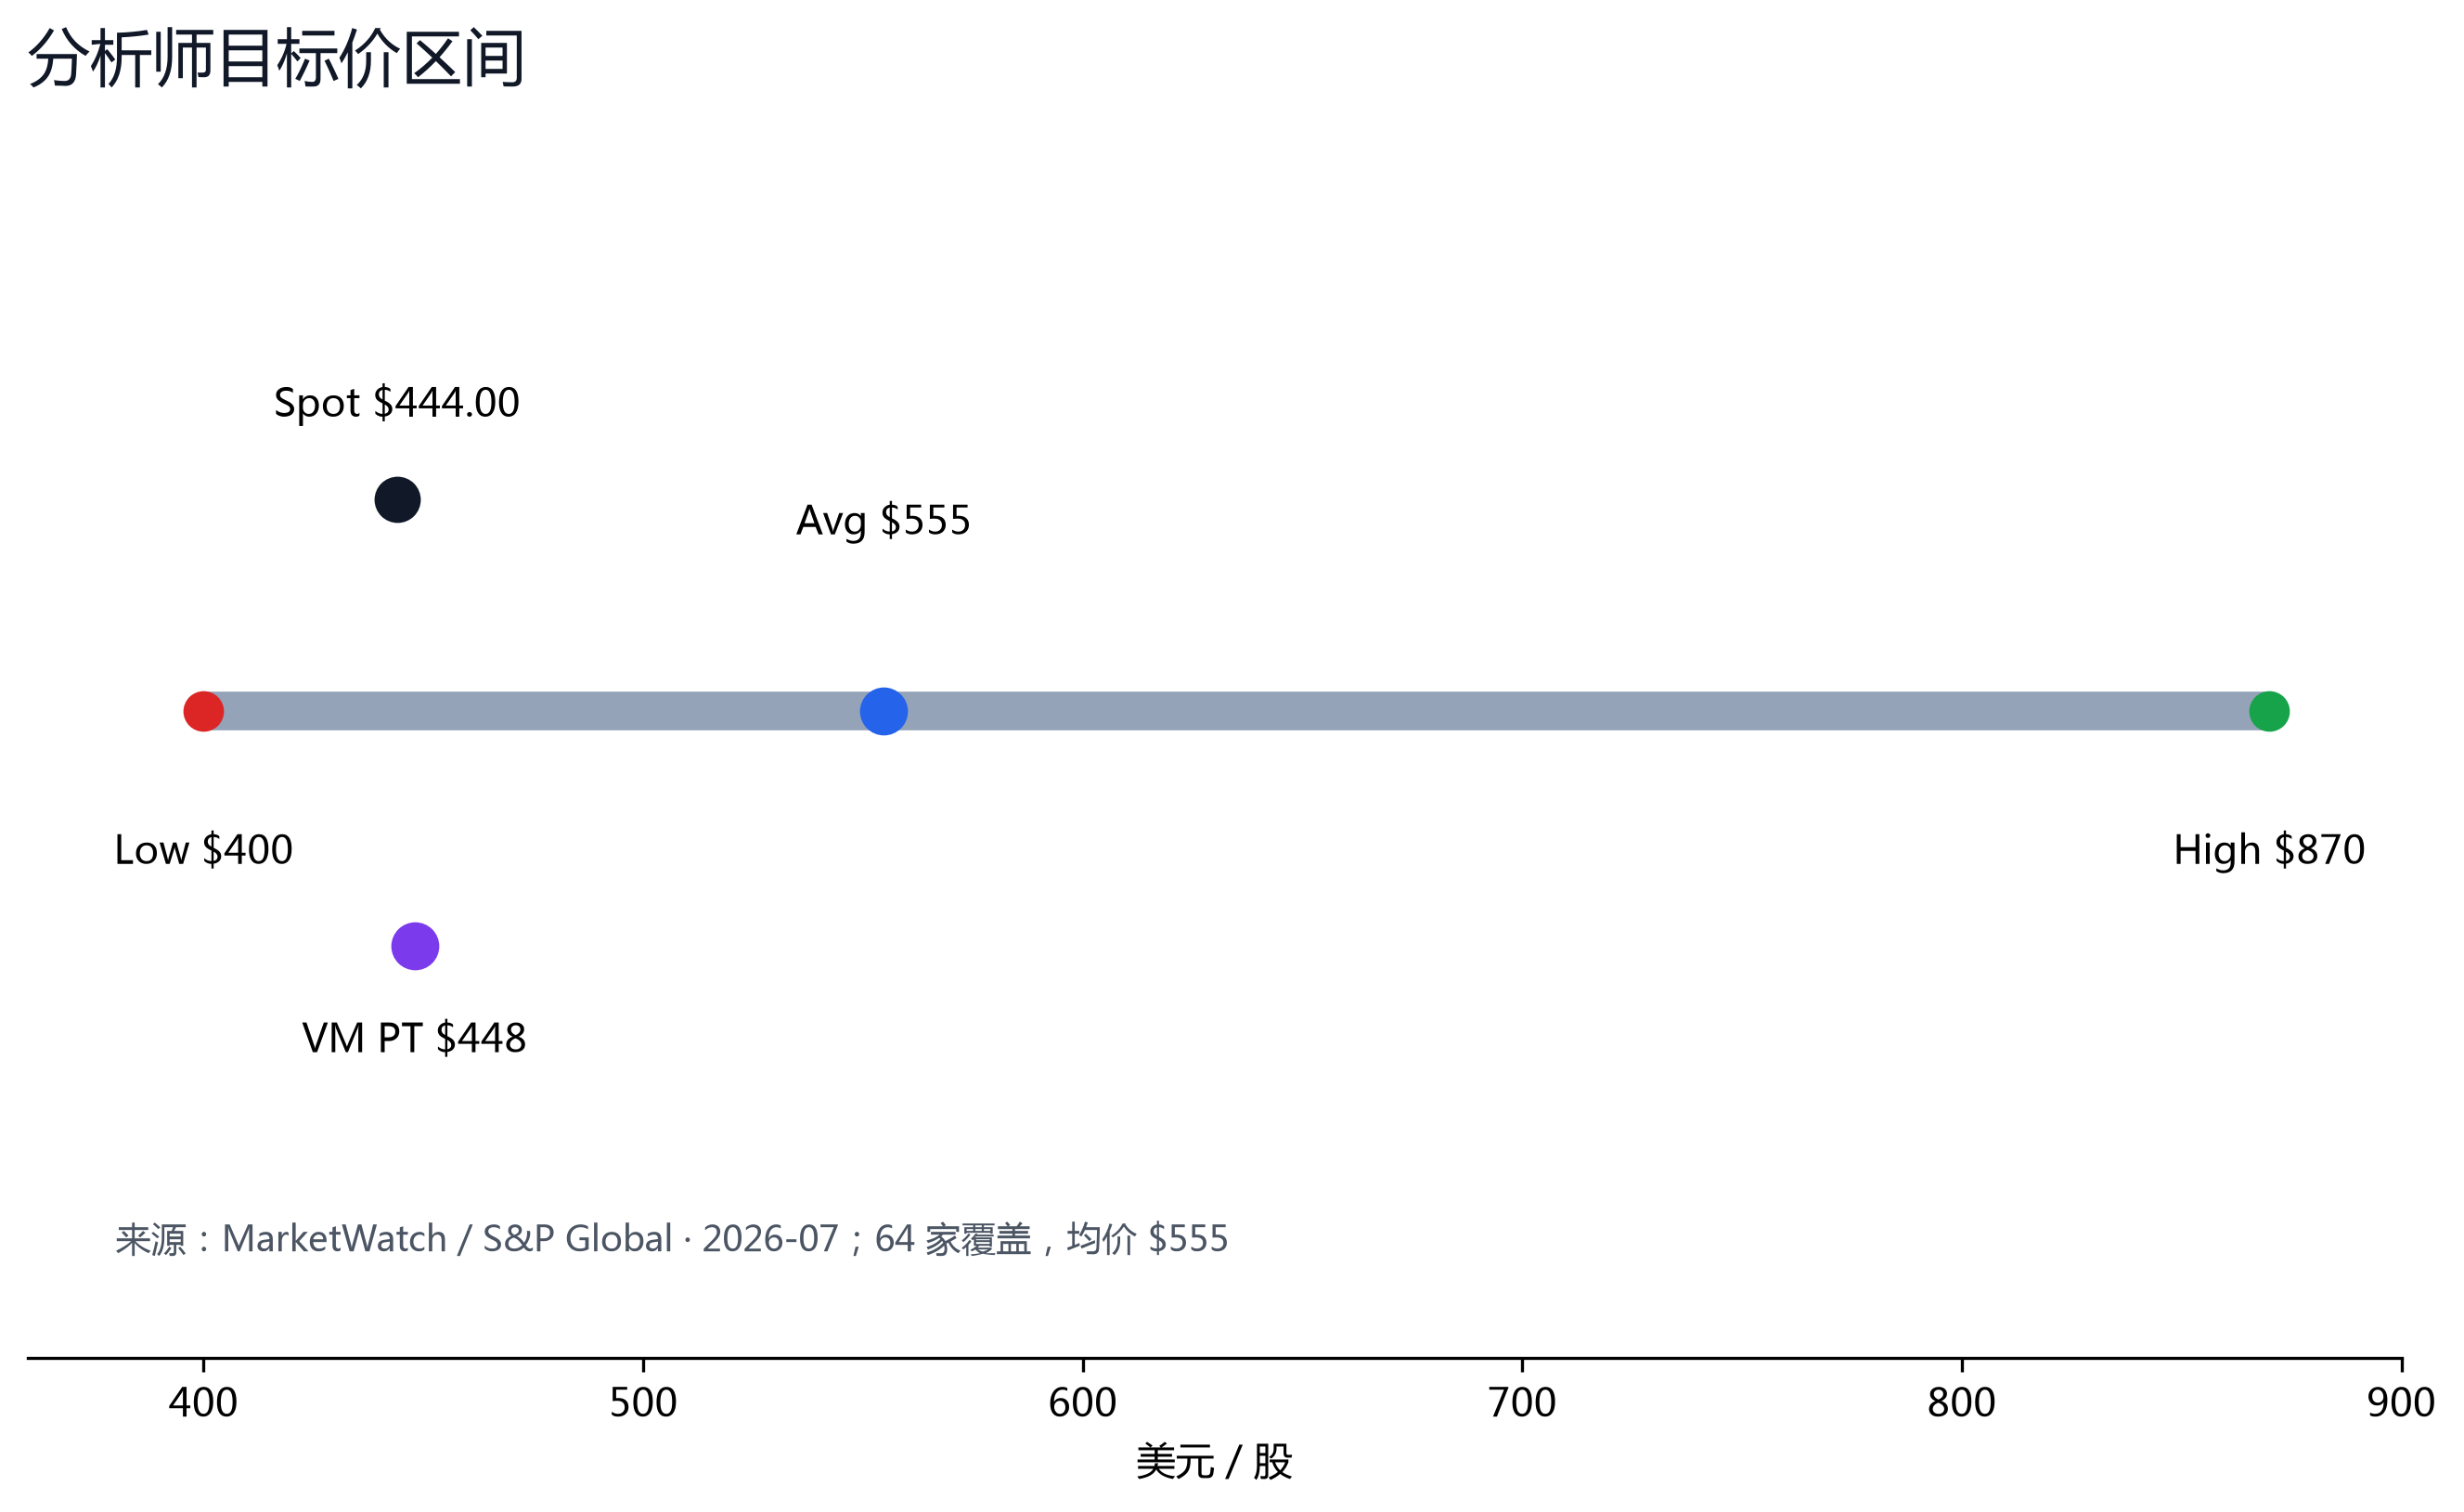
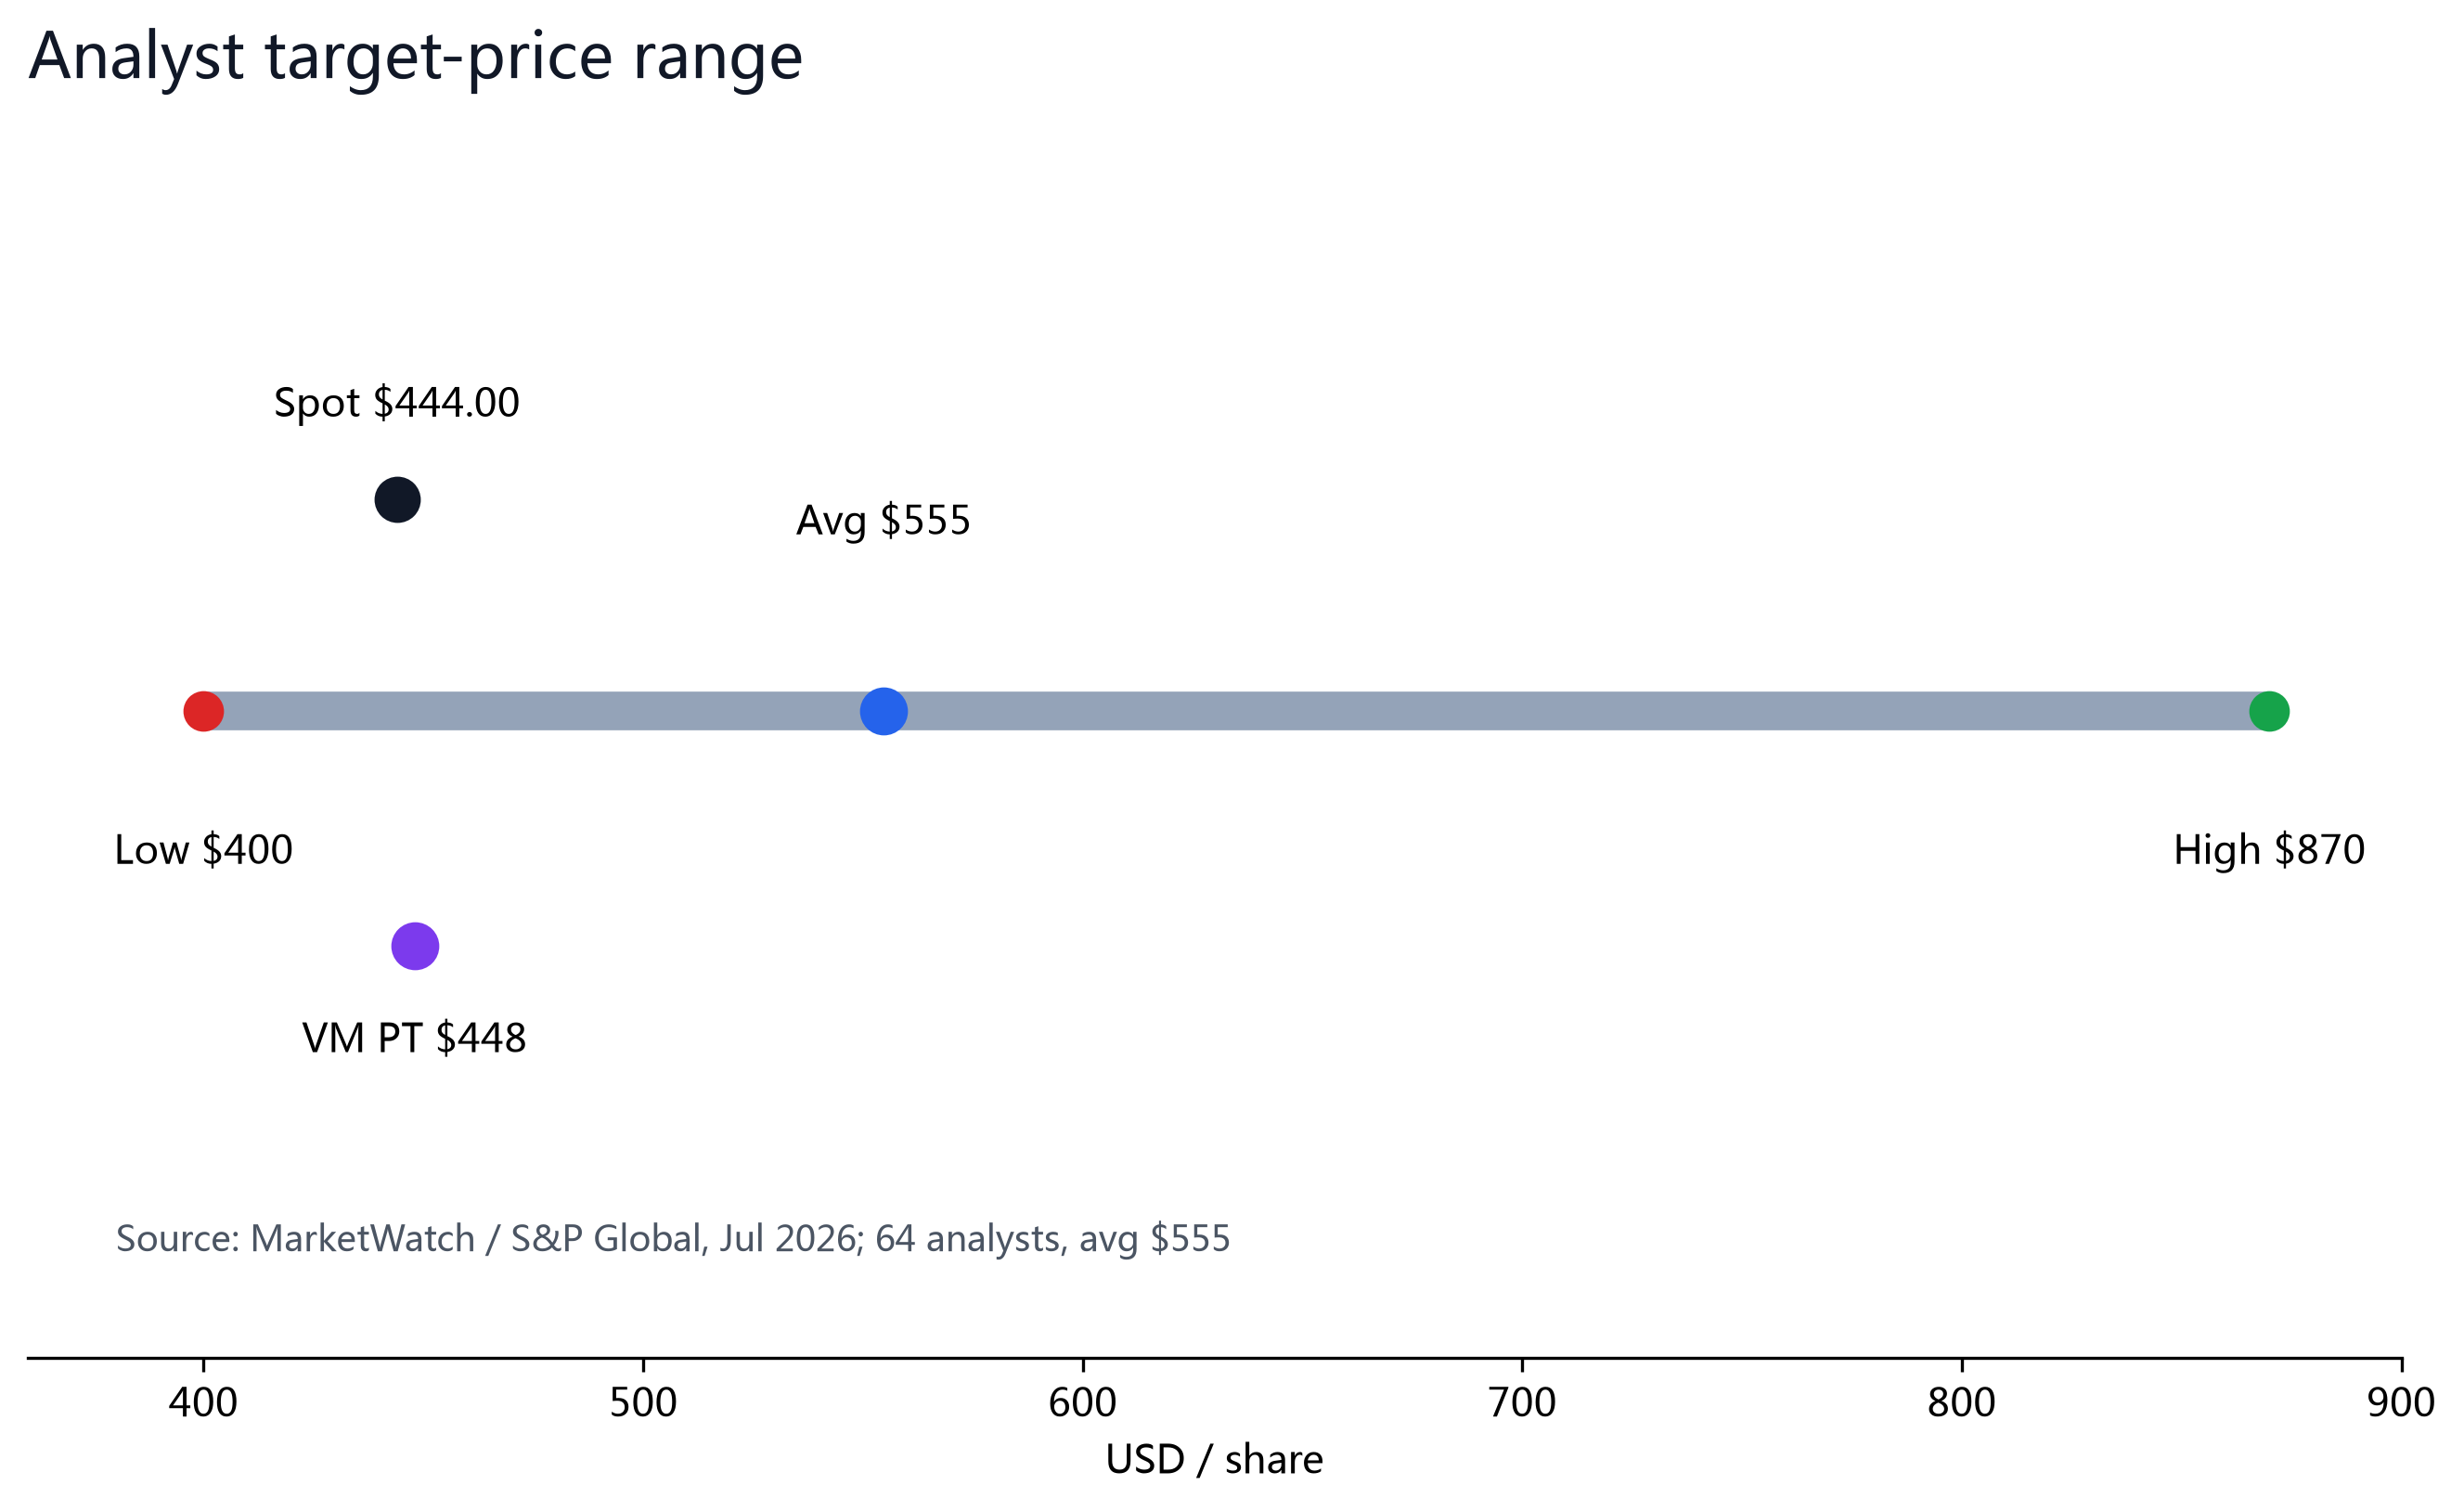
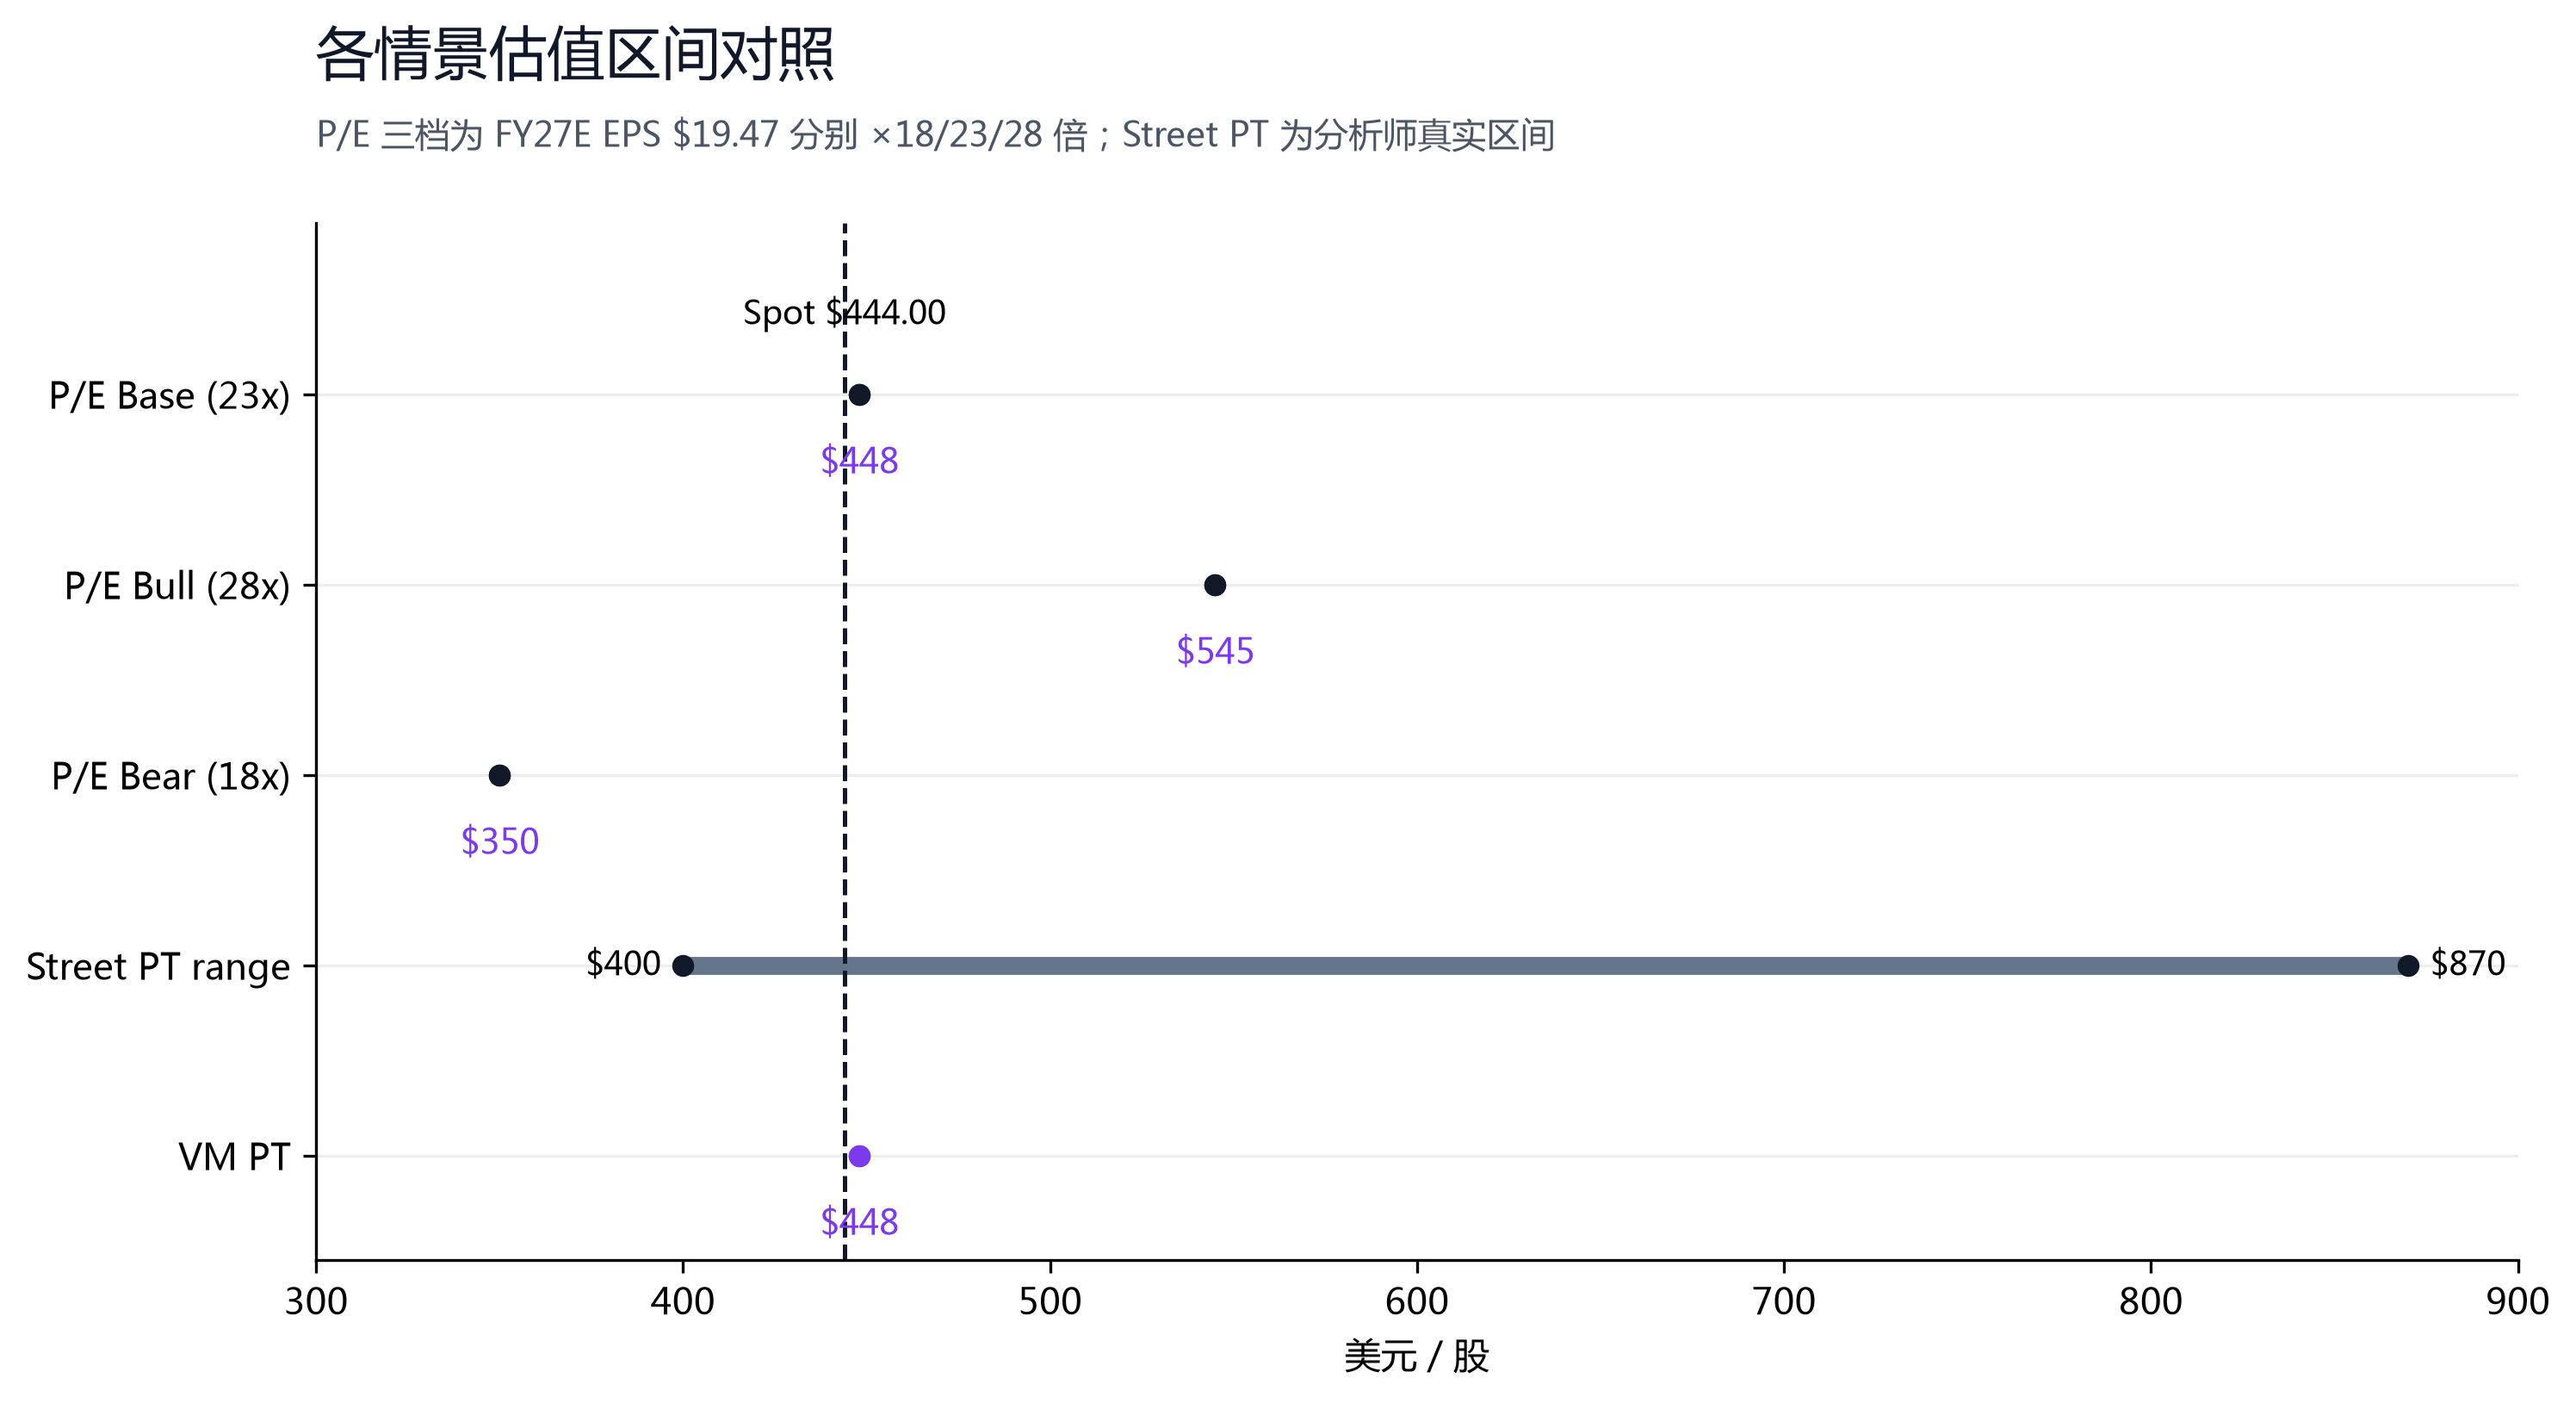
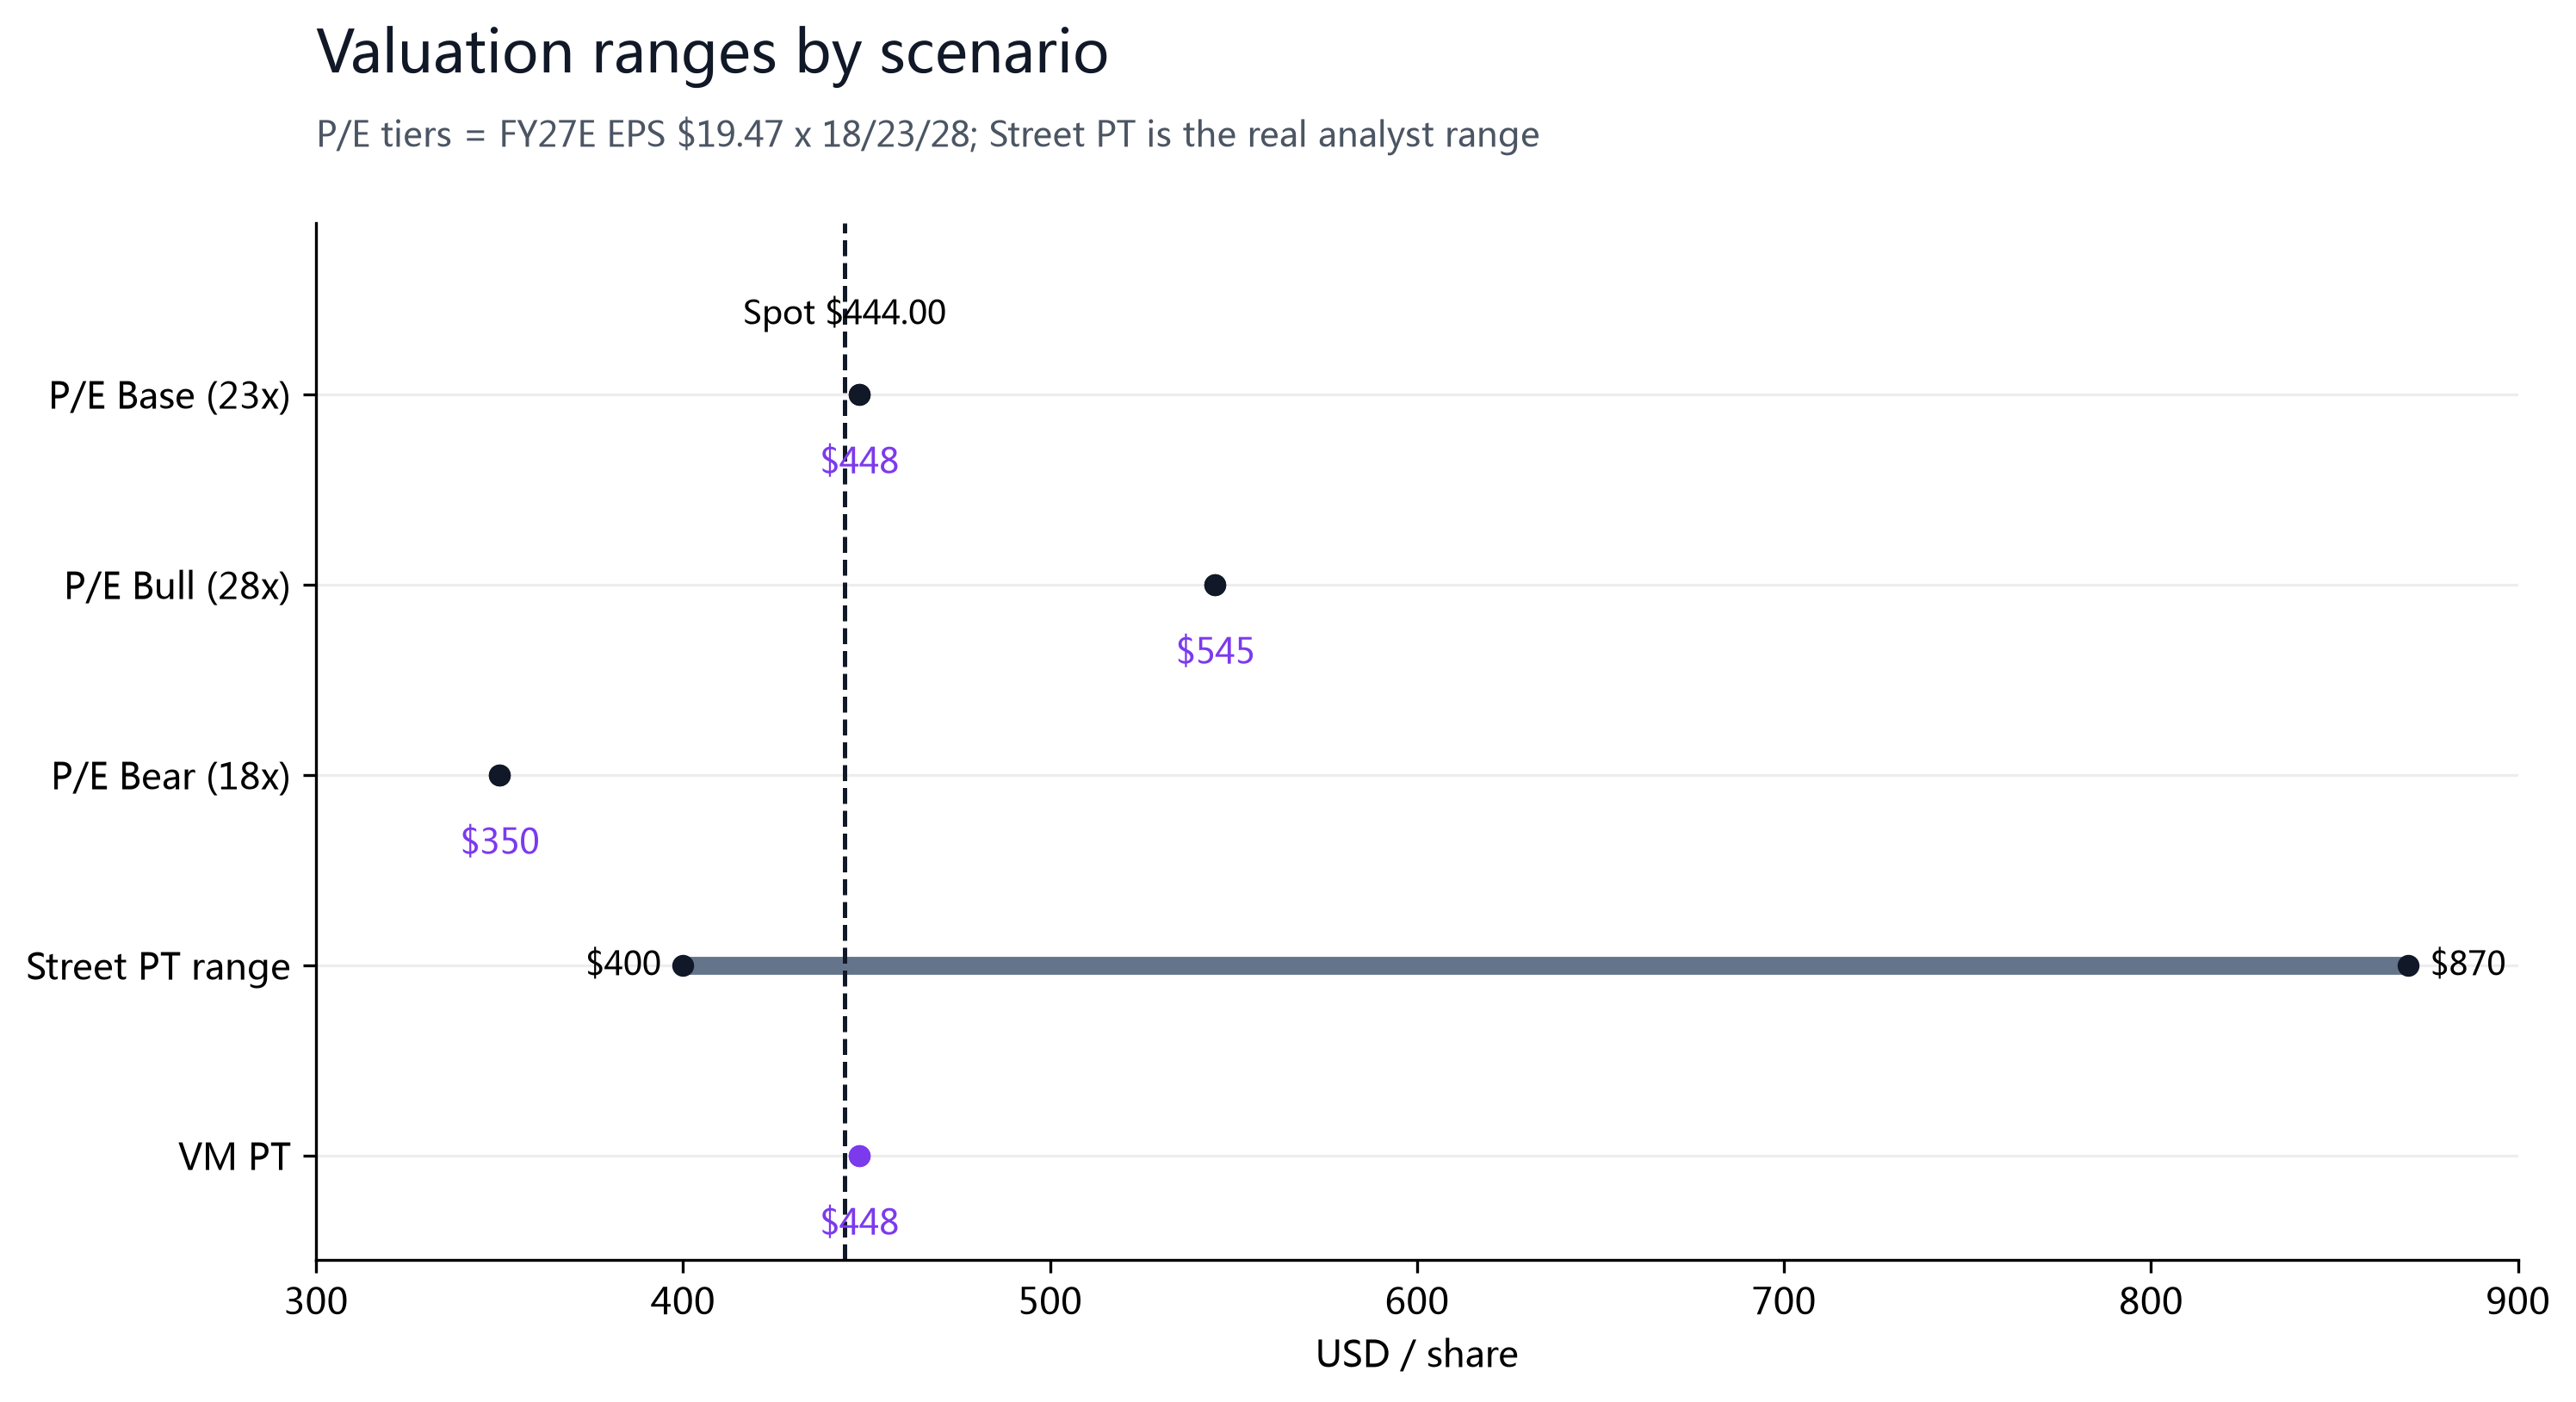
| Analyst PT | $400 / $554.77 / $870 | Low / Avg / High · MarketWatch / S&P Global |
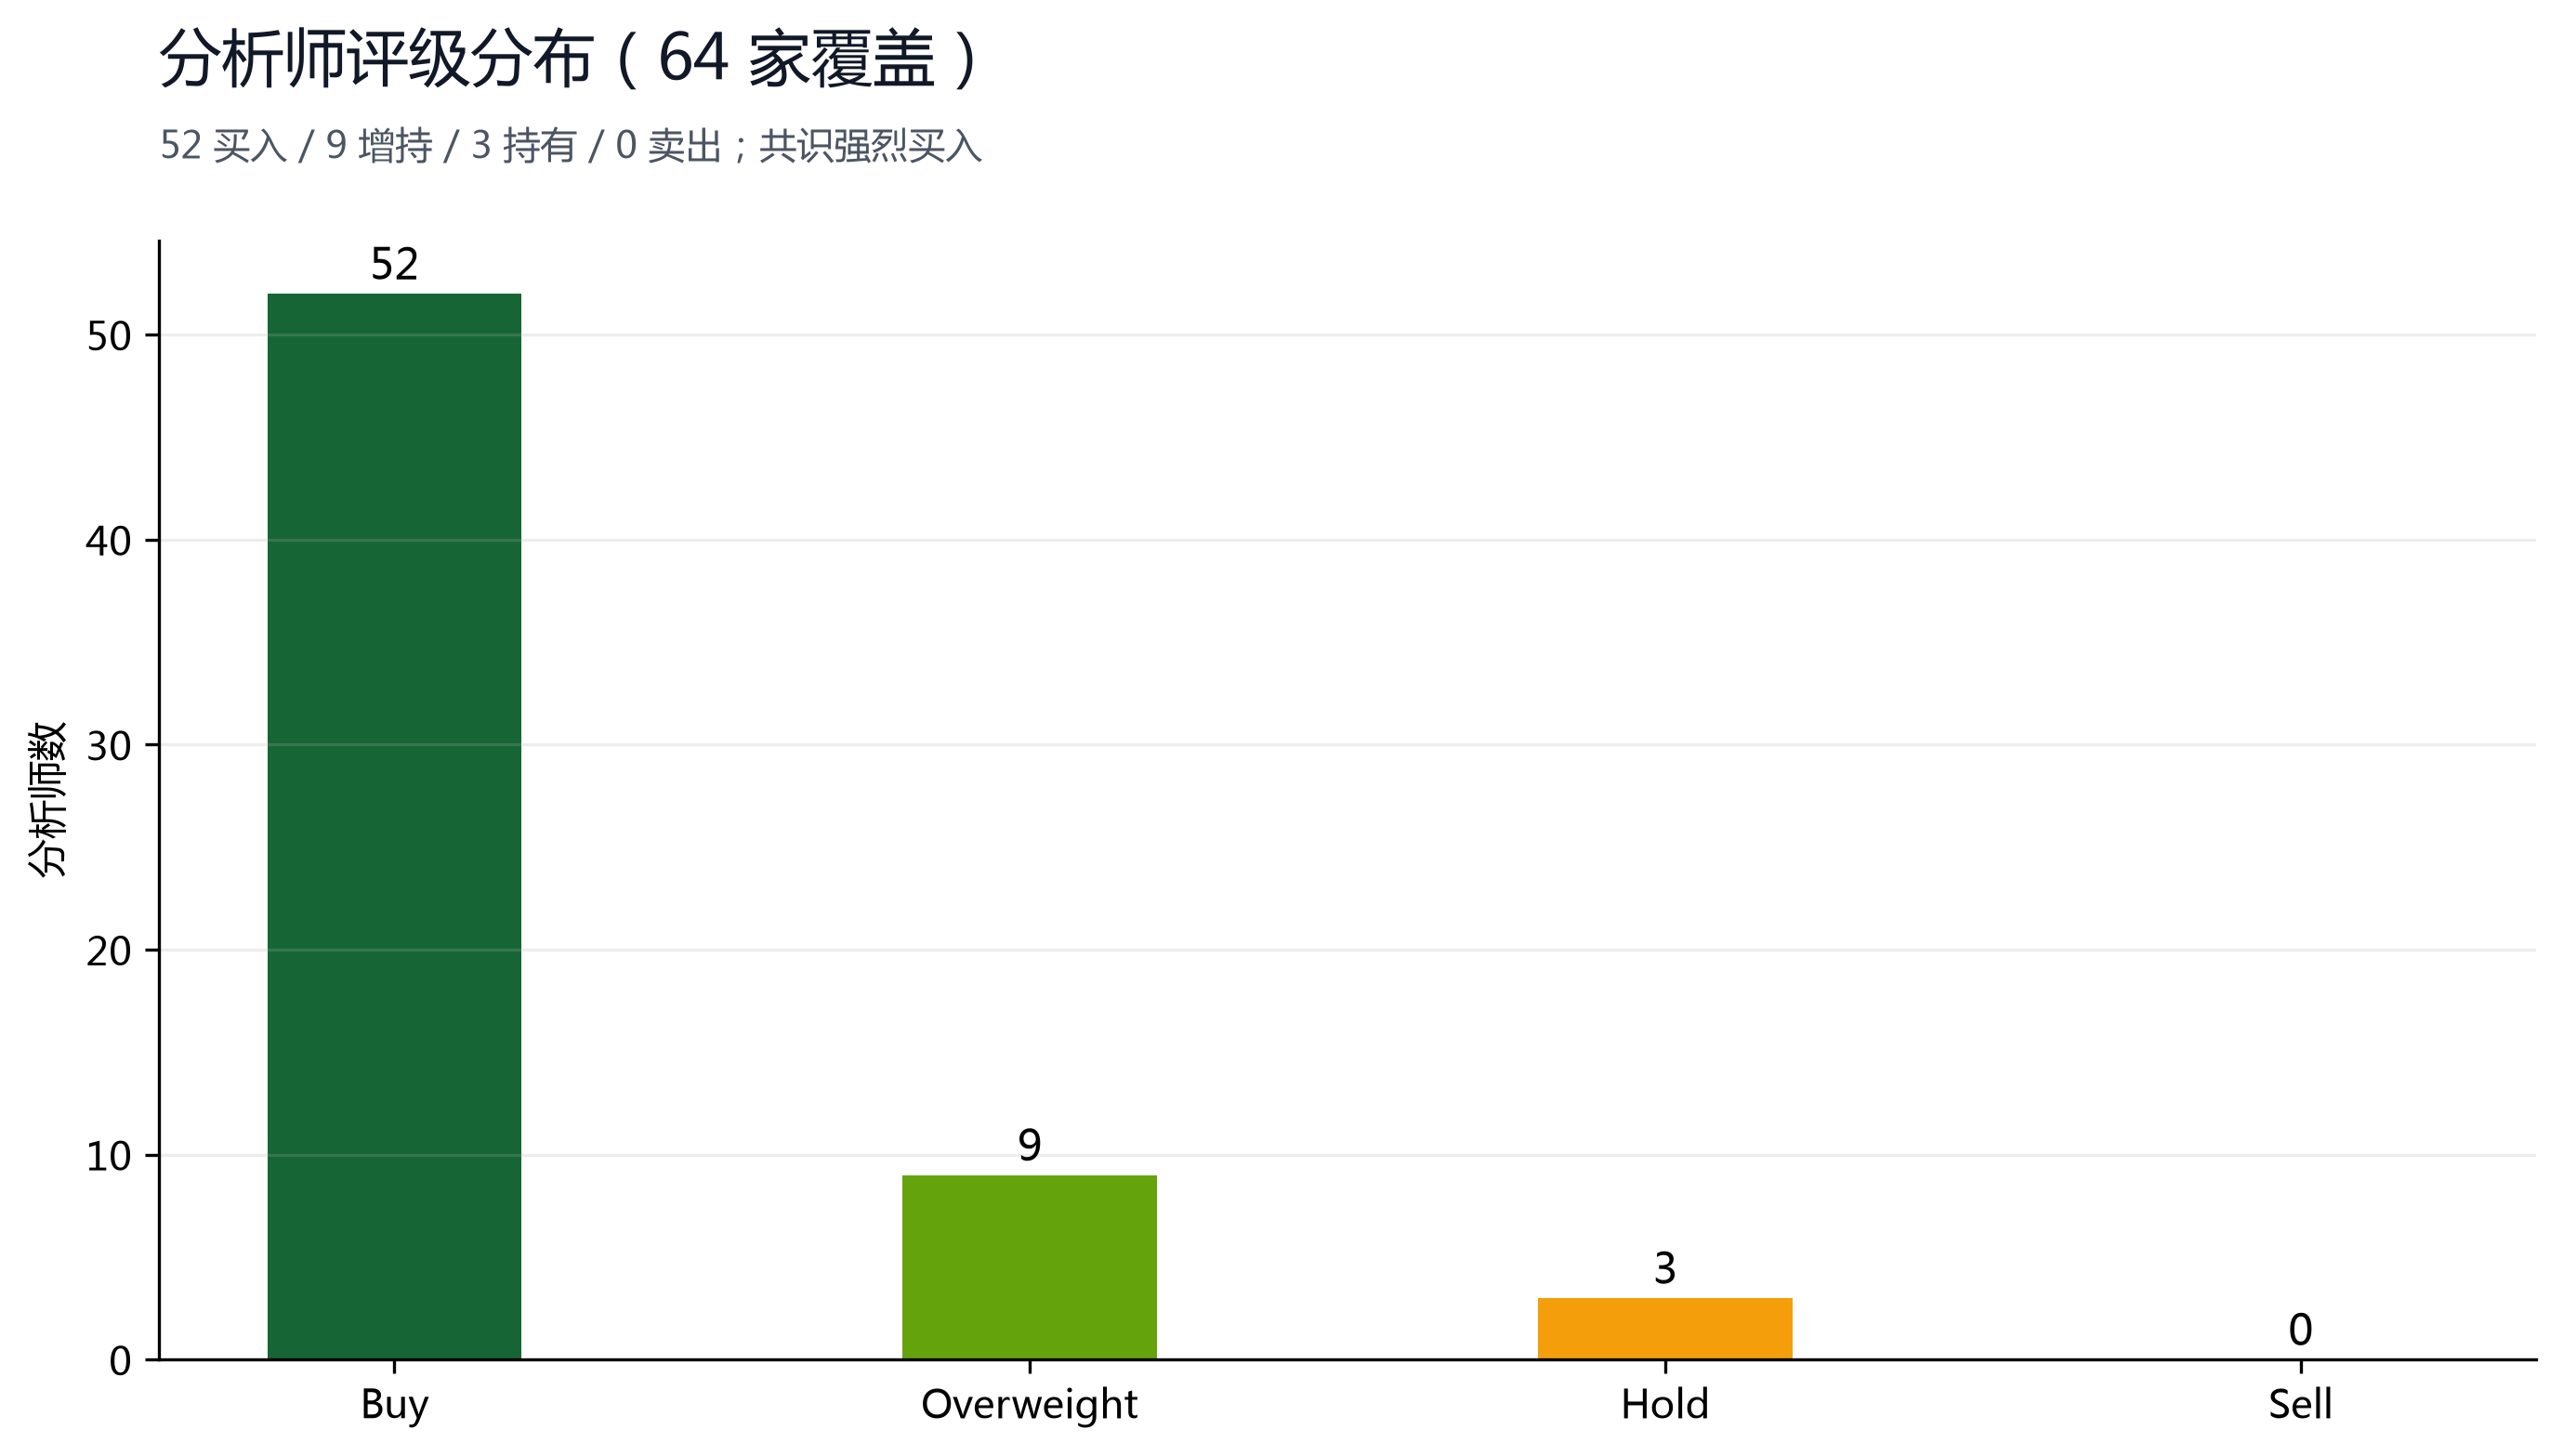
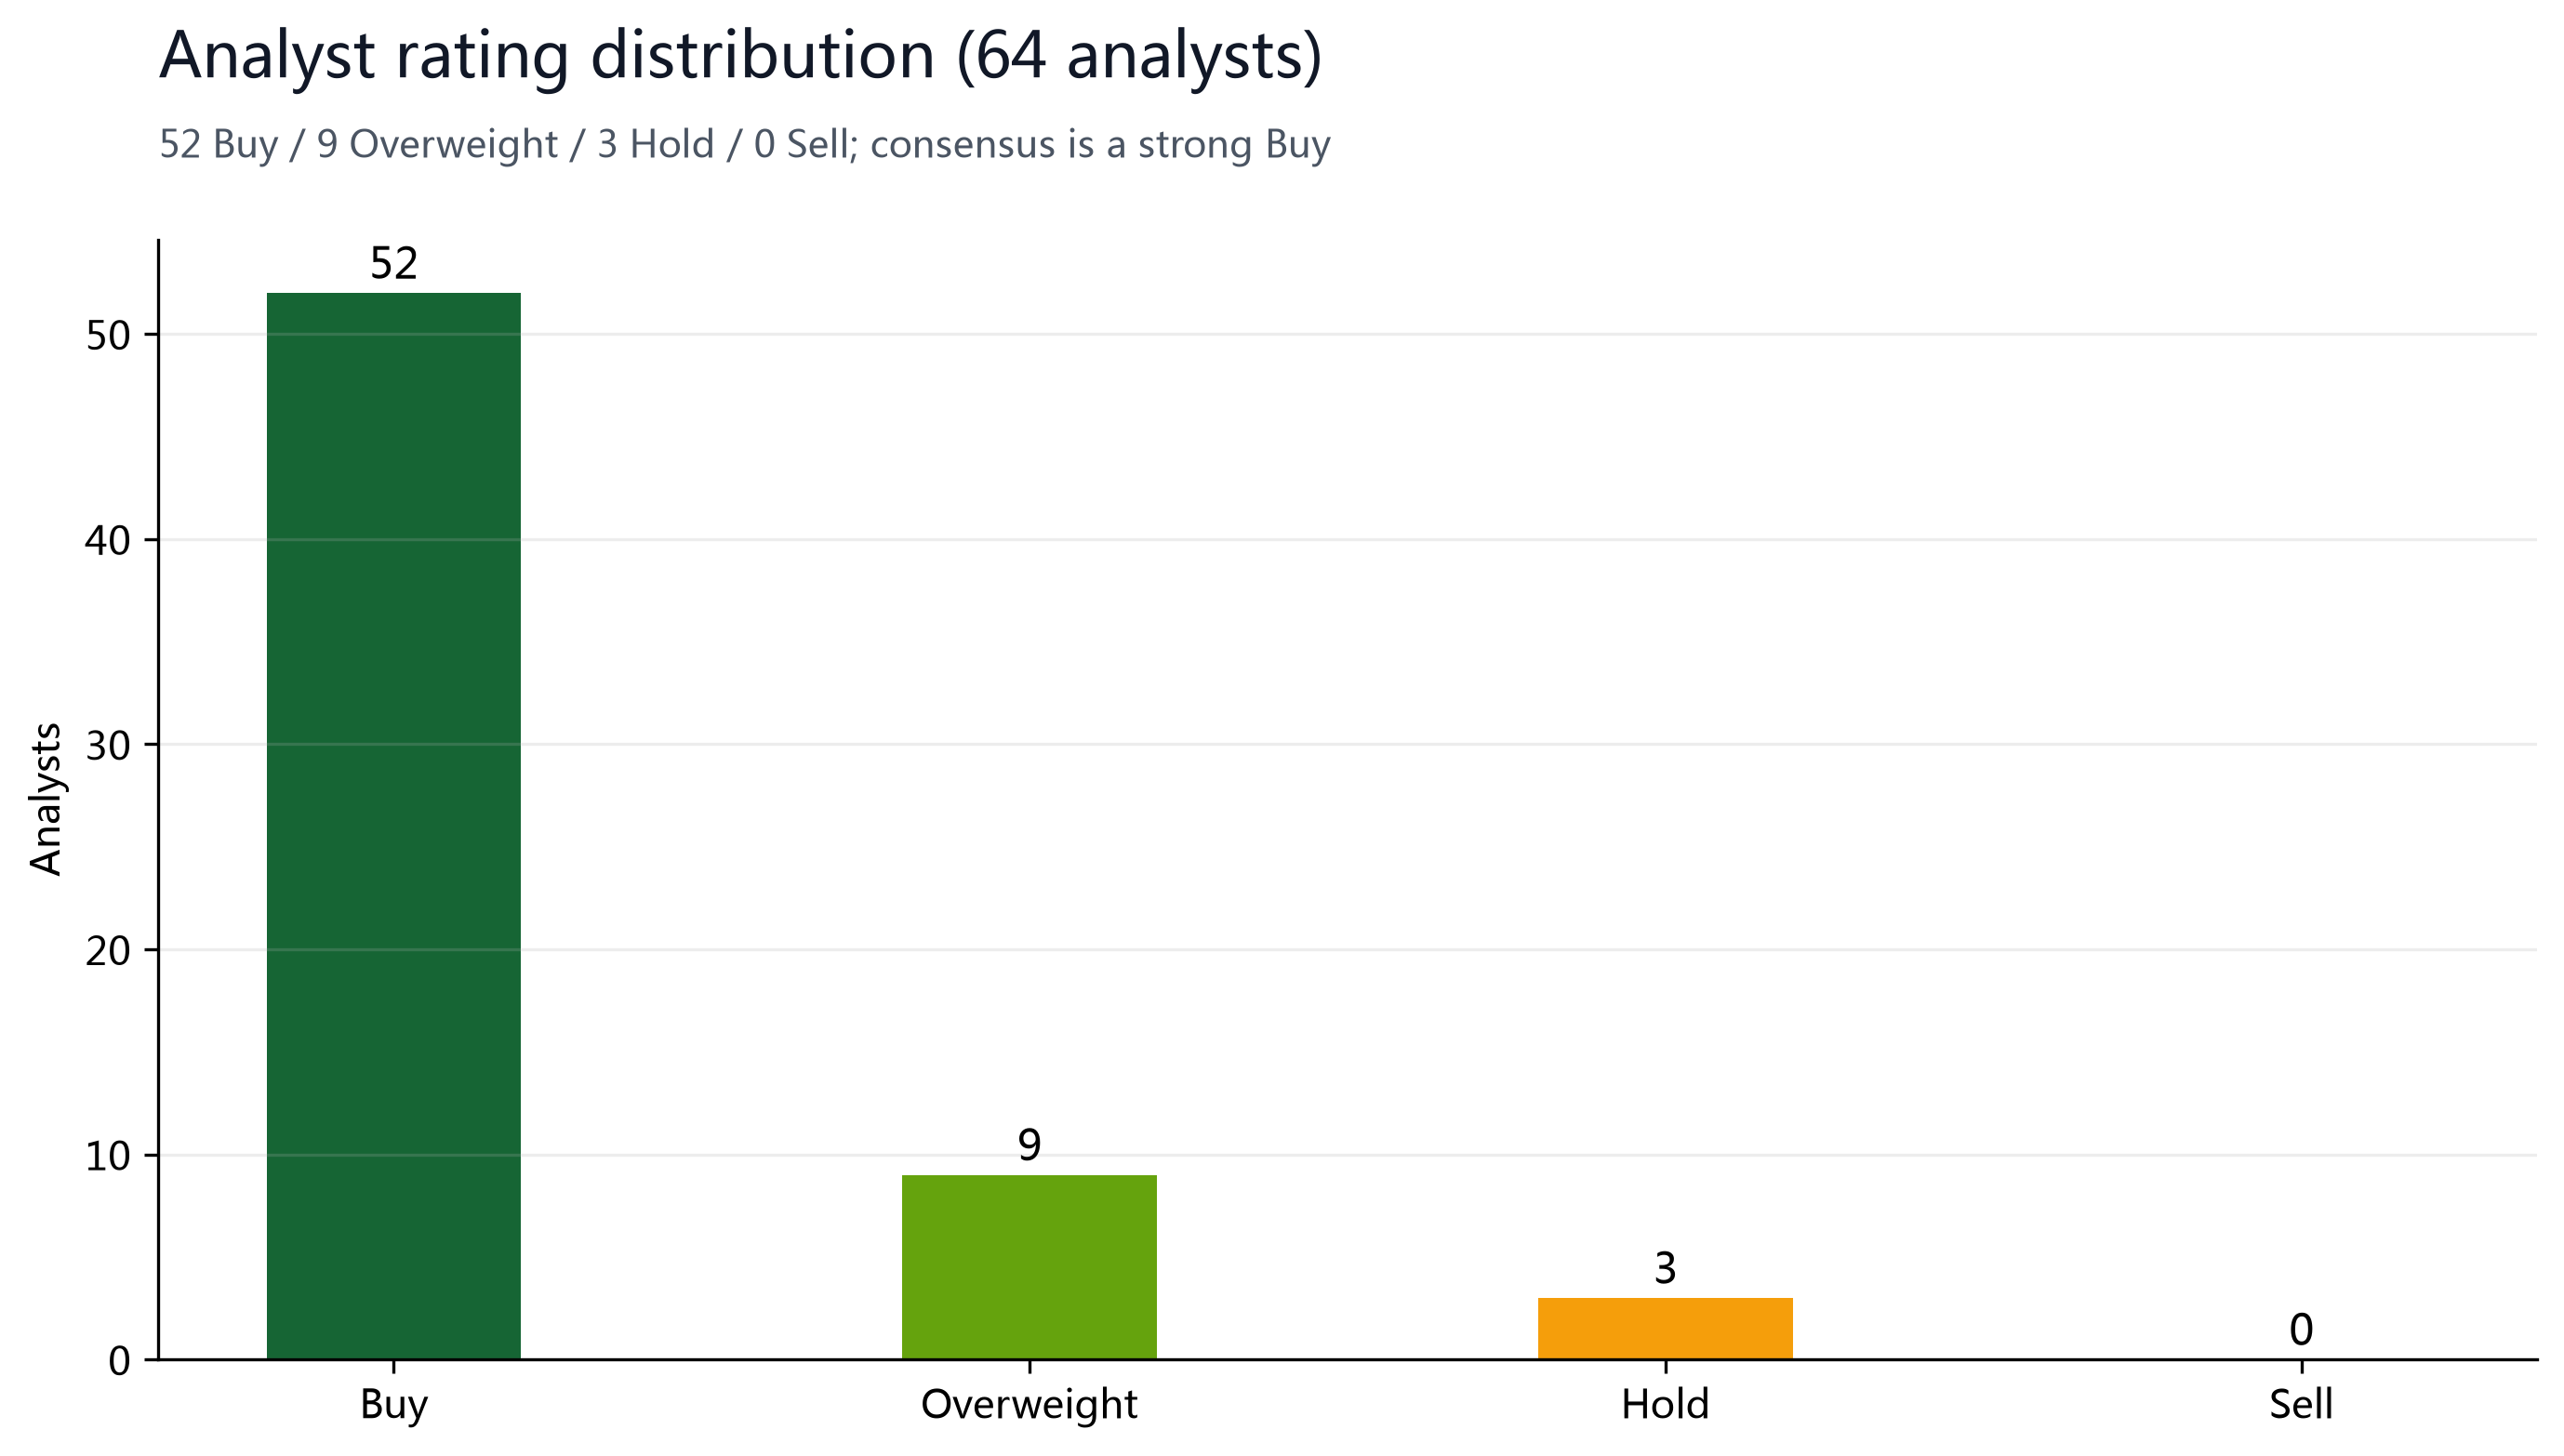
| Recommendation split | 52 / 9 / 3 / 0 | Buy / Overweight / Hold / Sell · 64 analysts |
| Post-earnings reaction | -0.71% | 10-K filed 2026-07-29; close $390.54 vs prior $393.35 |
| Beta / RSI(14) / Short % | 1.13 / 50.1 / 1.22% | MarketWatch / finviz / tradingkey |
§03Bull/Bear View
Bull: cloud-and-AI twin engines, a net-cash balance sheet, and buyback-driven shrink
Microsoft Cloud revenue of $214.4B (+27%) and a record cRPO of $678B (+84%), with Azure reaccelerating to +41%, is among the highest-conviction hyperscale-cloud growth stories today; Office 365 and LinkedIn form a sticky, high-margin services base, and service revenue rose 48% over three years to $267.1B, steadily lightening and thickening the mix. The balance sheet carries net cash of $36.5B and a remaining $40.6B buyback authorization still shrinking the count at a low price; the OpenAI stake (contributing +$5.0B net income in FY2026) adds optionality.
Bear: AI capex eats free cash flow, segment divergence, and the multiple is not cheap
Capex rose 79% YoY to $115.9B, pushing FY2026 free cash flow down 6.4% to $67.0B — a real fundamental cost, not an accounting artifact; the market worries about the medium-term return and utilization of the AI build-out. The More Personal Computing segment fell -1% in revenue and grew operating profit only 2%, becoming a drag on the group. At about 22.8x forward earnings, the margin of safety is thin for a blue chip whose revenue growth naturally decelerates from +18% and that faces antitrust and cloud-competition pressures. Also, FY2026 GAAP EPS of $17.95 includes a +$0.67 one-time OpenAI gain, so underlying earnings quality is slightly lower.
§04Financial Truth
FY2026 revenue was $331.8B (+18% YoY), operating income $155.2B (+20.8%), operating margin 46.8%, net income $133.7B (+31%), and diluted EPS $17.95 (+32%). Over three years, revenue rose from $245.1B in FY2024 to $331.8B, operating margin from 44.6% to 46.8%, and net income from $88.1B to $133.7B — earnings quality and scale improved together.
One valuation-critical one-time item deserves a separate note: FY2026 'other income, net' was +$10,697M, of which OpenAI contributed about +$5.0B in net income (roughly +$0.67 diluted EPS), versus -$4,901M in FY2025. It inflated FY2026 GAAP EPS, so we anchor valuation on the cleaner FY27E consensus EPS of $19.47 rather than the FY2026 GAAP figure.
| Metric | FY2024 | FY2025 | FY2026 |
|---|---|---|---|
| Revenue | $245.1B | $281.7B | $331.8B |
| Operating income | $109.4B | $128.5B | $155.2B |
| Operating margin | 44.6% | 45.6% | 46.8% |
| Net income | $88.1B | $101.8B | $133.7B |
| Diluted EPS | $11.80 | $13.64 | $17.95 |
| FY2026 Segment | Revenue | Op. Income | Op. Margin |
|---|---|---|---|
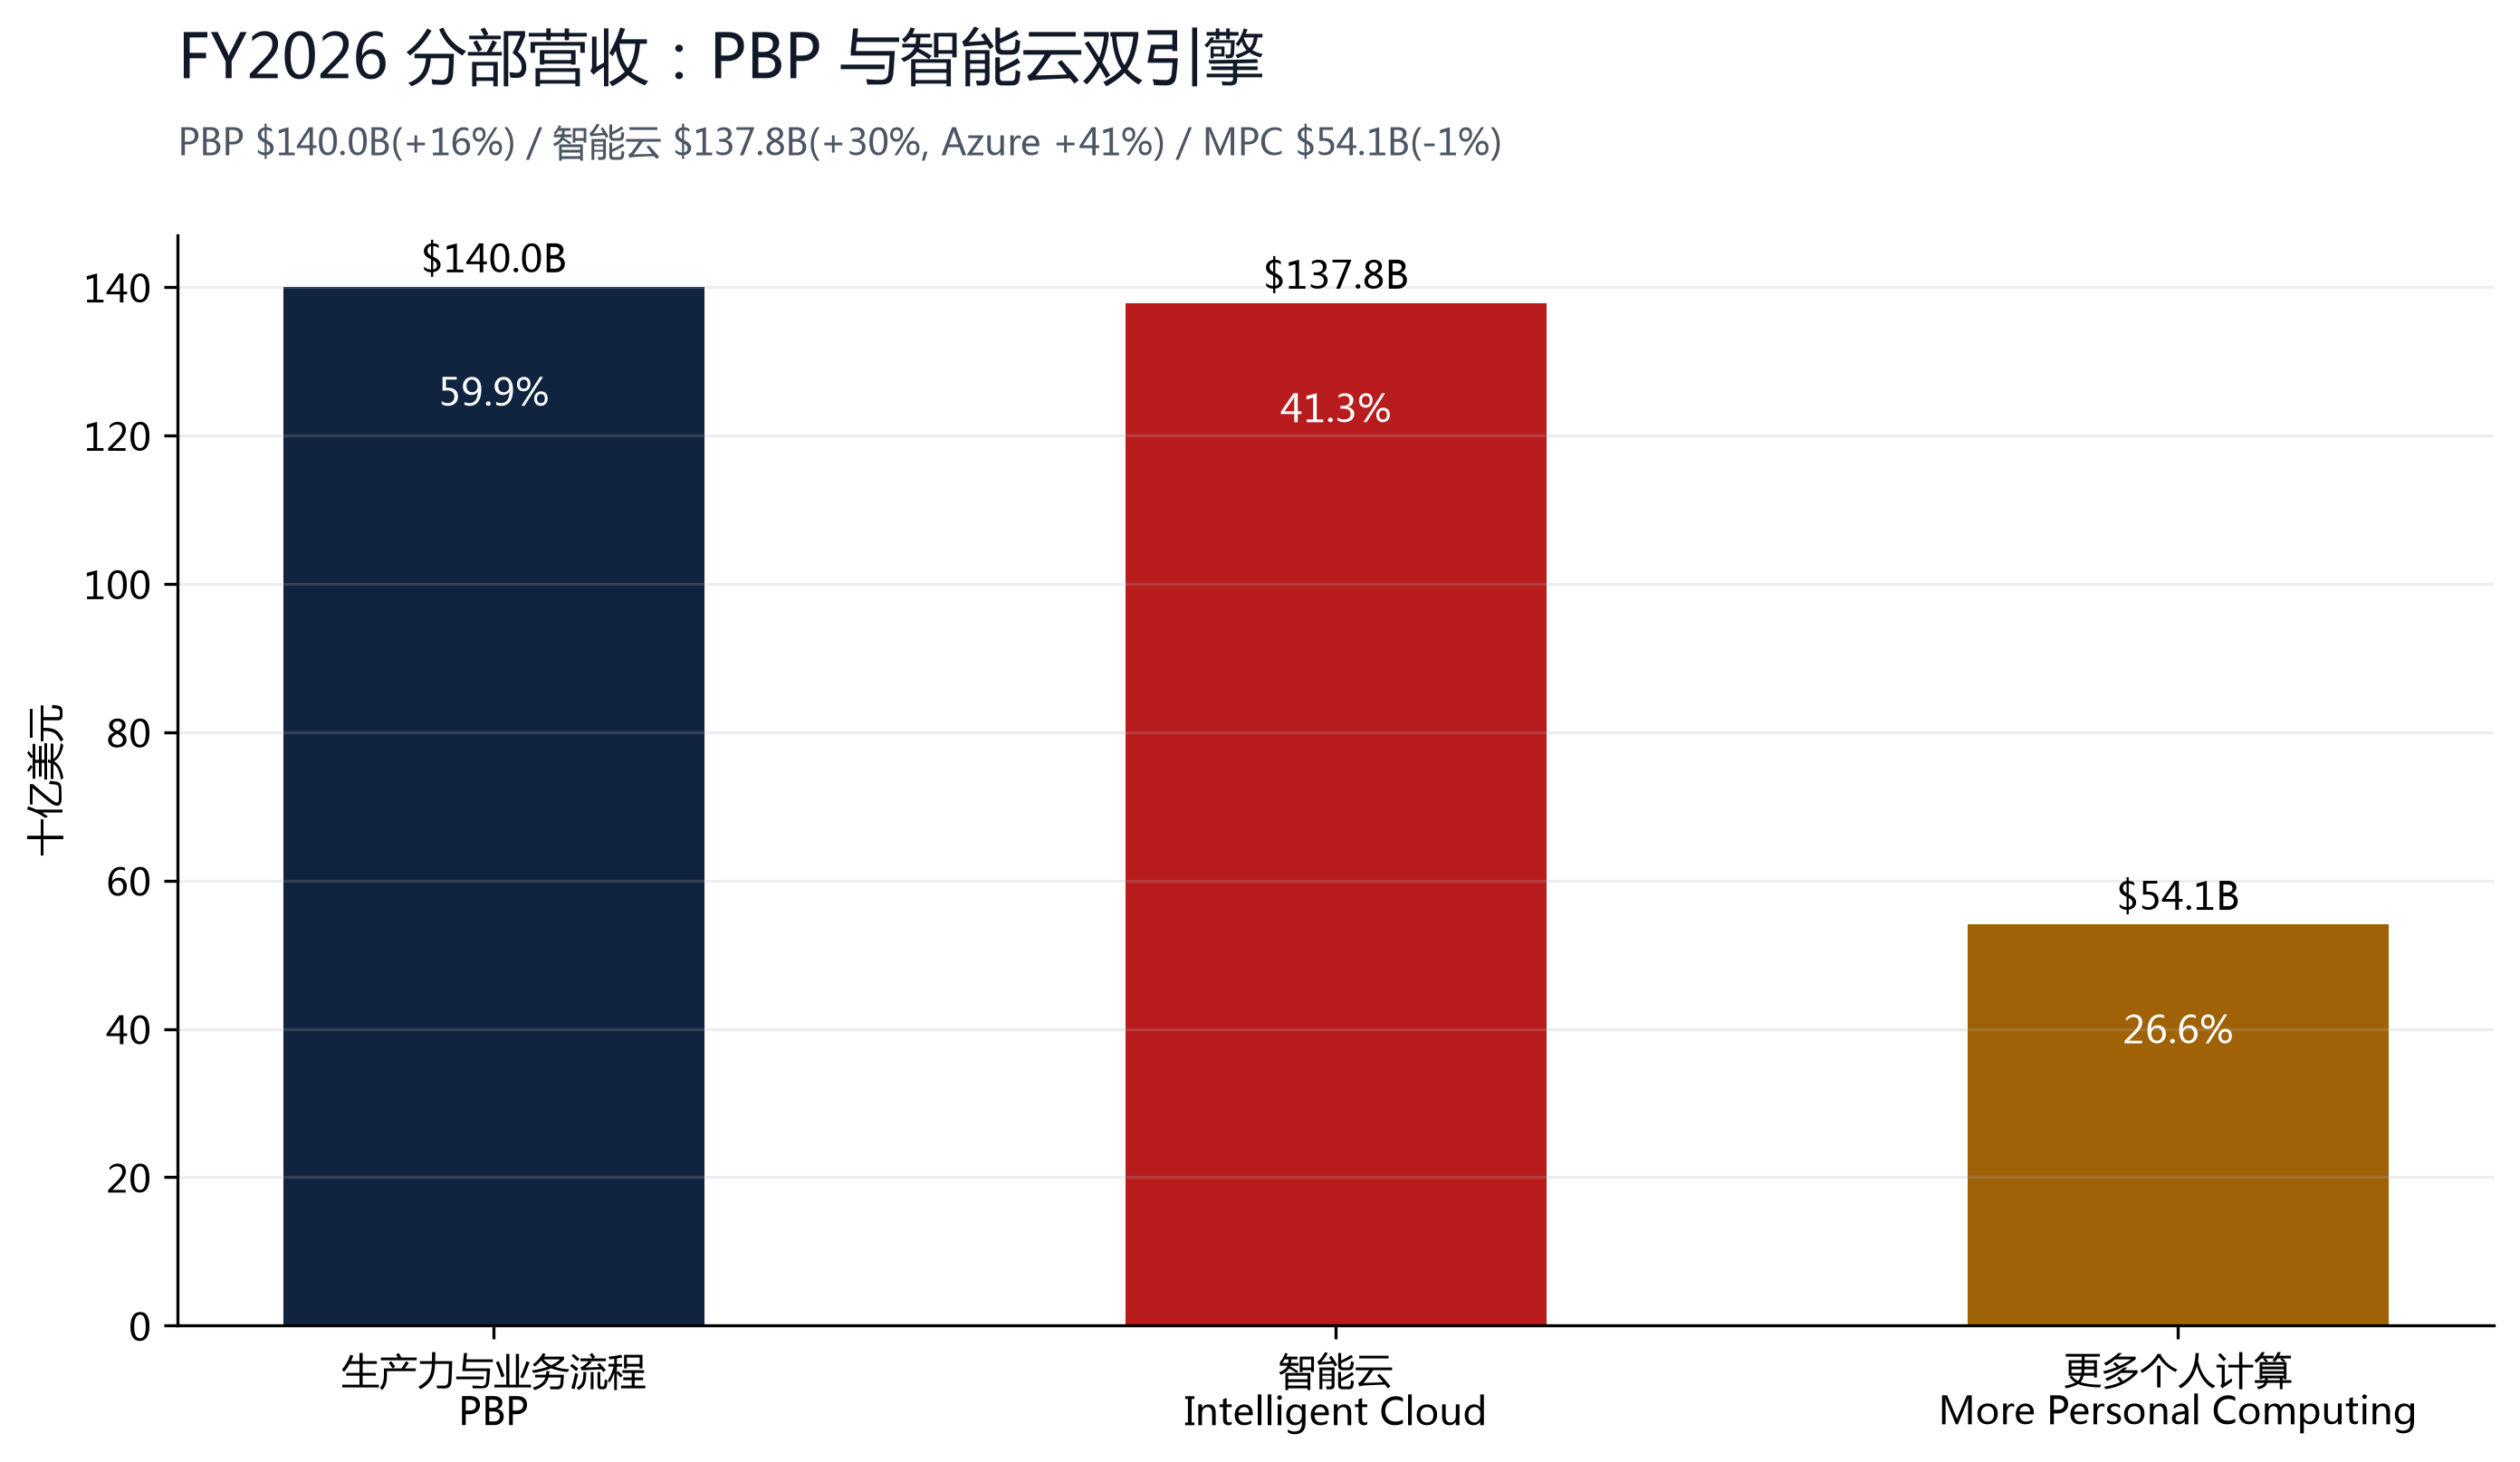
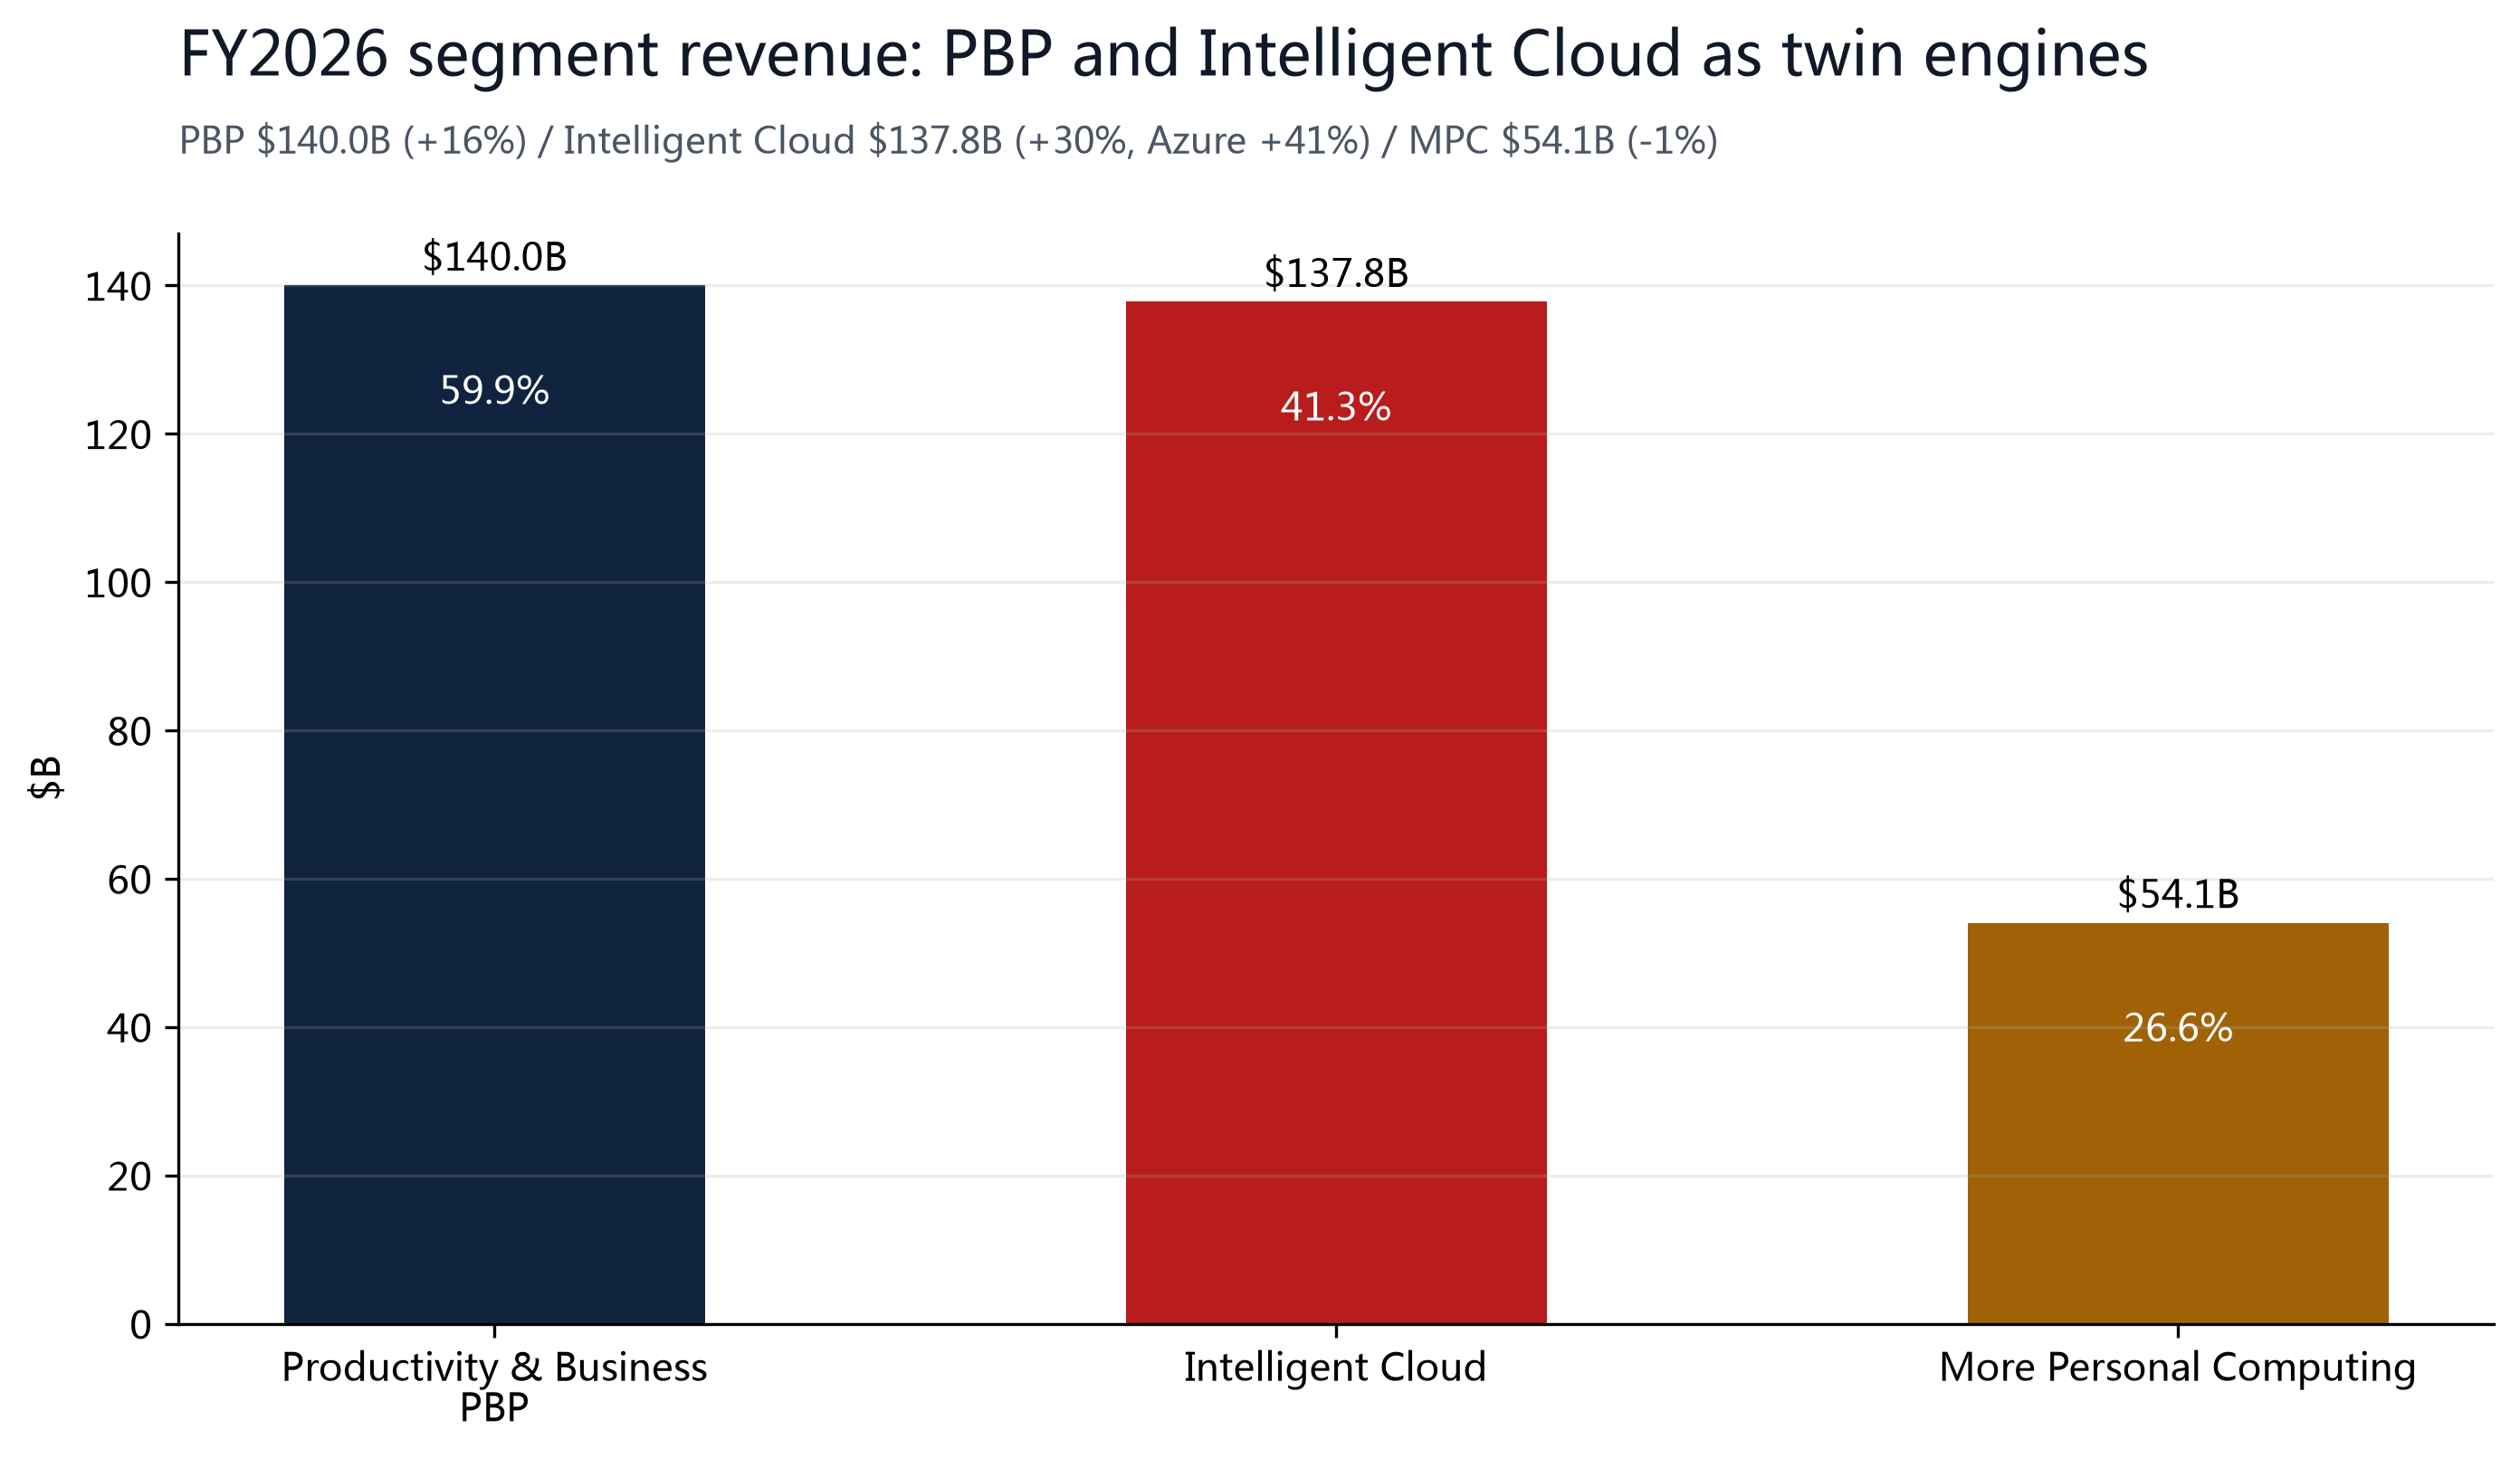
| Productivity & Business Processes | $140.0B | $83.9B | 59.9% |
| Intelligent Cloud | $137.8B | $57.0B | 41.3% |
| More Personal Computing | $54.1B | $14.4B | 26.6% |
§05Peer Comparables
Microsoft has no perfect peer: Apple is a hardware-plus-services conglomerate, Google is search/cloud/ads, Amazon is e-commerce plus AWS, and Nvidia is AI compute. The real differentiators are cloud-and-AI conversion and balance-sheet quality: Microsoft's Microsoft Cloud revenue of $214.4B and cRPO of $678B (+84%) give it the highest backlog visibility among hyperscalers, and Azure's +41% growth sits in the top tier with AWS and Google Cloud, while its net-cash $36.5B balance sheet is markedly stronger than debt-funded peers. We locate Microsoft by its own multiples below; peer figures are qualitative references only (peer multiples come from various sources and may lag the latest price, so hard numbers are not itemized).
| Microsoft's own multiples | Value | Note |
|---|---|---|
| P/E (TTM, GAAP $17.95) | 24.7x | computed |
| Forward P/E (FY27E $19.47) | 22.8x | consensus |
| EV / EBITDA | 16.9x | EV $3,273B / EBITDA $193.7B |
| P / S | ~10.0x | on $331.8B rev |
| Dividend yield | 0.82% | $3.64/sh |
§06Ownership
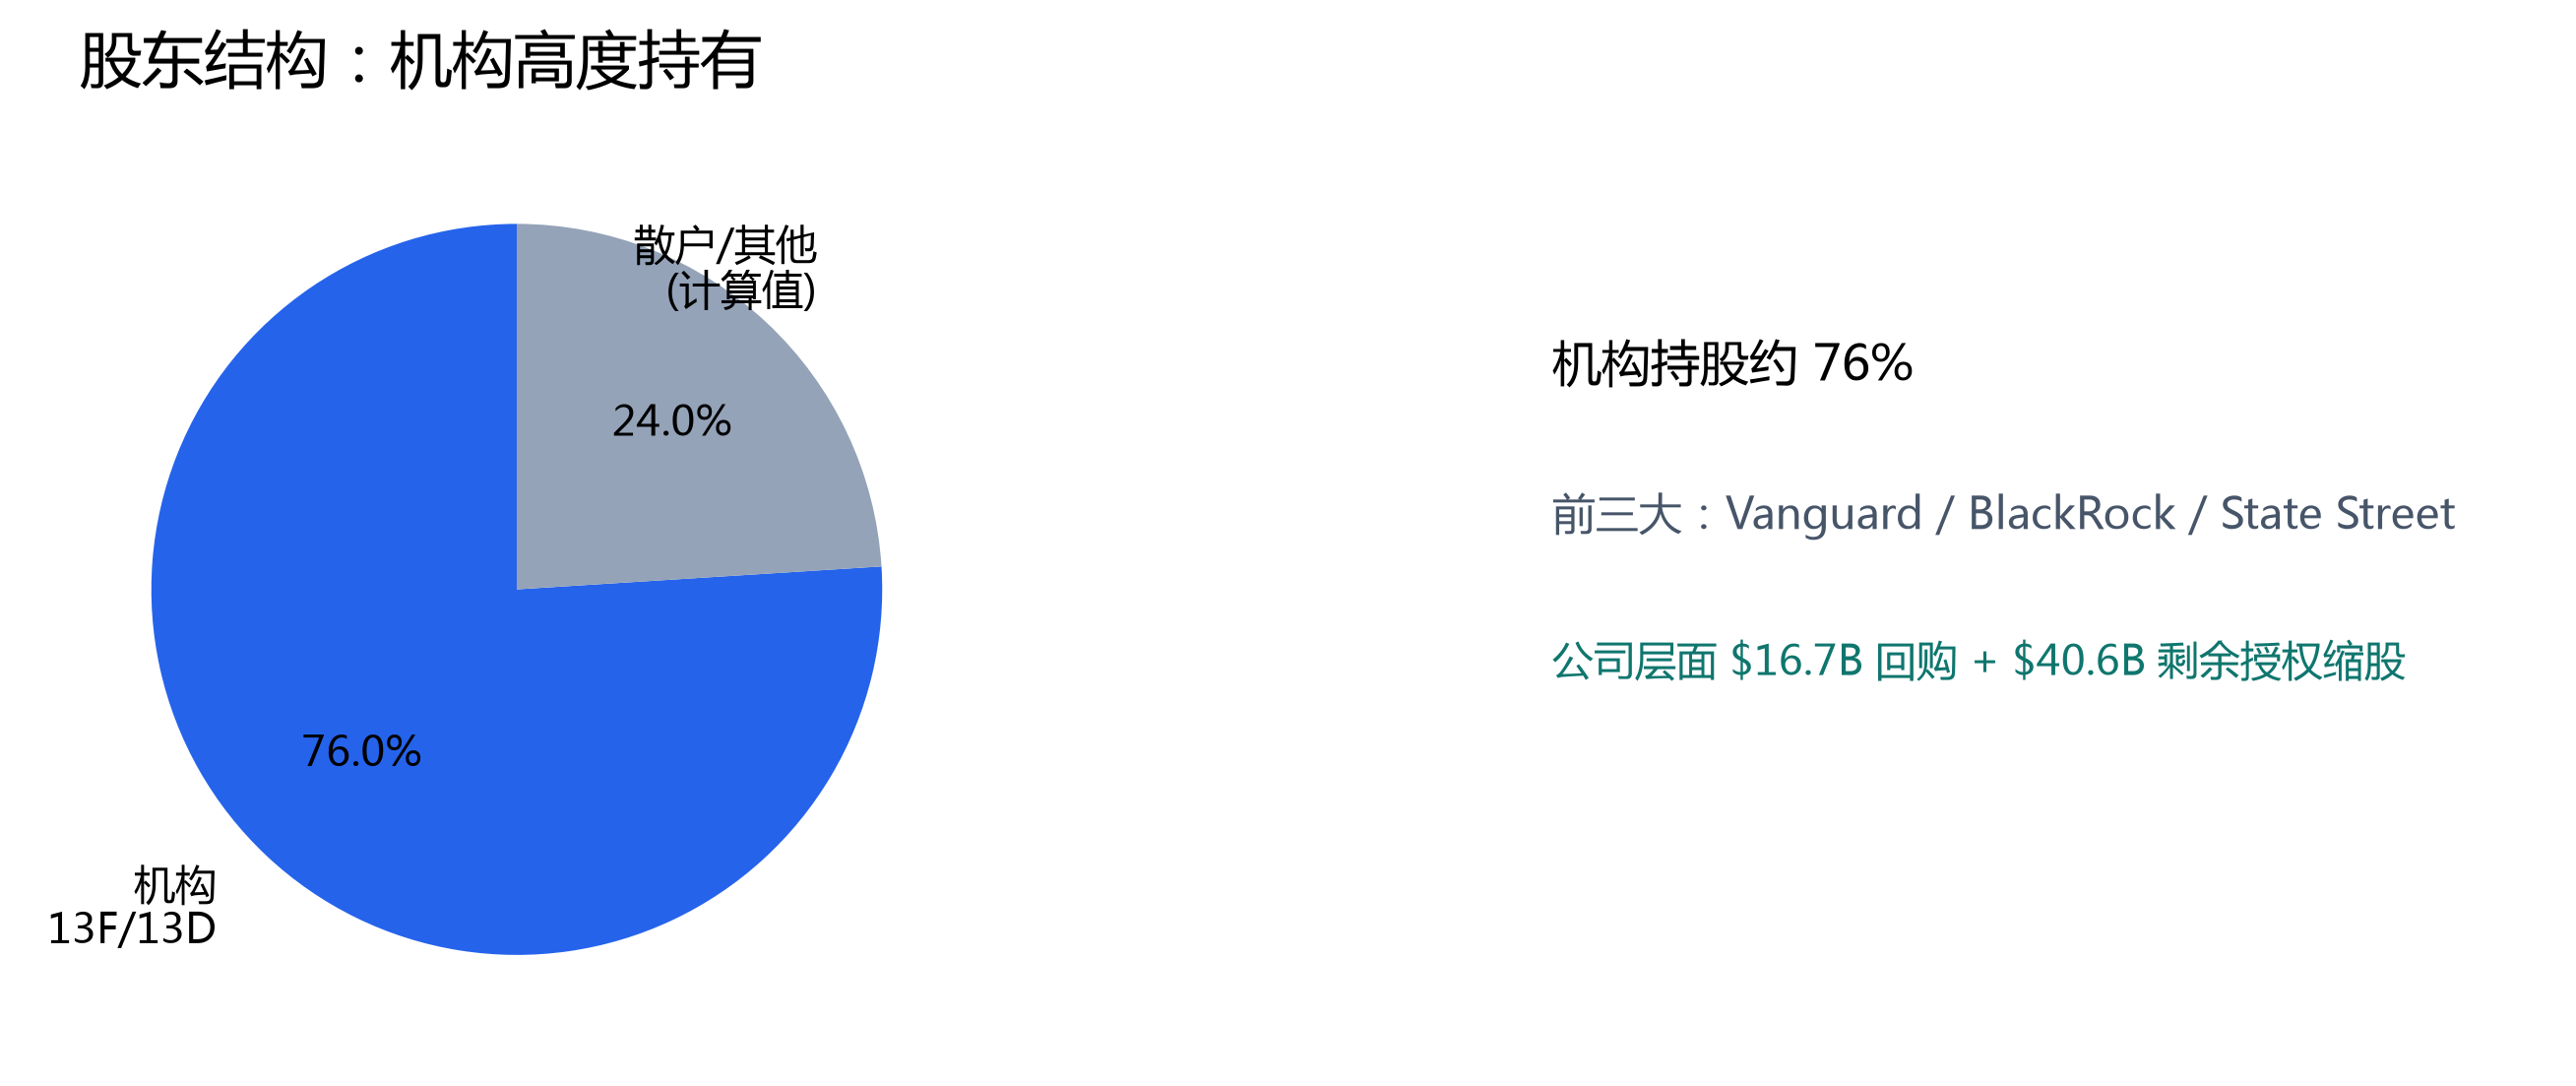
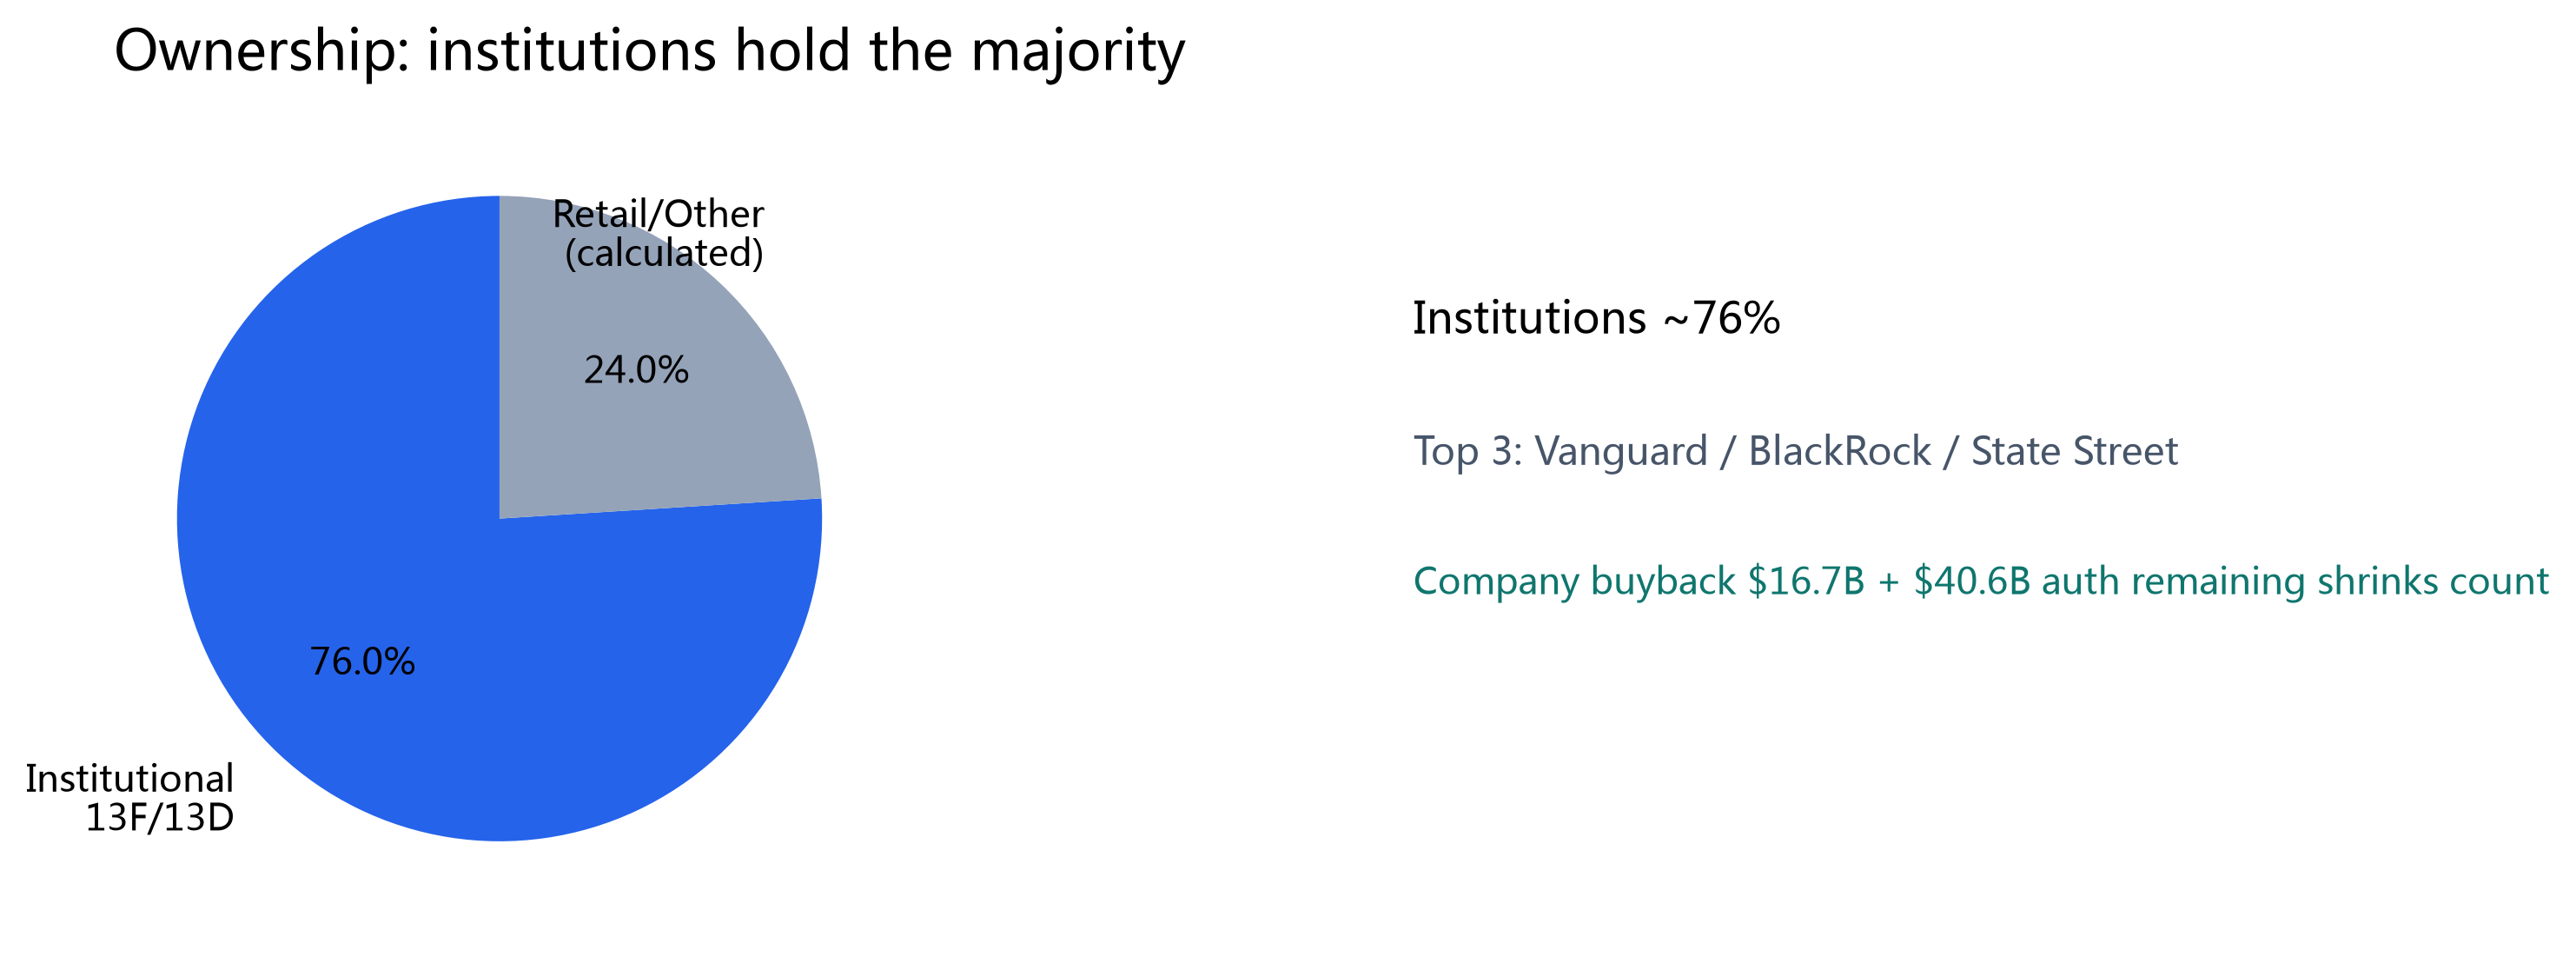
Per finviz, institutions hold about 76% of Microsoft, with Vanguard, BlackRock, and State Street as the top three — a highly institutionalized, stable holder base. Over the past 90 days, insider Form 4 filings aggregated to 16 buys and 4 sells, but whether individual sales fall under a pre-set 10b5-1 plan is not publicly disclosed, so insider selling should not be read as a bearish signal before that is confirmed.
Meanwhile the company itself is buying back shares at $16.7B a year (36M shares repurchased in FY2026) with $40.6B of authorization still remaining — a genuine buyer moving opposite to any individual insider sales; together with net cash of $36.5B, there is a real 'buyback-plus-cash' cushion on the downside.
§07Valuation and Price Target
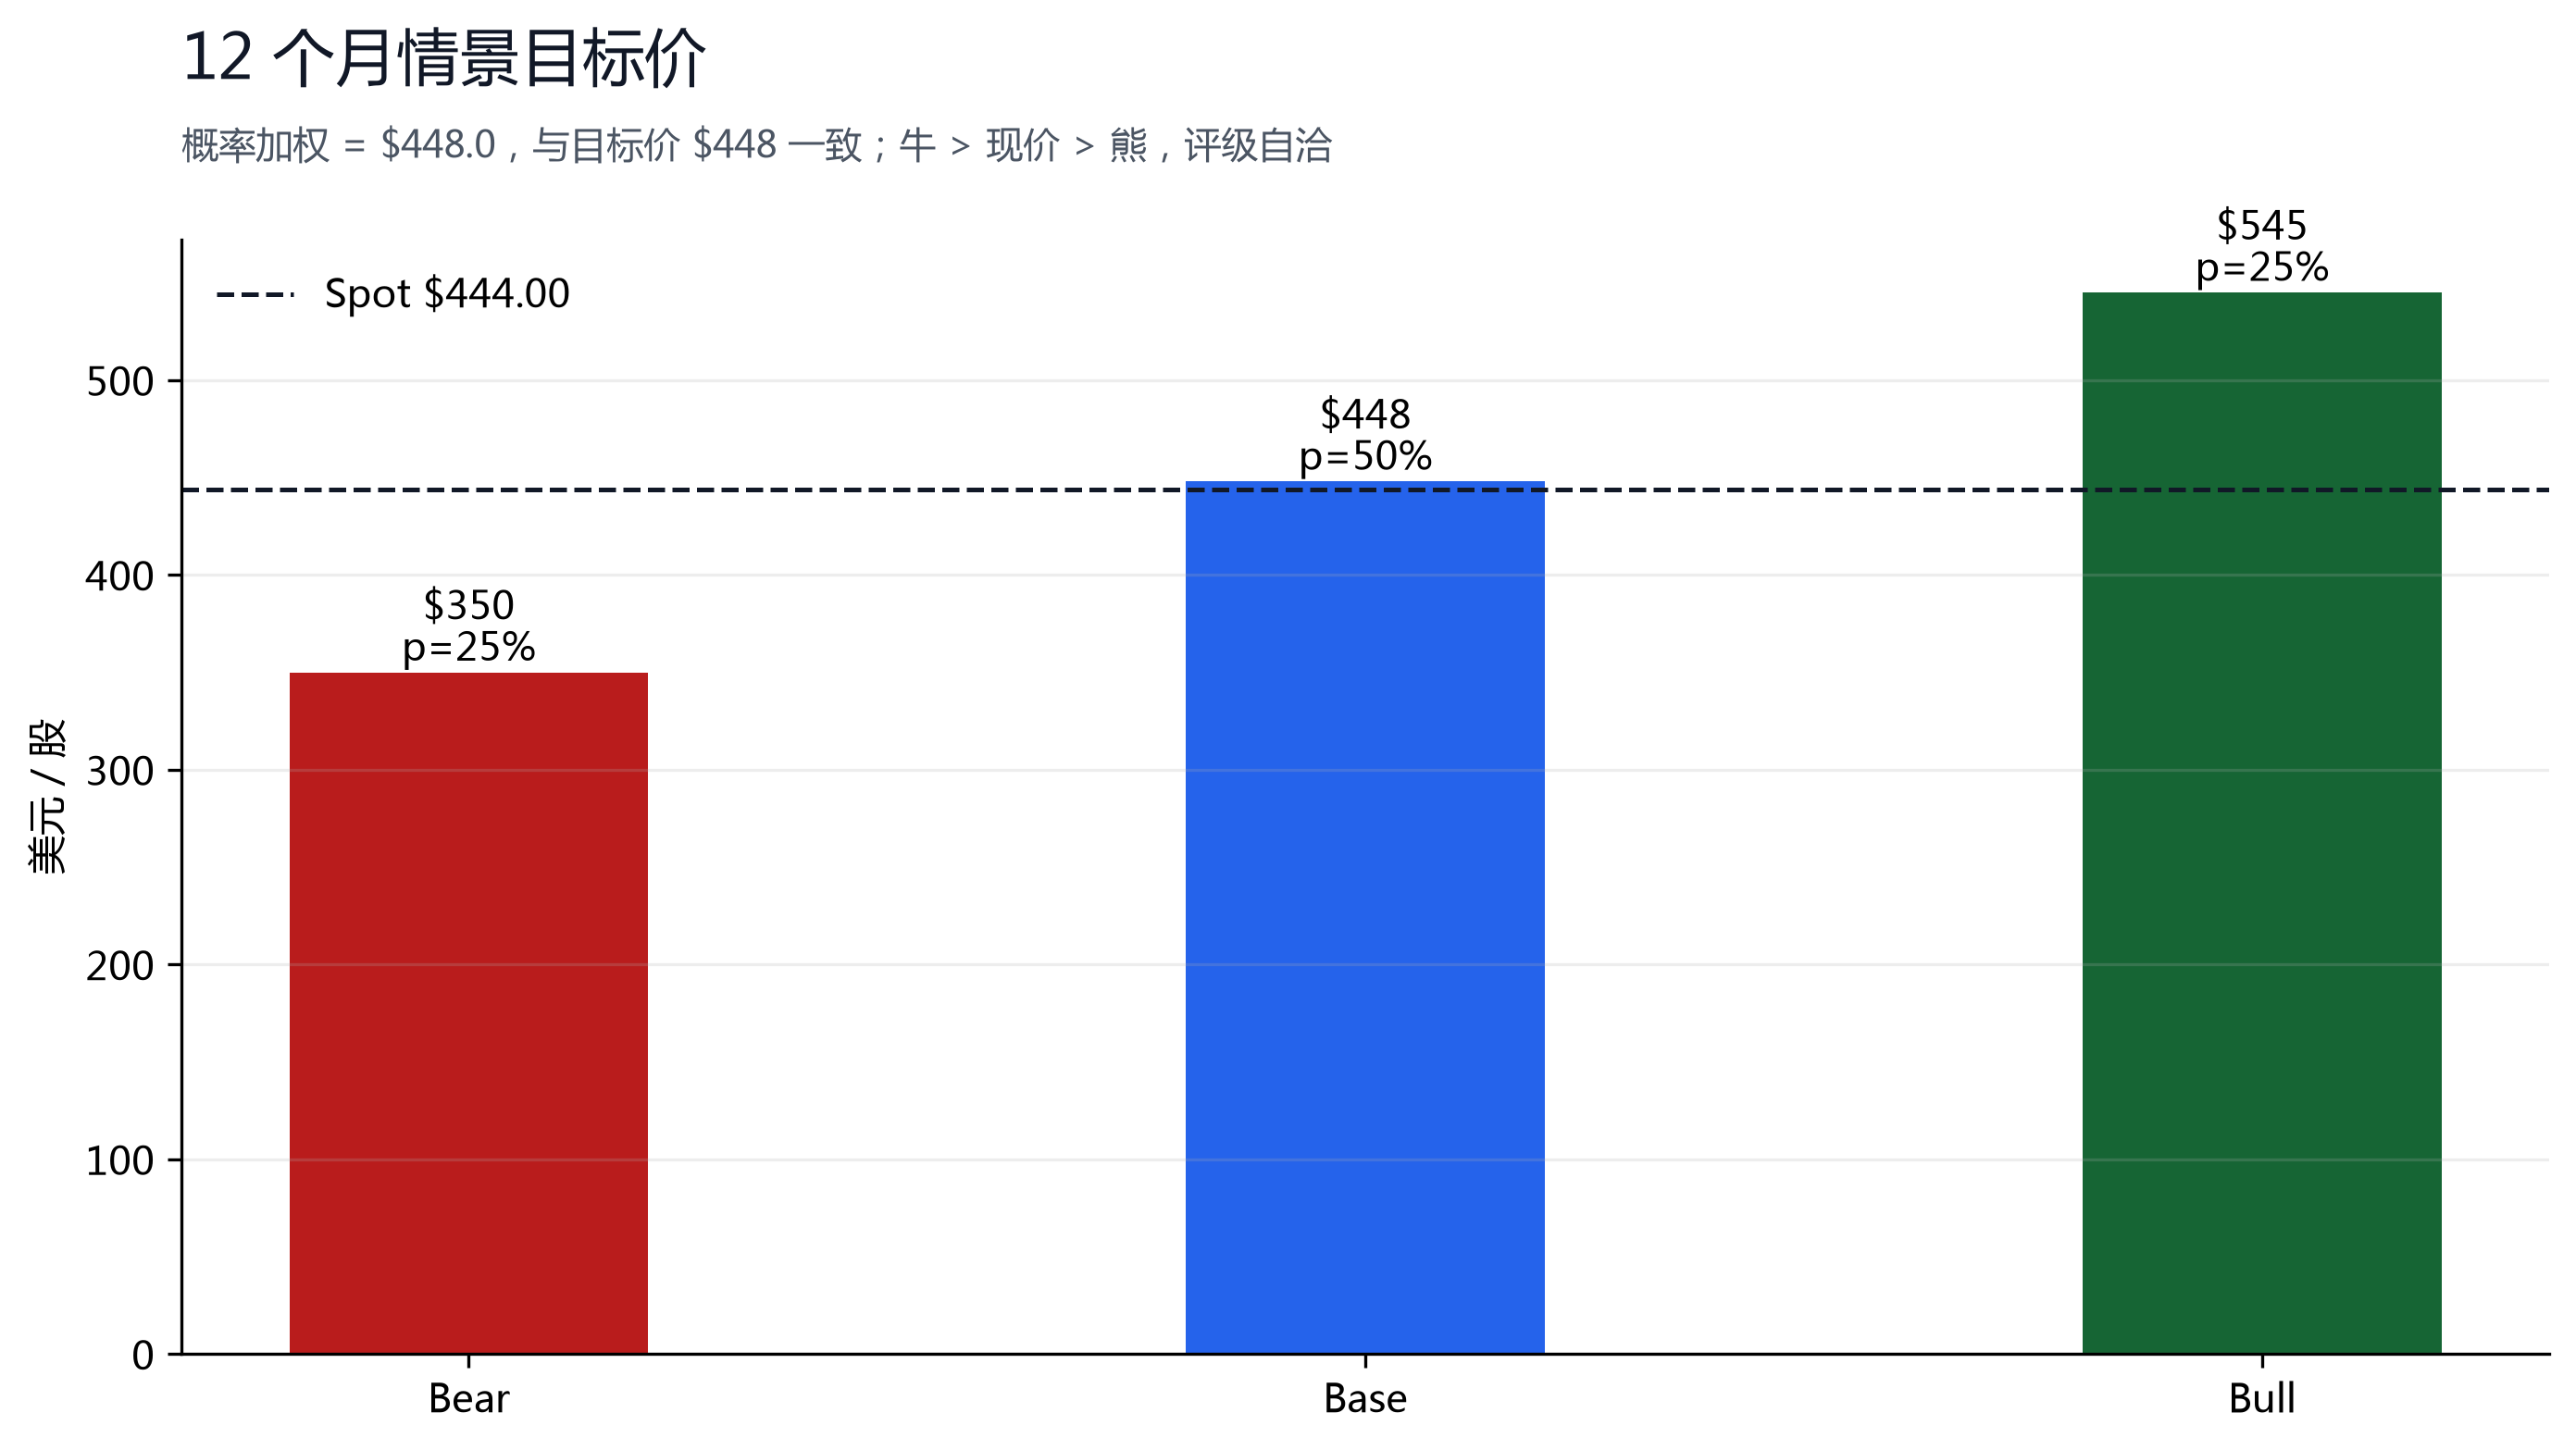
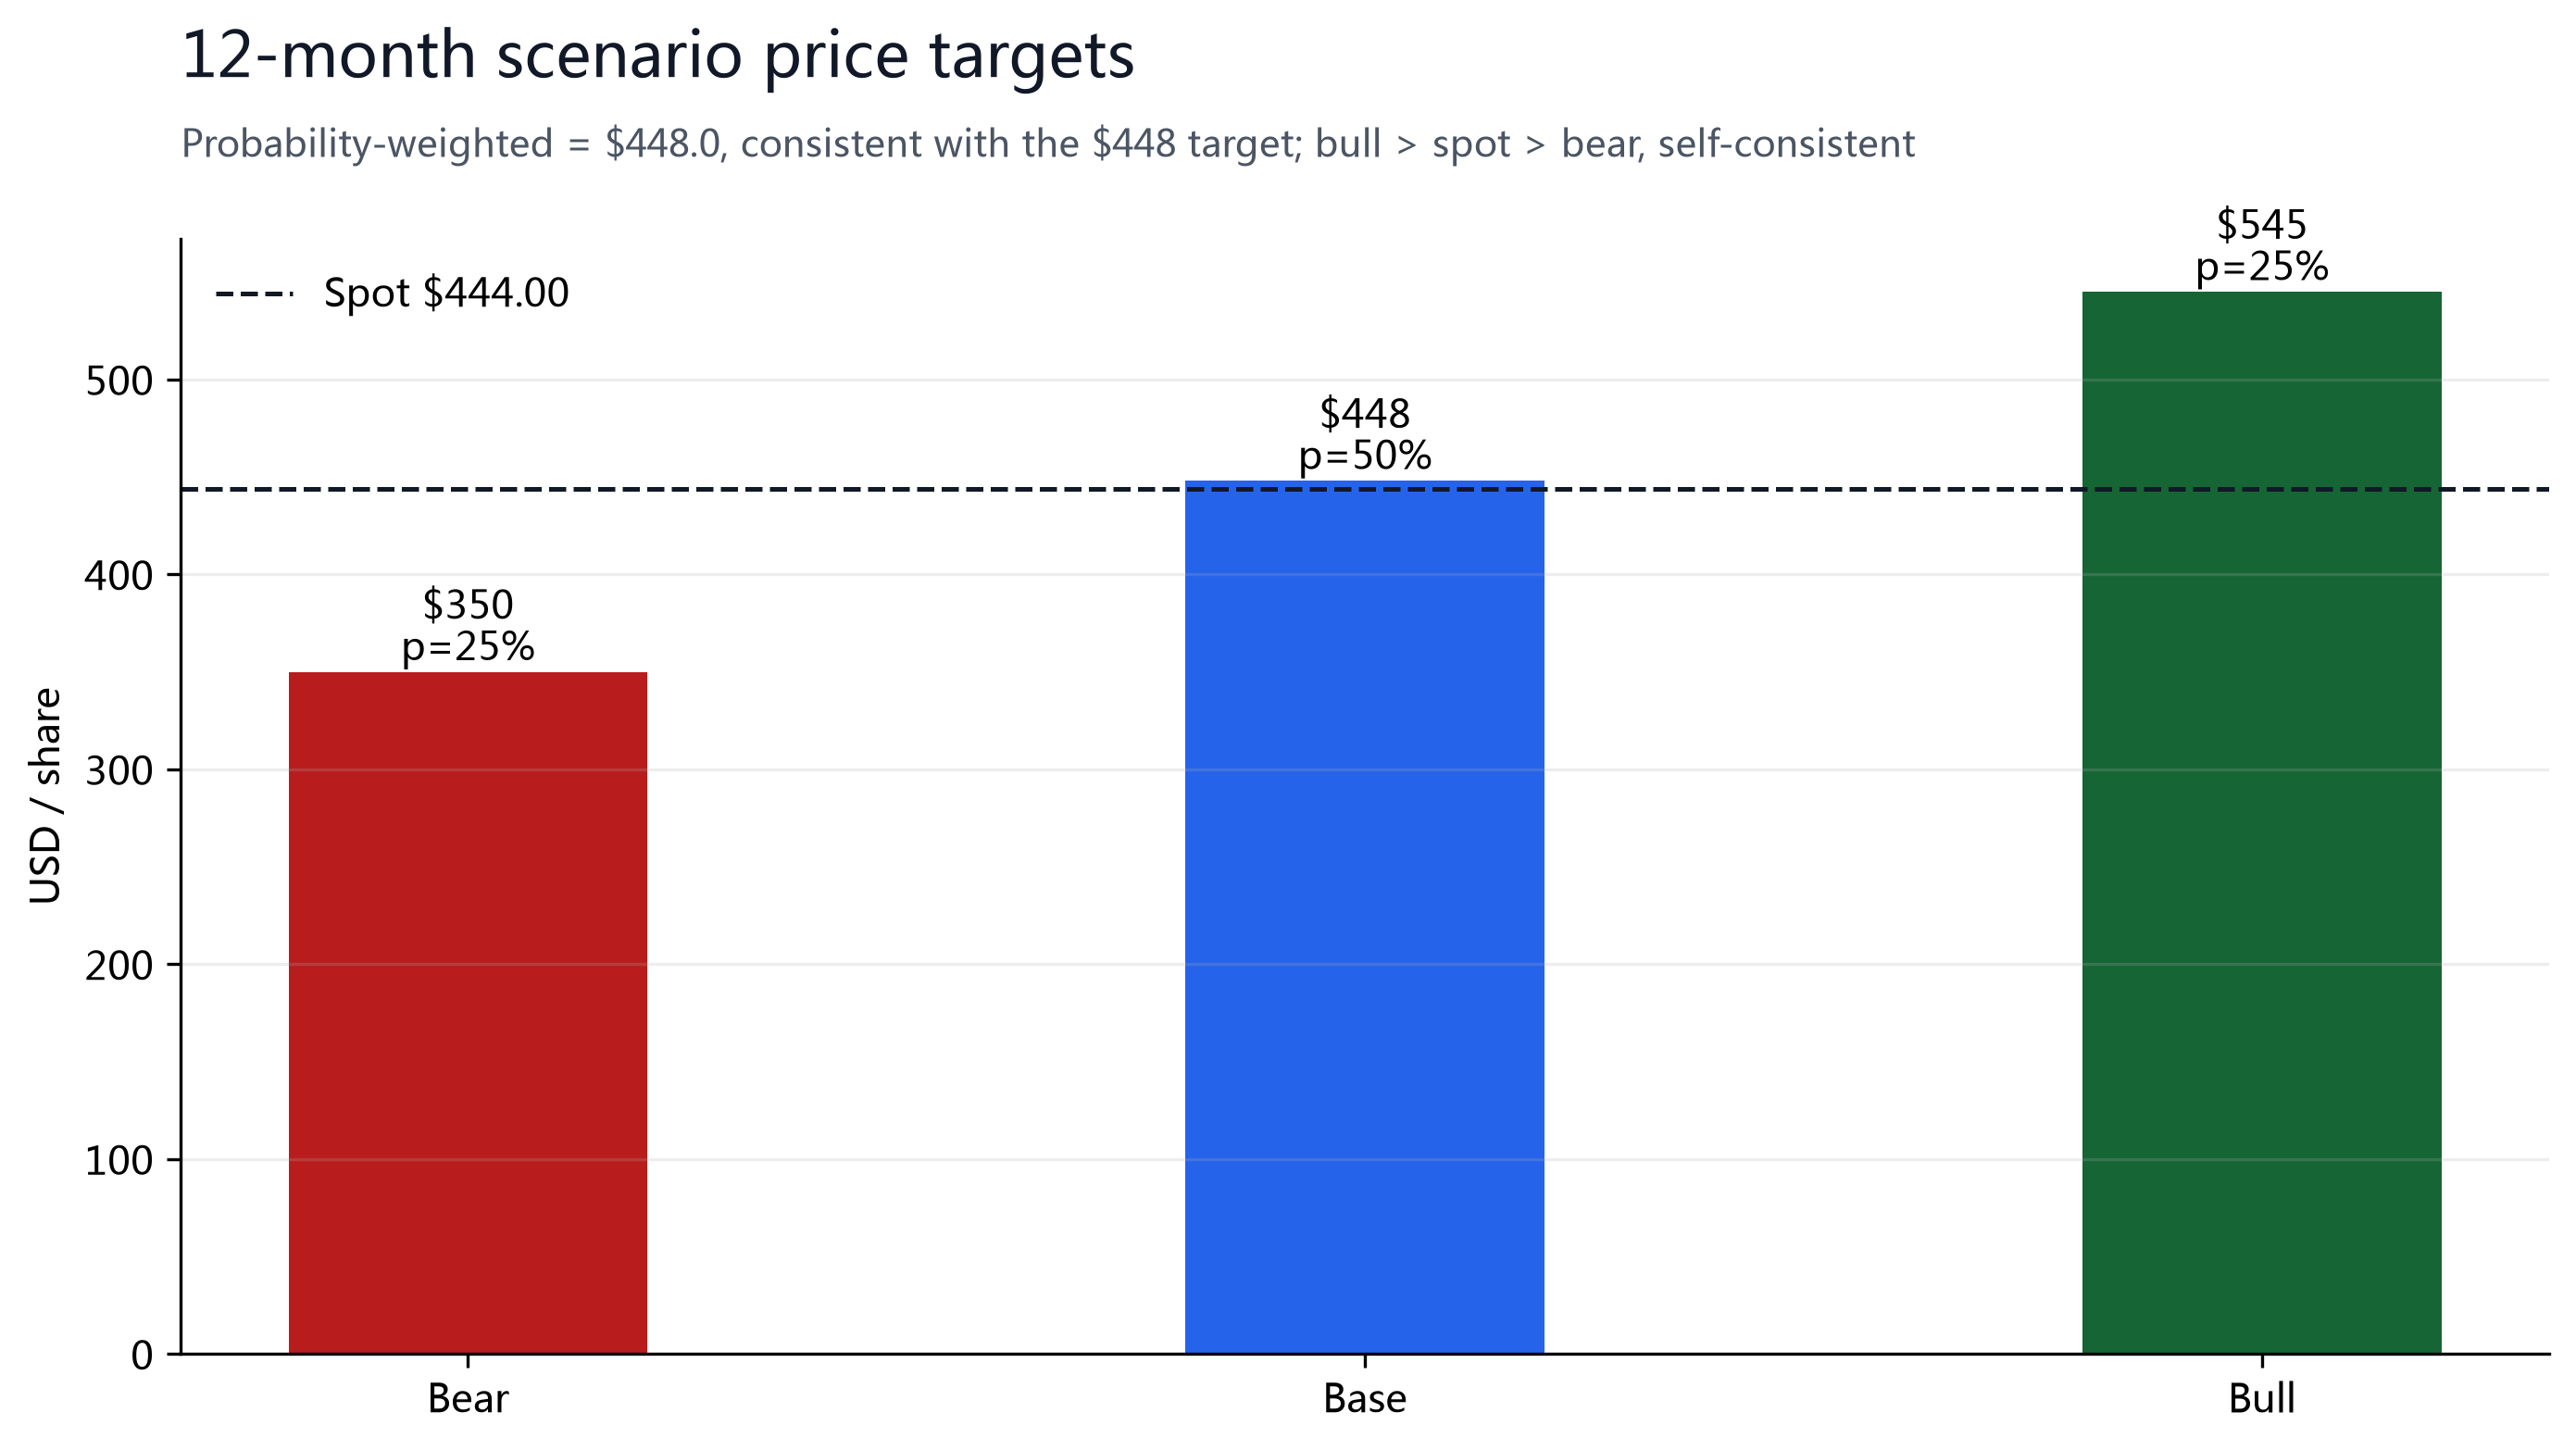
| Scenario | FY27E EPS × multiple | PT | Weight |
|---|---|---|---|
| Bear | $19.47 × 18x | $350 | 25% |
| Base | $19.47 × 23x | $448 | 50% |
| Bull | $19.47 × 28x | $545 | 25% |
| Weighted PT | 0.25×350 + 0.50×448 + 0.25×545 | $448 | 100% |
We weight the three P/E scenarios to a 12-month price target of $448 (+0.9% vs spot). Because the stock has re-rated from $390.54 to $444.00 (+13.7%), we raised the base multiple from 22x to 23x and the bear multiple from 16x to 18x — reflecting a higher valuation center but a correspondingly narrower upside; the bull multiple stays 28x. We anchor on the FY27E consensus EPS of $19.47 rather than the FY2026 GAAP figure, to strip out the +$0.67 one-time OpenAI gain. The three scenarios — Bear $350 / Base $448 / Bull $545 at 25/50/25 probabilities — weight to exactly $448.0, identical to the target; with the bull case $545 above spot and the bear case $350 below it, the rating and scenarios are self-consistent. In bridging from enterprise value to equity we count only $76.8B of corporate cash and $40.3B of total debt (net cash $36.5B).
§08Catalysts and Risks
| Date / Window | Event | Direction |
|---|---|---|
| Mid 2026-10 | Q1 FY2027 earnings | Validate cRPO conversion, AI-capex guide, cloud growth |
| 2026-11 | Microsoft Ignite (AI/cloud products) | AI-monetization progress helps; capex tone hurts |
| Ongoing | FOMC / rate path | 10Y breaking 4.80% or hikes pressure the multiple |
(1) AI-infra capex stays elevated and FCF remains pressured (already -6.4% in FY2026);
(2) the More Personal Computing segment fell -1% and the growth engine is narrowing;
(3) ~22.8x forward is now a thin margin of safety for a decelerating blue chip;
(4) antitrust / regulatory risk (cloud and AI M&A and conduct reviews);
(5) the 10-year Treasury yield breaks 4.80% or the Fed hikes, pressuring the multiple;
(6) OpenAI exposure and AI-monetization pacing disappoint.
Upside risk: if FY2027 cloud growth holds, cRPO keeps converting, and AI monetization beats, the multiple could return to 24-28x, mapping to the $545 bull case (+22.7% vs spot).
§09Sources, Limits and Disclosure
- Microsoft FY2026 Form 10-K (filed 2026-07-29, period ended 2026-06-30): 3-yr income statement / segments / cash flow / balance sheet / buyback (Item 8)
- Microsoft FY2026 earnings call transcript (Azure growth, cRPO, capex guide, OpenAI gain)
- Price and post-earnings reaction: MarketWatch / finviz / tradingkey (2026-07-29/30)
- Analyst ratings and consensus: MarketWatch / S&P Global (Jul 2026); FY27E EPS $19.47 is consensus
- Institutional ownership: finviz; rates: Federal Reserve H.15 / Wall Street Journal (2026-07-29)
Limitations: 52-week highs/lows are from market-data sources (MarketWatch / finviz); the spot price is the realtime quote of 2026-07-30 (user-provided), while Beta/RSI/short-interest are Jul 29 aggregated quotes and may differ slightly in timing; FY27E EPS $19.47, the EV/EBITDA multiple, and the peer positioning are consensus or author estimates, with peers referenced only qualitatively; the options IV term structure and insider 10b5-1 classification had no public source and were not fabricated; the 24.7x TTM P/E uses GAAP EPS $17.95. This report is not investment advice.