Alphabet NASDAQ:GOOGL
Published July 24, 2026. Market data as of the July 23, 2026 close; operating data sourced first-hand from Alphabet's Form 10-Q (filed July 23, 2026).
Alphabet is the undisputed leader in global search and digital advertising, and the cloud-infrastructure player with the most data ammunition in the AI arms race. Q2 revenue came in at US$119.8B (+24% YoY) with operating margin at a near-record 34.0%; Google Cloud revenue grew +82% YoY, the quarter's most powerful growth engine. But reported net income and EPS were flattered by a ~US$99B one-time gain on equity securities (SpaceX and other private holdings) — valuation should anchor on operating earnings and forward EPS, not this quarter's GAAP net income.
We rate the stock Overweight (Buy) with moderate conviction and a 12-month price target of $340, roughly +7% upside from the current $317.69. One caveat: this quarter's earnings are distorted by the one-time gain — the reported P/E of 15.94x is an optical illusion. Ex-gain, the operating P/E is ~27x, in the same league as MSFT and AMZN.
§01Investment Summary
Alphabet's investment thesis in one line: search advertising is the cash machine, YouTube is the moat, and Cloud is the AI-era call option. Q2 reaffirmed that structure — revenue comfortably beat the market's slowdown fears, operating margin expanded to 34%, and Cloud's 82% growth is the one engine that can reframe the stock from "value" back to "growth."
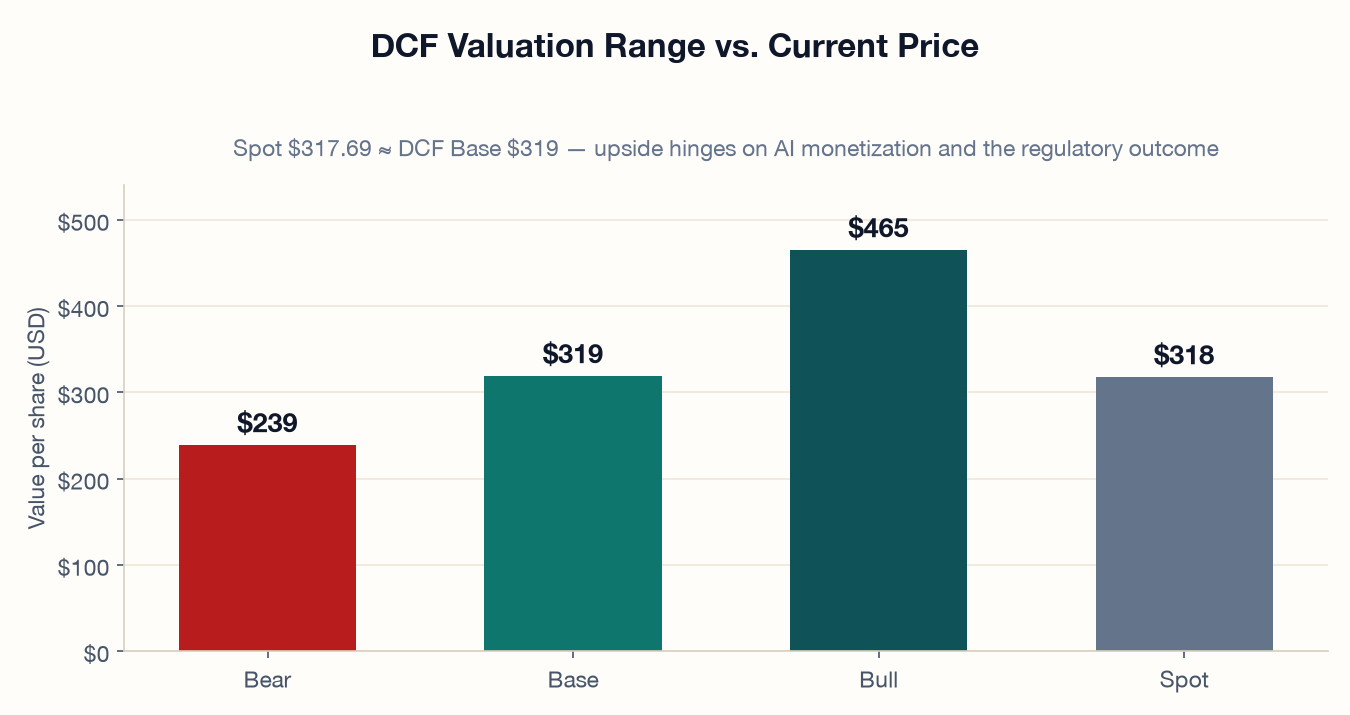
The call: Overweight (Buy), moderate conviction. 12-month price target $340, about +7% from the current $317.69. With the stock sitting almost exactly on our DCF base case of $319, the Overweight thesis is not about catching a bargain — it is about paying a bear-case price for a structurally bullish cash cow. If AI monetization and Cloud margin delivery play out, the stock can grind toward the bull-case $465.
1) Cloud +82% YoY with a rising share of AI workloads — the key lever lifting revenue growth from "double digits" toward "hyper-growth";
2) Operating margin of 34.0% is near an all-time high — scale effects and AI efficiency tools are starting to drop through to earnings;
3) ~$144.3B of net cash — a fortress balance sheet that cushions buybacks, AI investment, and potential regulatory fines;
4) Search advertising is more resilient than feared — AI Overview and Gemini have not eroded core monetization; they are expanding the query universe instead.
§02Price Action & Analyst View
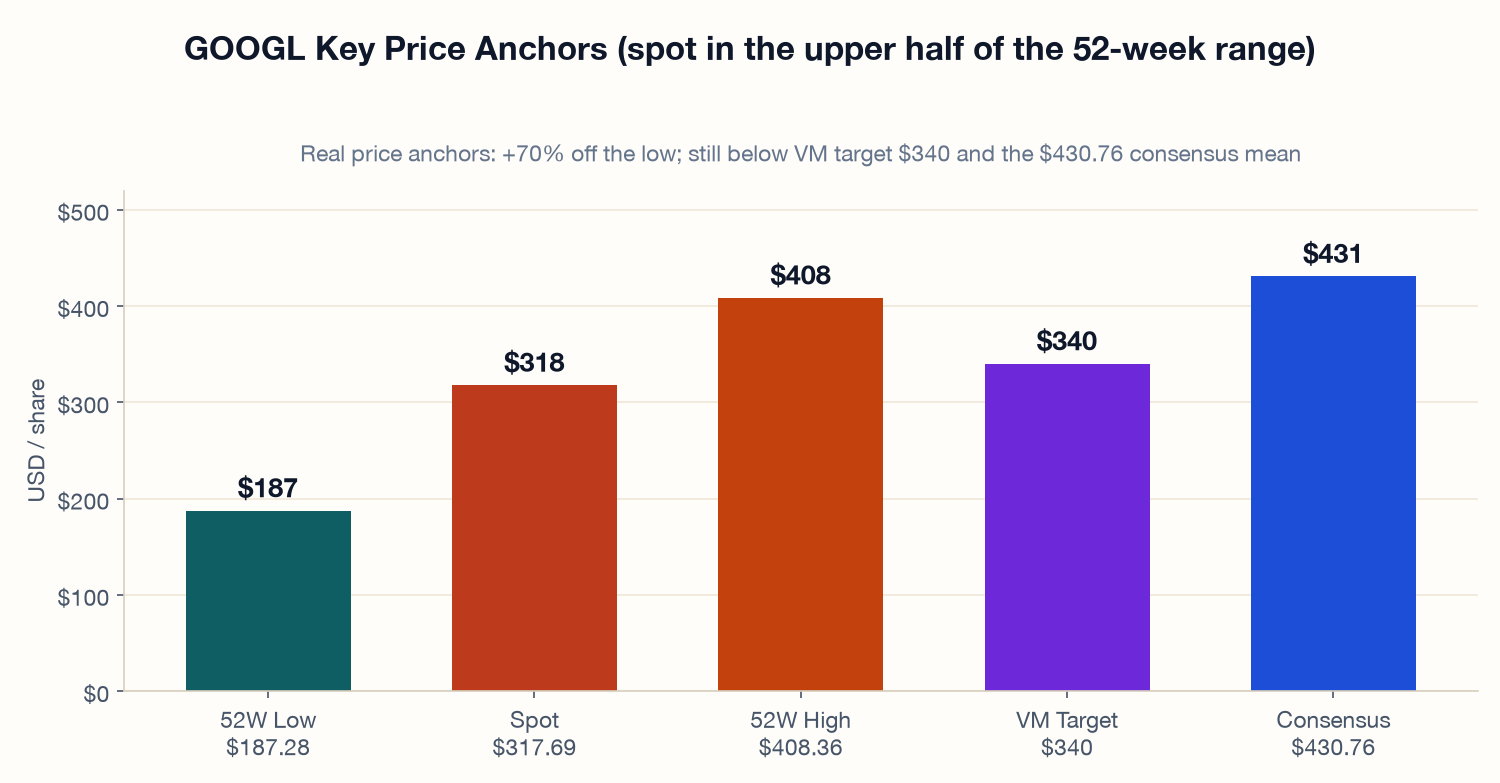
On the filing date (2026-07-23) GOOGL closed at $317.69, −7.13% on the day. The market gave this "high growth + heavy CapEx + one-time gain" print a cold reception: bulls focused on Cloud acceleration and margins, while bears homed in on surging capex, the antitrust overhang, and the EPS distortion from the one-time gain.
| Item | Value | Source / Note |
|---|---|---|
| Current price | $317.69 | Jul 23, 2026 close, NeoData |
| Market cap | $3,885B | ~12,230M shares outstanding |
| Filing-day move | −7.13% | Sharp post-print pullback |
| TTM P/E (reported) | 15.94x | Depressed by the one-time gain |
| TTM P/E (operating) | ~27x | Our estimate ex the $99B one-time gain |
| 52-week range | $187.28 – $408.36 | Aug 1, 2025 – May 18, 2026 |
| Consensus price target | $430.76 | 62 firms, range $340–$550 |
Peer Comparison
Among US mega-cap tech and AI-infrastructure peers, Alphabet's operating P/E of ~27x sits mid-pack; its +24% revenue growth tops MSFT/AMZN/AAPL, while its 34.0% operating margin beats AMZN/AAPL but trails META/MSFT/NVDA. On PEG (~27x ÷ +24% ≈ 1.1x), Alphabet is not expensive.
Basis: P/E is TTM (NeoData, Jul 23, 2026); growth and operating margins are from each company's latest reported quarter (META/AMZN FY26 Q1, MSFT FY26 Q3, NVDA FY27 Q1, AAPL FY26 Q2), YoY vs. the year-ago quarter, source NeoData.
| Company | Ticker | TTM P/E | Rev Growth | Op Margin |
|---|---|---|---|---|
| Alphabet | GOOGL | 15.94x / ~27x | +24% | 34.0% |
| Meta | META | 22.0x | +33% | 40.6% |
| Microsoft | MSFT | 22.7x | +18% | 46.3% |
| Amazon | AMZN | 28.0x | +17% | 13.4% |
| NVIDIA | NVDA | 32.0x | +85% | 65.6% |
| Apple | AAPL | 38.9x | +17% | 32.3% |
§03Bull vs. Bear
Search resilience: AI Overview has not diluted ad-click value — it is lifting user engagement and query frequency.
Cloud rocket: +82% growth alongside a 34% group operating margin signals Cloud is shifting from scale-building to profit harvest.
Margin structure improving: A record 34% operating margin as AI automation starts to bend unit costs lower.
Cash fortress: $144.3B net cash — annualized buyback capacity underpins EPS and buffers tail risks.
Antitrust overhang: Search distribution deals, Play Store fees, and the ad-tech stack all face regulatory breakup risk.
Uncertain AI payback: Q2 CapEx of $44.9B (+100% YoY) and $80.6B for H1, annualizing toward $160B+ — if AI monetization disappoints, ROIC gets diluted.
One-time distortion: The $99B unrealized equity gain won't repeat; reported EPS and P/E mislead retail investors.
Cloud durability: The 82% growth rate may include one-off migrations or seasonality — it needs two more quarters of proof.
§04Financial Reality
In Q2, Alphabet revenue reached $119.8B, +24% YoY and +9.0% QoQ — comfortably ahead of the market's slowdown fears. Operating income was $40.8B for a 34.0% operating margin, up roughly 1.6pp YoY (32.4%→34.0%). But of the $112.2B net income, roughly $99B came from fair-value remeasurement of private equity stakes (SpaceX among them) — a non-cash, non-recurring item.
| Metric | 2Q26 | YoY | QoQ | Note |
|---|---|---|---|---|
| Total revenue | $119.8B | +24% | +9.0% | Ahead of expectations |
| Operating income | $40.8B | +30% | +2.7% | Margin 34.0% |
| Net income | $112.2B | +298%* | +79%* | *Incl. ~$99B one-time gain, distorted |
| Diluted EPS | $9.11 | +294%* | +78%* | H1'26: $14.24; *distorted |
| Operating cash flow | $39.1B | +41% | −15% | H1'26 total $84.9B (+33%) |
| Capital expenditure | $44.9B | +100% | +26% | AI infrastructure; H1'26 total $80.6B (+103%) |
Note: quarterly cash-flow figures are NeoData data, cross-validated line-by-line against the 10-Q 6-month totals (Q1+Q2=H1: OpCF 45.8+39.1=$84.9B, CapEx 35.7+44.9=$80.6B).
§05Business Mix
Google Services still pays the bills, but the growth story belongs to Google Cloud. That +82% is more than a number — it marks how fast enterprises are migrating onto AI workloads, TPU clusters, and Gemini for the enterprise.
| Segment | 2Q26 Revenue | YoY Growth | Key Takeaway |
|---|---|---|---|
| Google Services | ~$94.5B | +14.5% | Search + YouTube + subscriptions core |
| └ Search & other | ~$63.3B | +17% | The cash engine; AI Overview no drag |
| └ YouTube advertising | ~$11.1B | +13% | Shorts vs. streaming competition |
| └ Google Network | ~$7.3B | −1% | Network ads keep shrinking |
| └ Subscriptions, platforms & devices | ~$12.9B | +15% | YouTube subs + Pixel + Play |
| Google Cloud | ~$24.8B | +82% | AI workloads + enterprise cloud shift |
| Other Bets | ~$0.38B | +2% | Long-dated options like Waymo |
§06Balance Sheet & Cash Flow
Alphabet runs one of the most conservative balance sheets in mega-cap tech: $242.5B of cash and marketable securities (incl. equivalents) against $98.2B of long-term debt — roughly $144.3B of net cash. That comfortably funds a $50–60B annual buyback pace, sustained heavy AI CapEx, and potential antitrust fines.
| Balance Sheet (excerpt) | Value |
|---|---|
| Cash & marketable securities (incl. equivalents) | $242.5B |
| Long-term debt | $98.2B |
| Net cash | $144.3B |
| Shares outstanding | 12,230M |
| Net cash / share | ~$11.8 |
| Cash Flow (excerpt) | Value |
|---|---|
| Operating cash flow (Q2) | $39.1B |
| Capital expenditure (Q2) | $44.9B |
| Free cash flow (Q2) | -$5.9B |
| H1'26 FCF (cumulative) | +$4.3B (−82% YoY) |
| CF pattern | Front-loaded CapEx; Q2 FCF negative |
| Capitalized | Majority |
Basis: quarterly cash flow from NeoData, cross-validated against the 10-Q 6-month totals (Q1+Q2=H1: OpCF 45.8+39.1=$84.9B, CapEx 35.7+44.9=$80.6B).
§07Valuation & Price Target
We cross-check a DCF (discounted free cash flow) against peer-relative valuation. The DCF runs Bear / Base / Bull scenarios with a Base WACC of 8.0% and terminal growth of 3.0%. The current $317.69 price lands almost exactly on Base at $319 — the market is pricing Alphabet's "AI delivery + antitrust risk" as neutral.
Core DCF Assumptions
| Parameter | Bear | Base | Bull |
|---|---|---|---|
| Revenue growth (5-yr avg) | 8% | 11% | 15% |
| Steady-state operating margin | 28% | 34% | 38% |
| CapEx / revenue | 22% | 15% | 12% |
| WACC | 8.5% | 8.0% | 7.5% |
| Terminal growth | 2.5% | 3.0% | 3.5% |
| Intrinsic value / share | $239 | $319 | $465 |
WACC Build-Up (Base)
| Item | Value | Note |
|---|---|---|
| Risk-free rate | 4.2% | 10Y UST |
| Equity risk premium | 5.0% | Implied |
| Beta | 1.05 | Peer average |
| Cost of equity | 9.45% | CAPM |
| After-tax cost of debt | 3.2% | AAA-grade |
| Target leverage | 10% | Net-cash structure |
| WACC | 8.0% | — |
Sensitivity: WACC × Terminal Growth
| WACC \ g | 2.0% | 2.5% | 3.0% | 3.5% |
|---|---|---|---|---|
| 7.0% | $330 | $360 | $398 | $447 |
| 7.5% | $300 | $324 | $354 | $391 |
| 8.0% | $275 | $295 | $319 | $348 |
| 8.5% | $254 | $271 | $290 | $314 |
| 9.0% | $236 | $250 | $266 | $286 |
Note: the matrix comes from the same two-stage DCF as the Base case (single-variable moves in WACC and terminal g only); the center cell (WACC 8.0% × g 3.0%) = $319, i.e., the Base valuation itself.
§08Catalysts & Risks
AI search monetization: Gemini and AI Overview lift ad ARPU, pushing search revenue growth back to 15%+.
Cloud margin delivery: Cloud operating margin already hit 35.6% in Q2 (vs. 20.7% a year ago) — scale effects are showing up; if they hold, the valuation story shifts from "value" back to "growth".
Softer-than-feared antitrust outcome: Fines instead of structural breakup would repair the valuation discount in one shot.
Waymo commercialization: An independent raise or IPO of the self-driving unit is a hidden option.
Regulatory breakup: DOJ cases on search distribution and the ad-tech stack could force divestitures.
AI ROI shortfall: If $160B+ of annual CapEx fails to convert into Cloud/ad revenue, ROIC declines.
Macro: Ad budgets track the economic cycle — a recession hits Search and YouTube directly.
Competition: Microsoft Copilot, OpenAI Search, and TikTok keep eating into user time.
§09Sources, Limitations & Disclosures
Primary source:
Alphabet Inc. Form 10-Q (quarter ended June 30, 2026; filed with the SEC on July 23, 2026; available on EDGAR): consolidated statements of income / balance sheet / cash flows; revenue by segment (Google Services, Google Cloud, Other Bets); recent events.
Market data:
Price, market cap, 52-week range, analyst price targets and rating distribution: NeoData (GOOGL, July 23, 2026 close) — spot $317.69, market cap $3,885B, 52-week range $187.28–$408.36, consensus target $430.76 (62 firms, range $340–$550); latest rating mix (July 2026): Buy/Overweight 89% · Hold 11% · Underweight/Sell 0%. Quarterly cash flow (Q1/Q2'26 operating cash flow, capex, free cash flow): NeoData cash-flow data, cross-validated against the 10-Q 6-month totals.
One-time gain attribution:
Alphabet's Q2 2026 10-Q recognizes ~$99B of unrealized gains on equity securities (primarily fair-value changes in non-marketable investments such as SpaceX; see 10-Q Notes). We assume a 21% federal tax rate to estimate the after-tax effect and reconstruct the operating earnings view.
Limitations:
Chart 1 uses real price anchors rather than a weekly price curve (no verifiable OHLC series; we do not draw illustrative price charts). Operating income and margin are taken directly from the 10-Q. Reported net income is distorted by the ~$99B one-time unrealized equity gain; the ex-gain net income/EPS/margin figures are the author's estimates (21% federal tax assumed). Alphabet does not issue quantitative revenue or profit guidance, so no guidance figures are listed and forward EPS relies on analyst consensus. USD-denominated; no ADR FX risk. Fields without a public source (Beta, institutional ownership, option IV, insider transactions) were not fabricated. This report is not investment advice.