Broadcom Inc.NASDAQ:AVGO
Published 2026-09-03, with market data as of the 2026-09-02 close. Financials are sourced from Broadcom's FY2026 Q3 report (ended 2026-08-02, issued after close 2026-09-02), the SEC 10-Q (FQ2'26, ended 2026-05-03) and public IR.
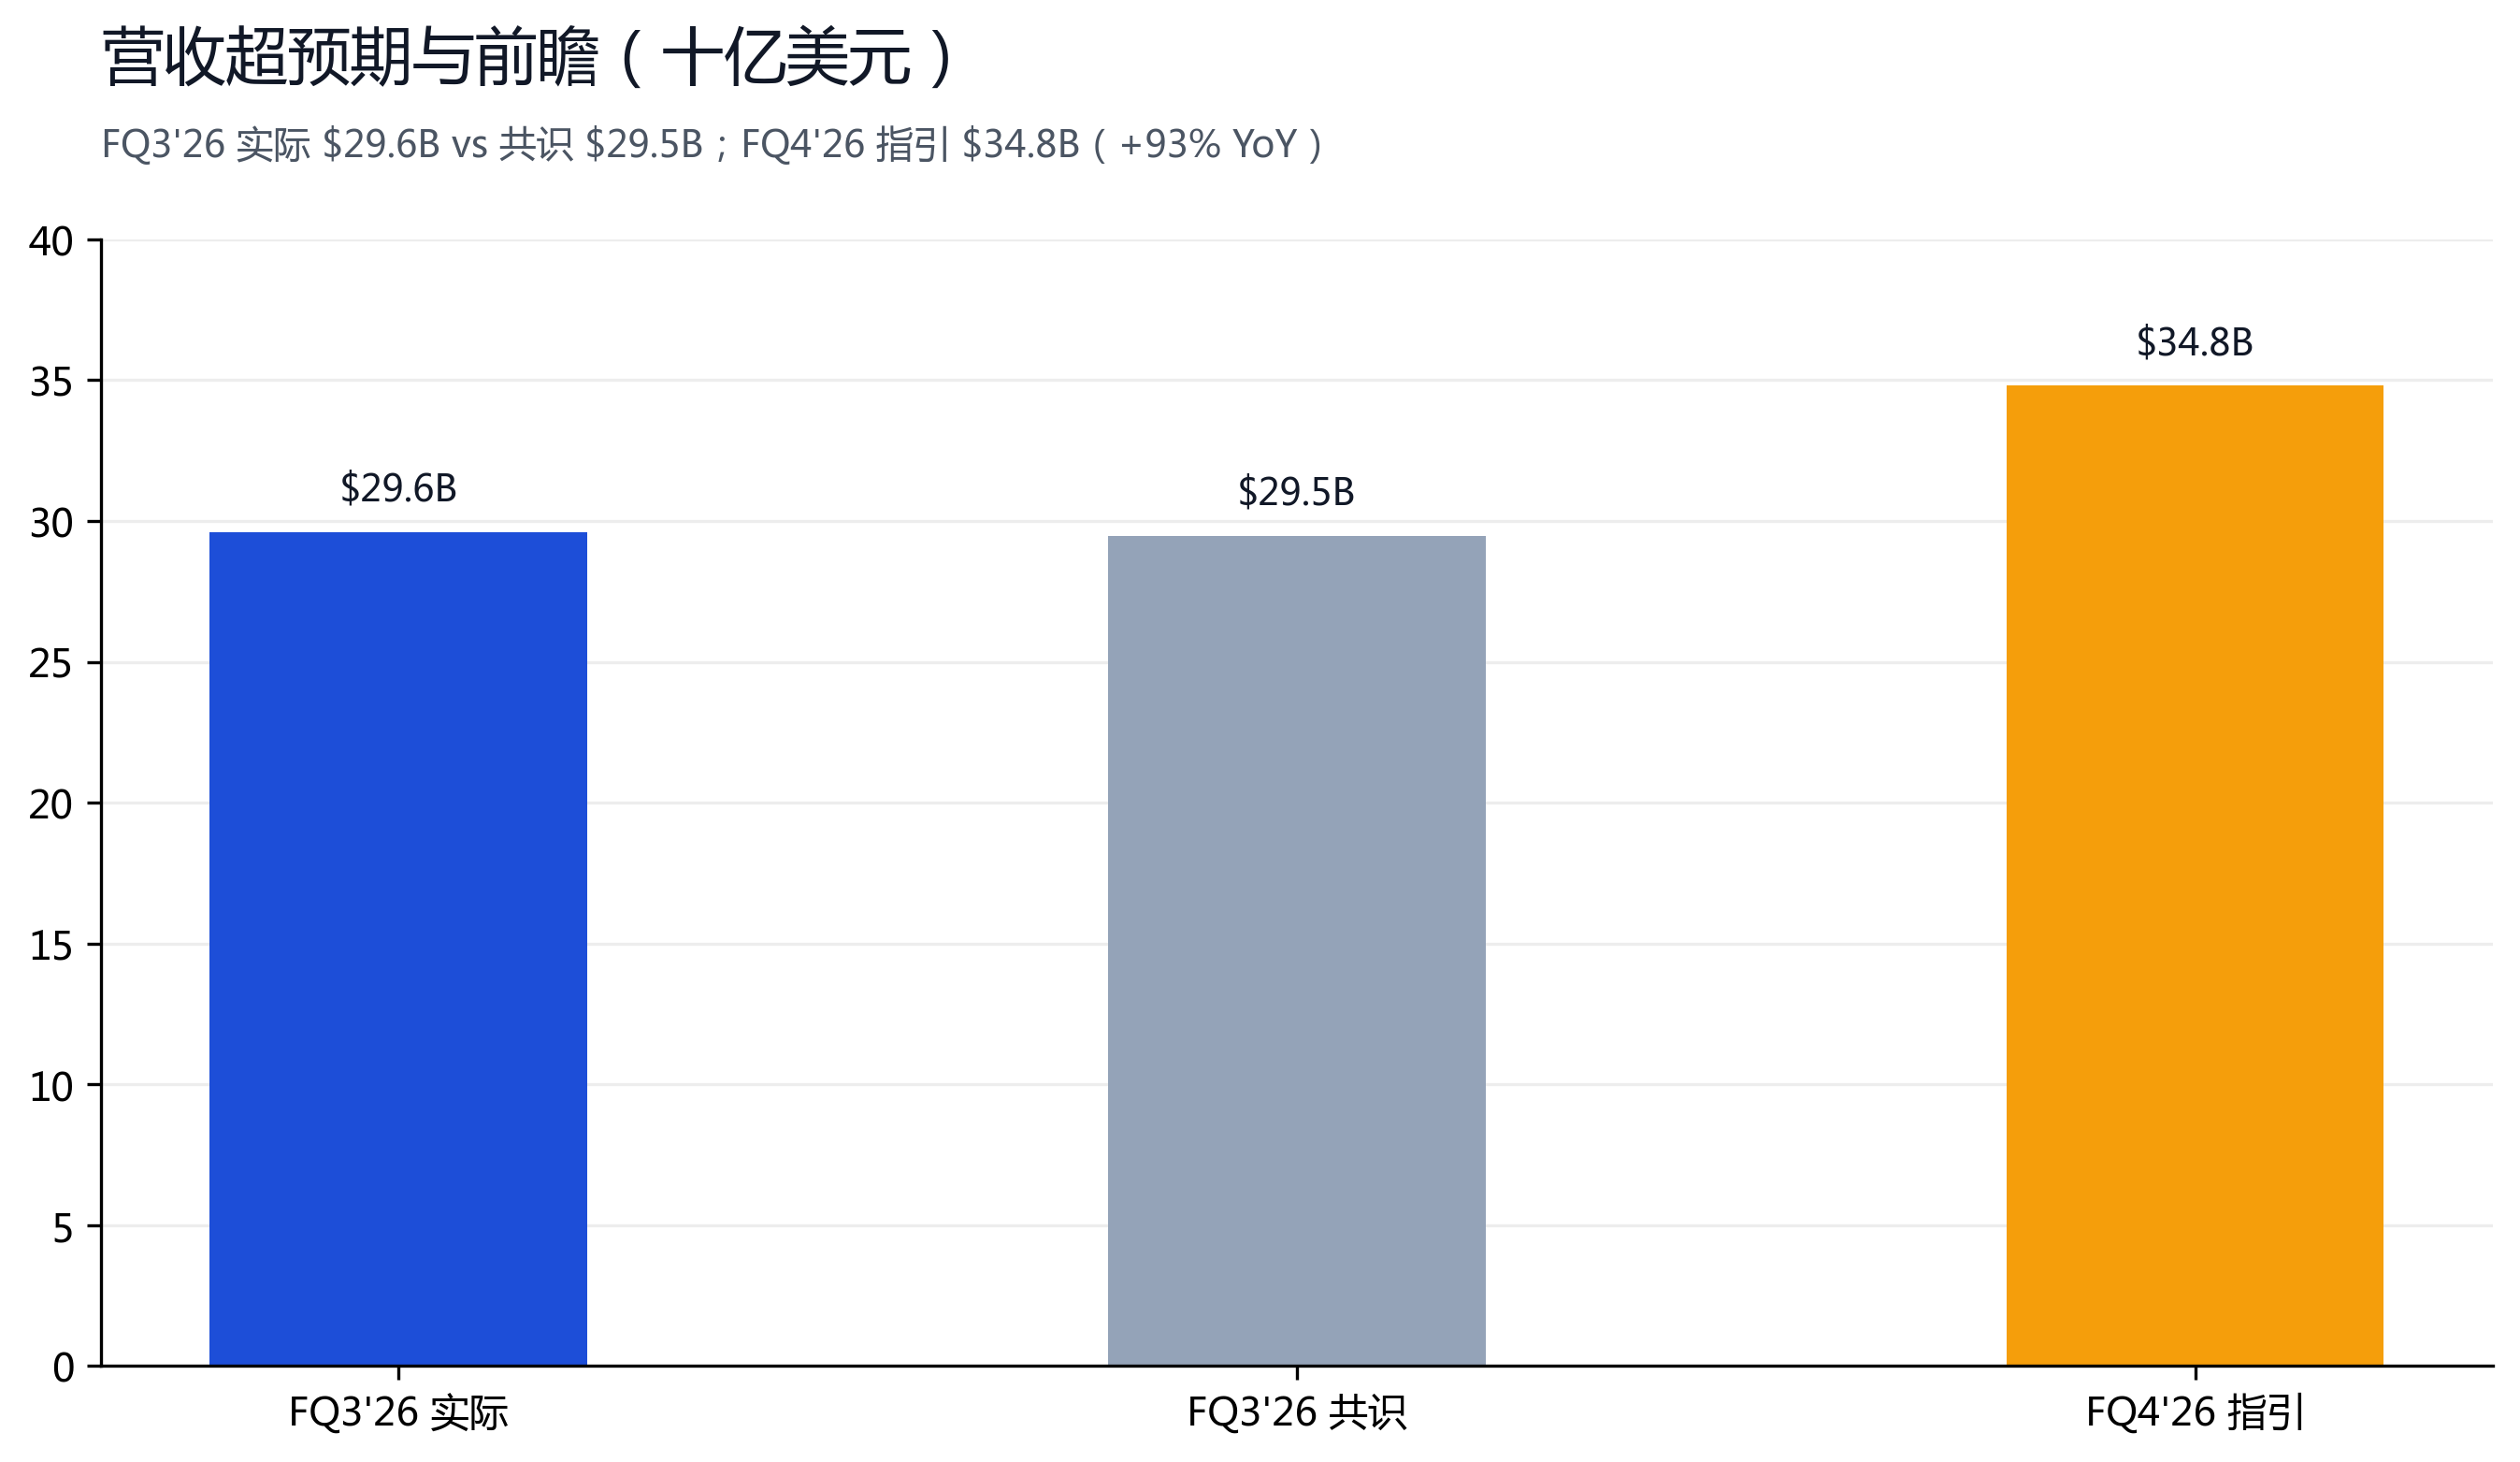
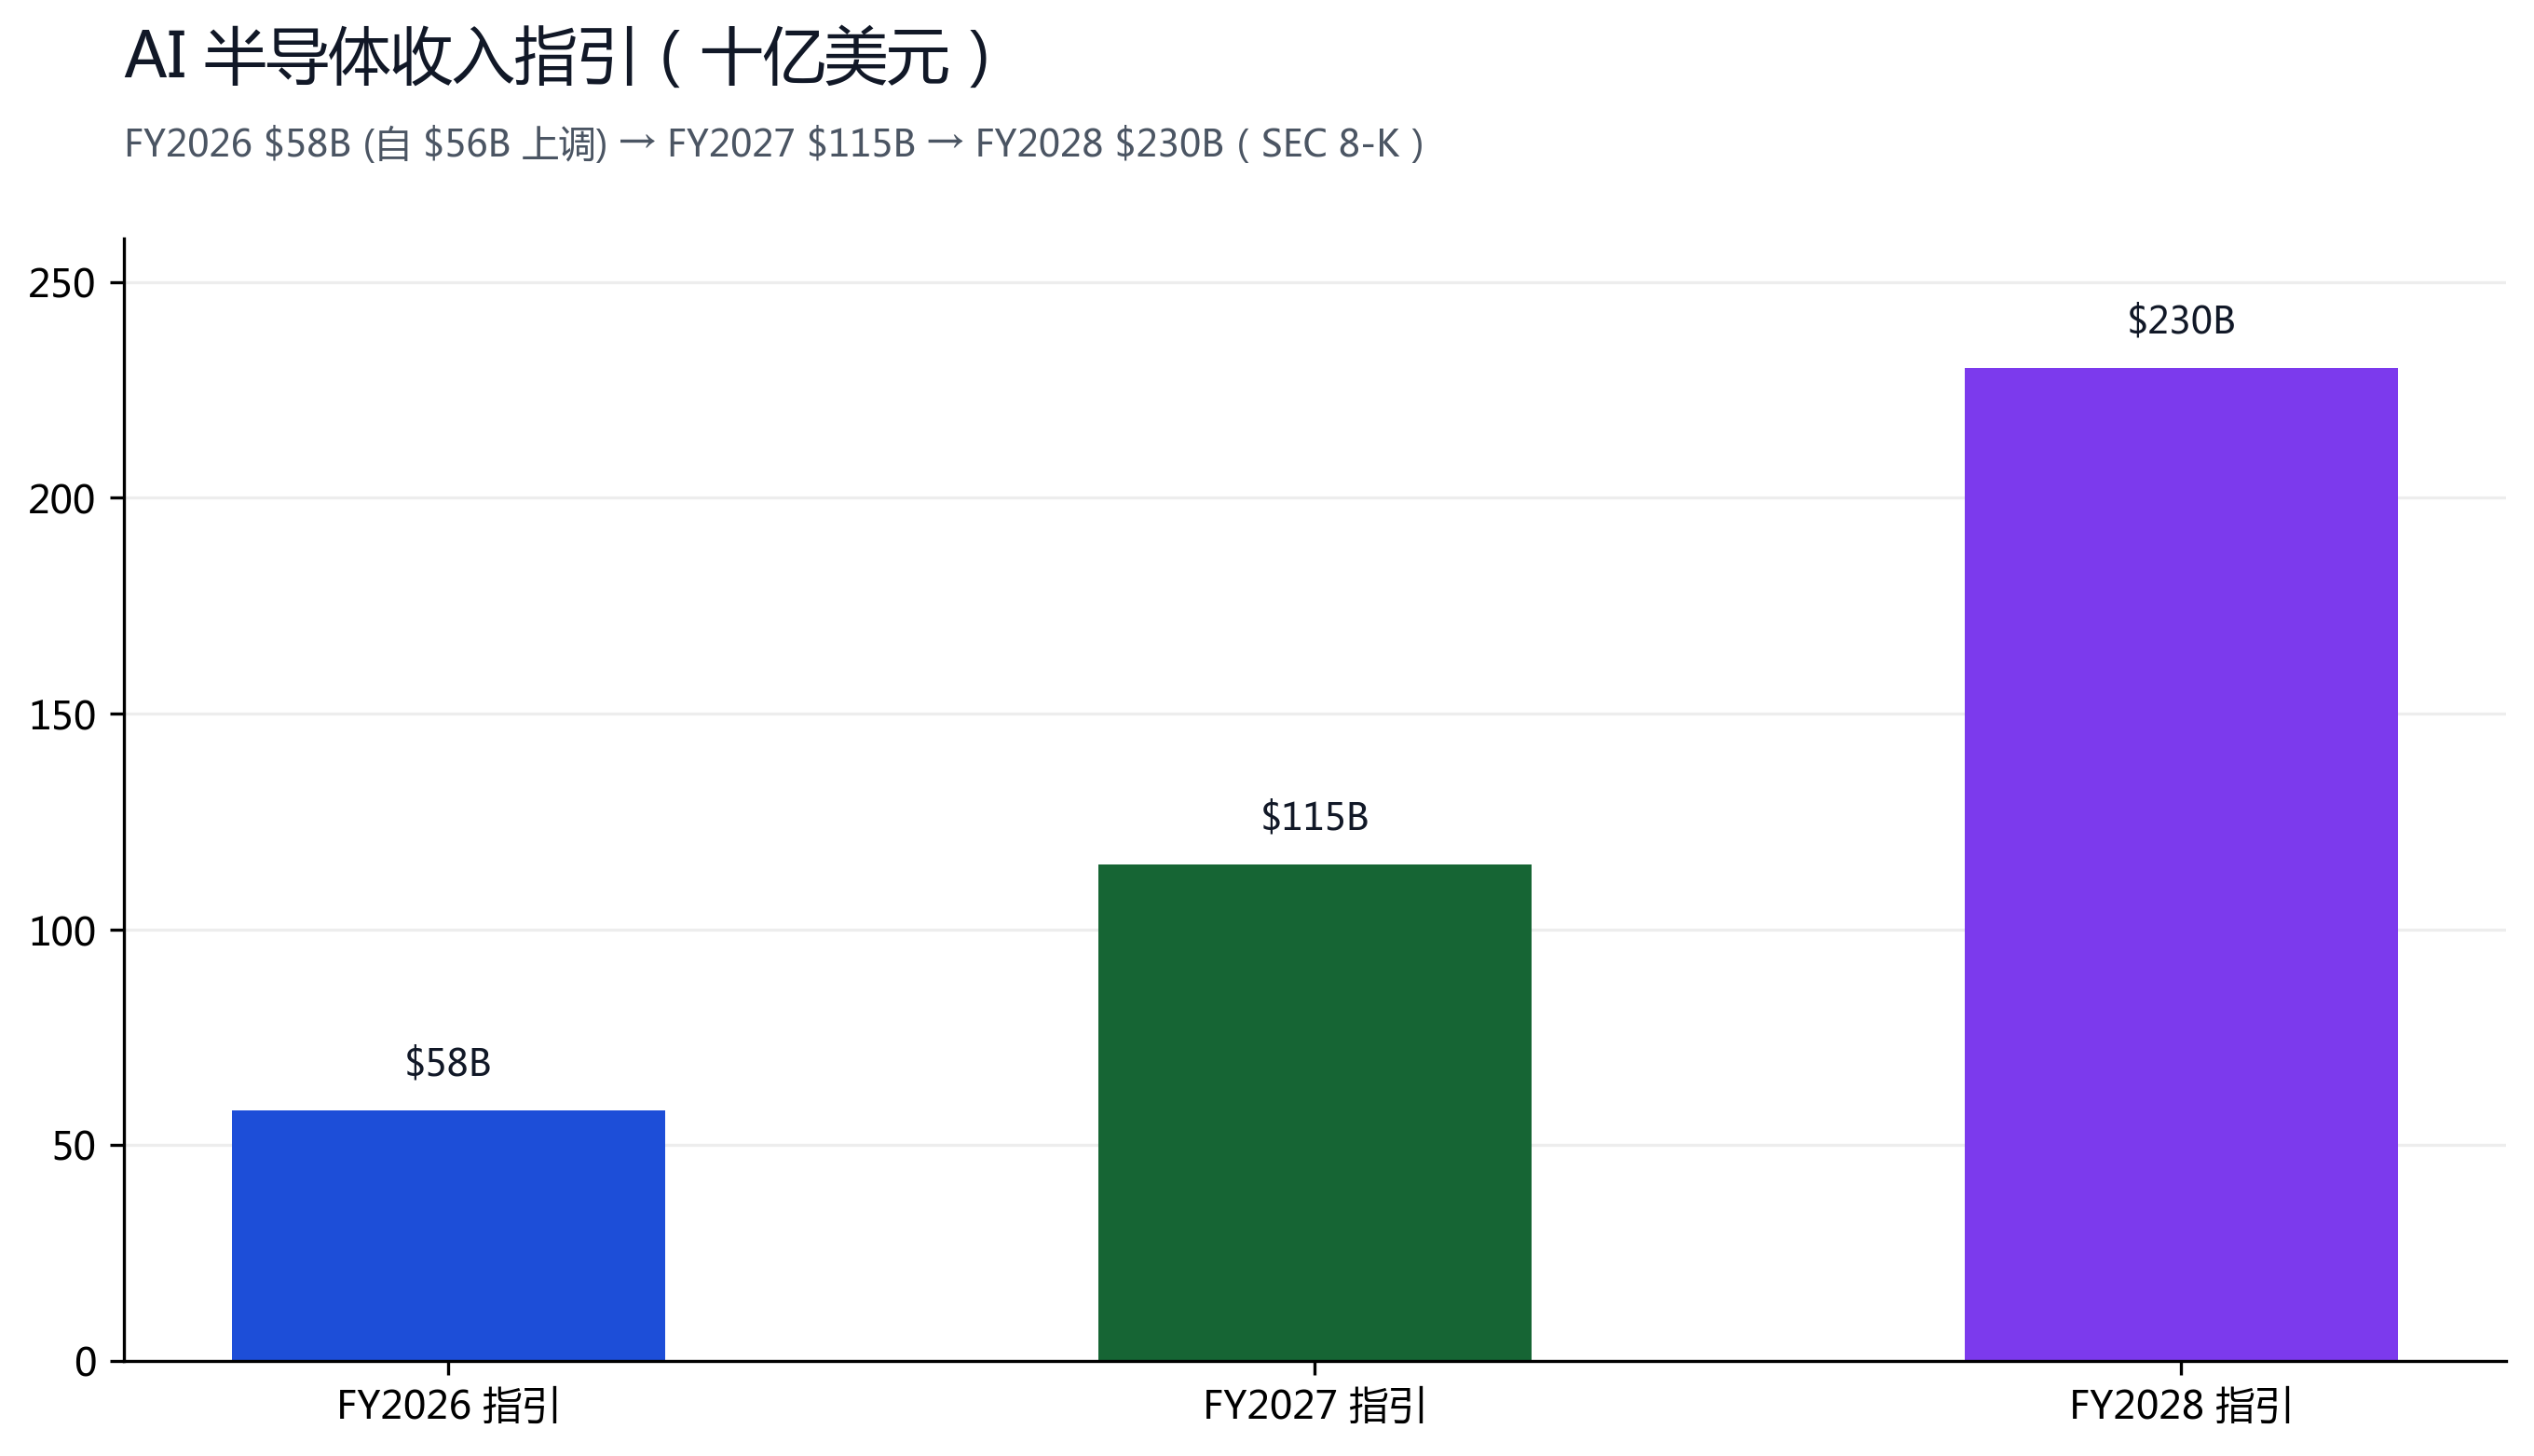
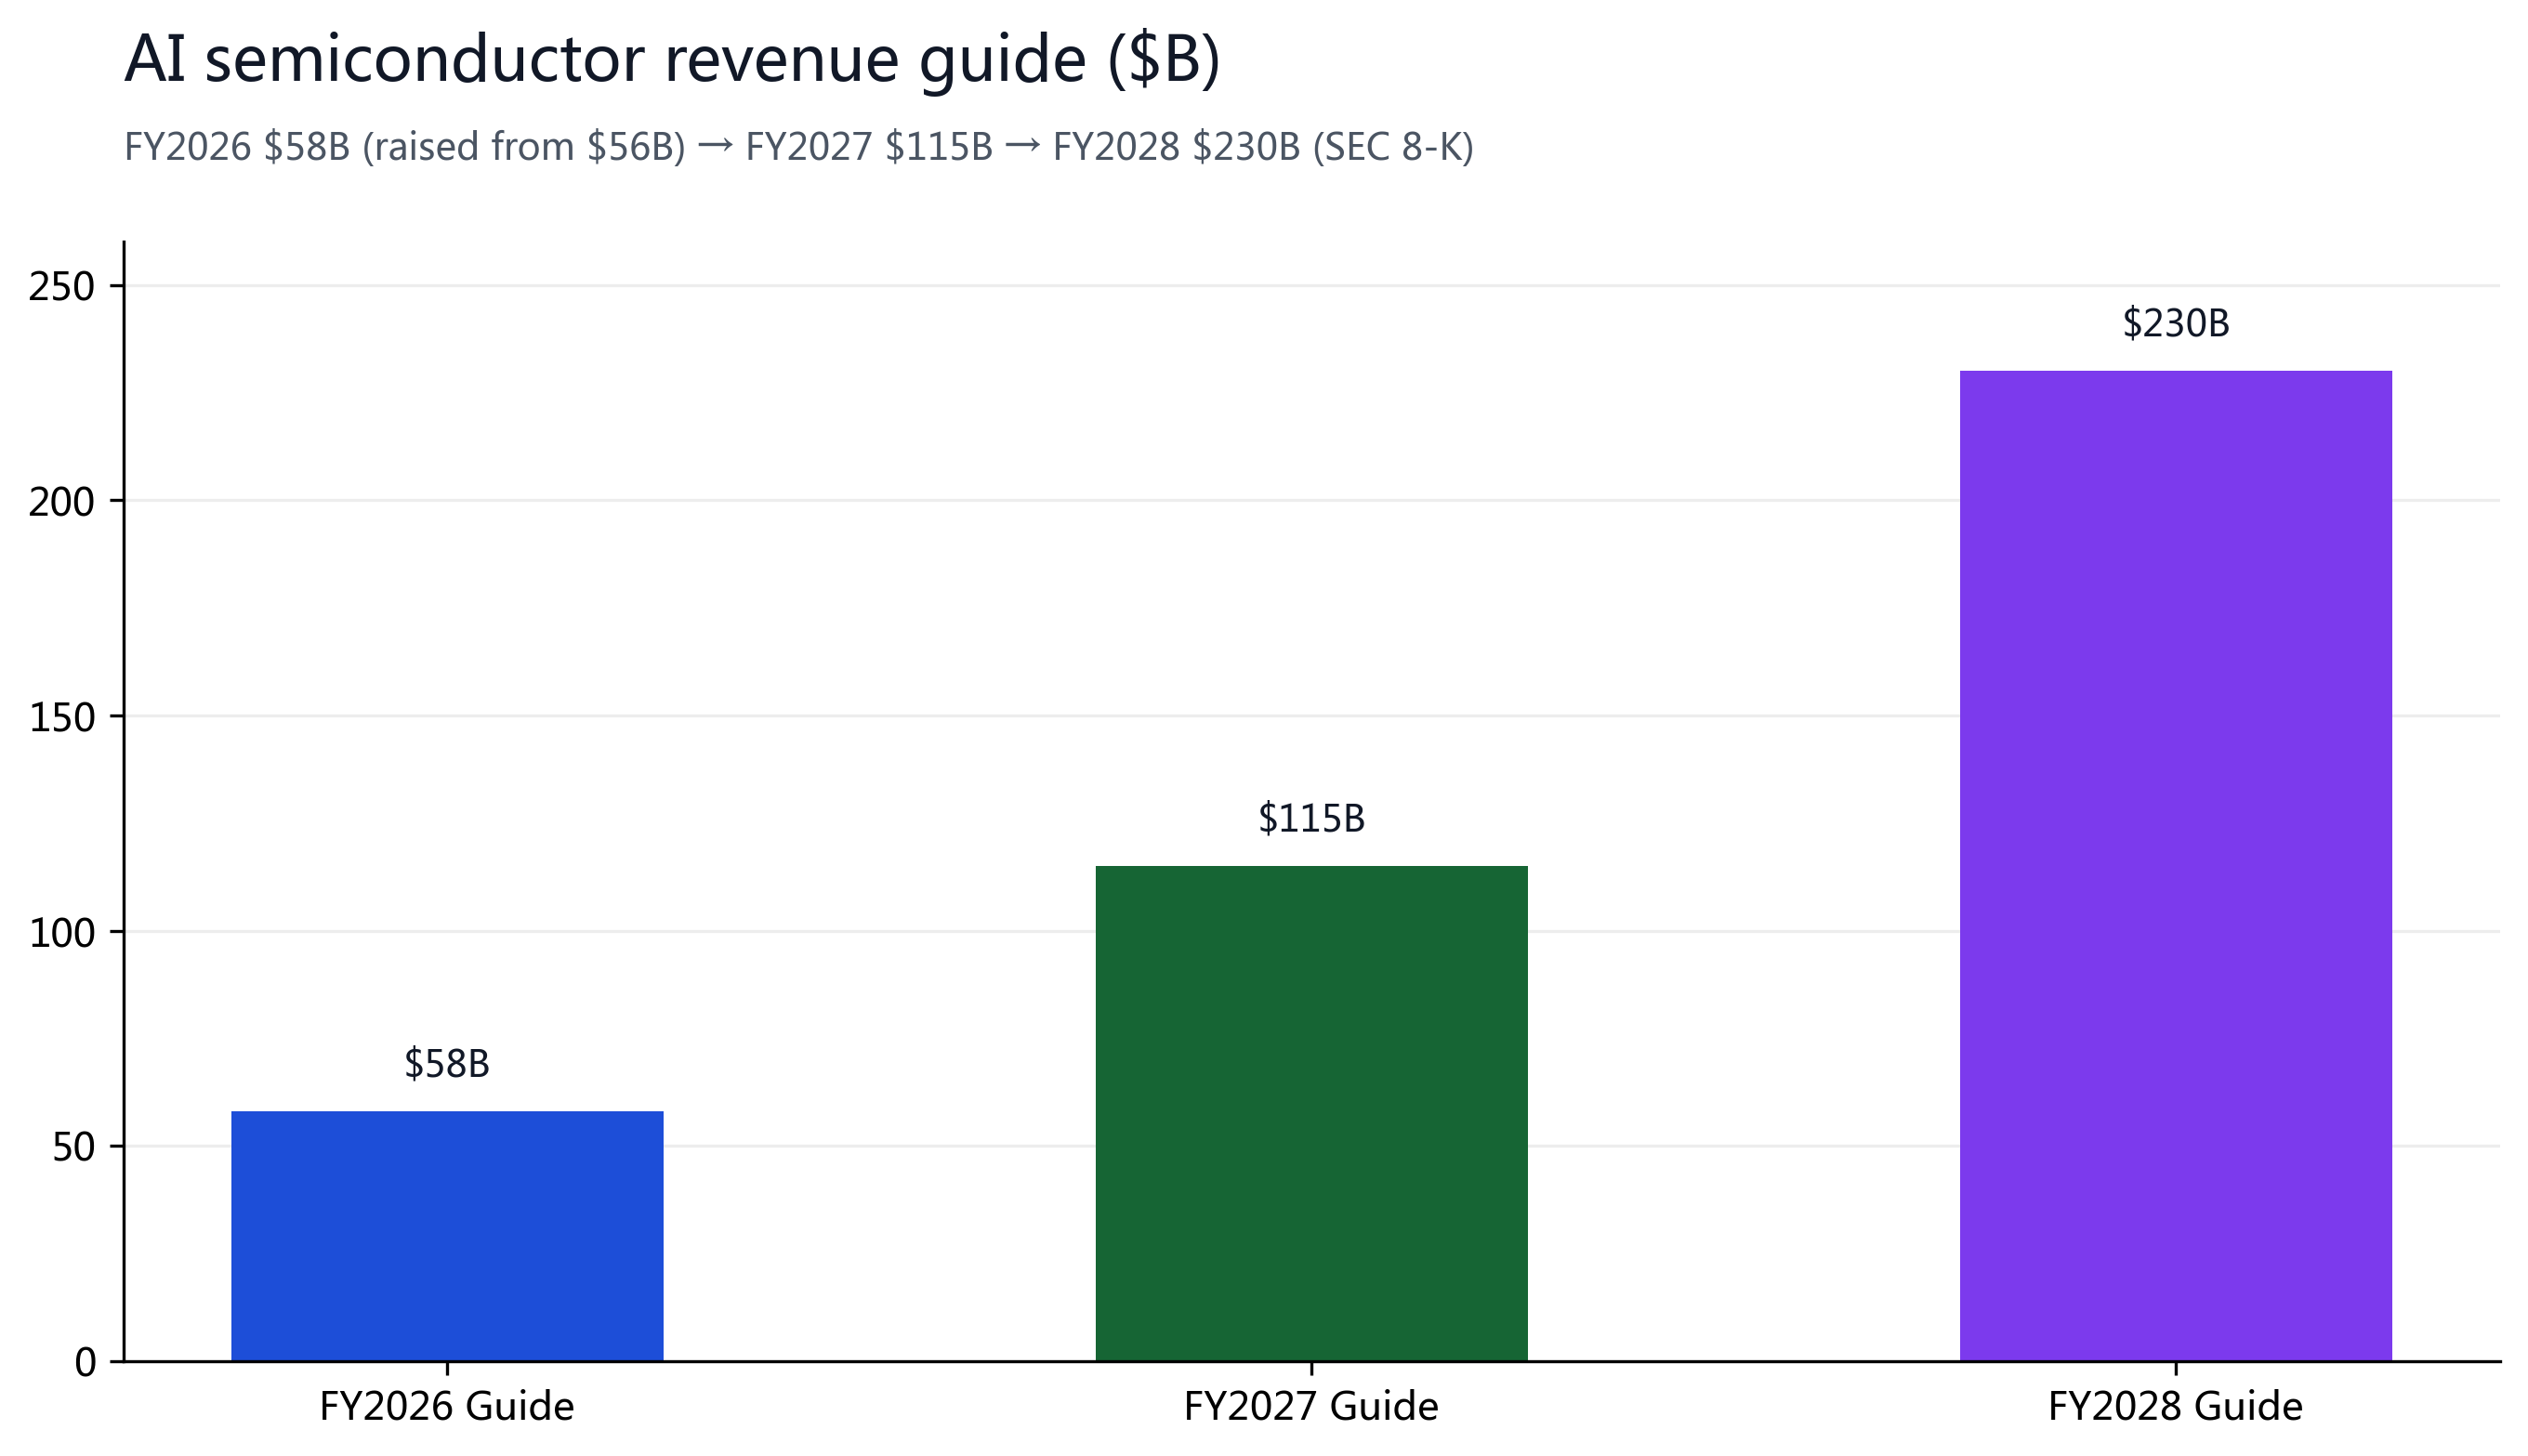
Broadcom reaffirmed its 'picks-and-shovels' status in AI infrastructure with an FQ3'26 report of AI semi revenue +221% YoY and rising custom-chip customer concentration: revenue $29.59B (+86% YoY, beating by +$0.12B), non-GAAP gross margin 74.0%, GAAP EPS $2.68 (non-GAAP $3.32), free cash flow $13.67B (46% conversion), cash $24.0B. FQ4'26 guide revenue $34.8B (+93% YoY), AI semi $21.7B (+236%); AI semi revenue guide raised to FY2026 $58B / FY2027 $115B / FY2028 $230B. Semiconductor solutions (AI networking + custom compute) are now 70% of revenue — the growth engine.
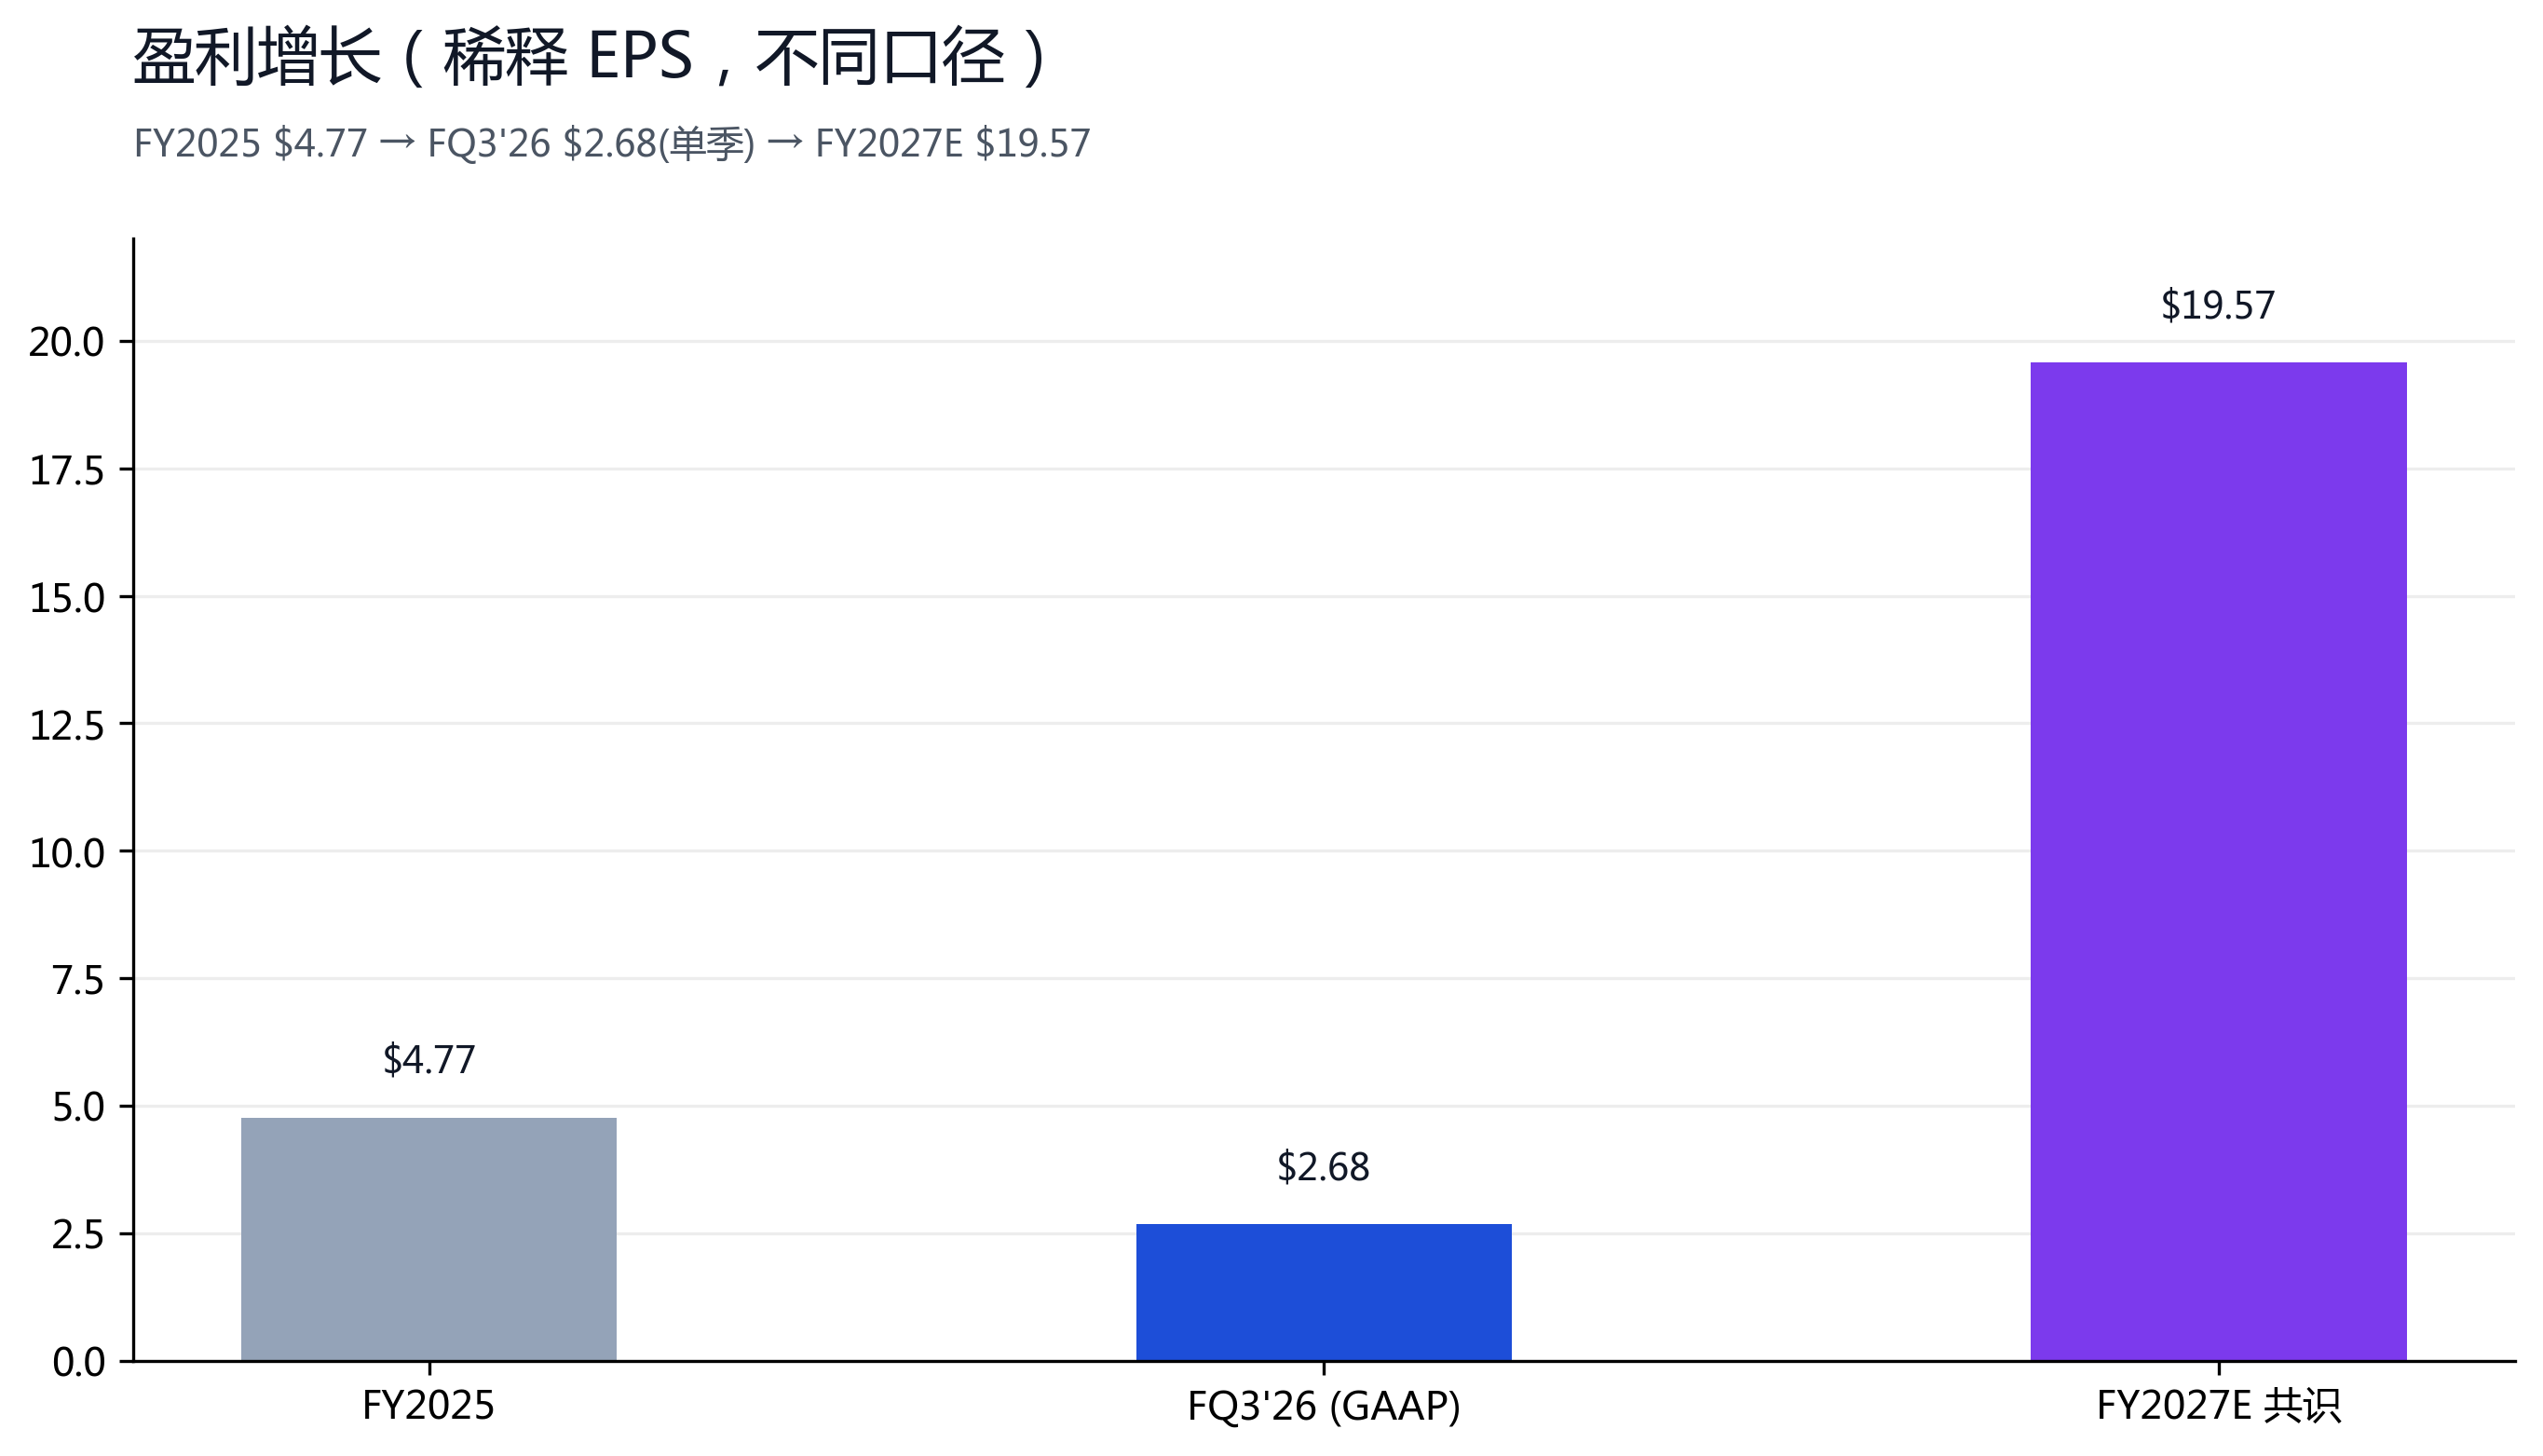
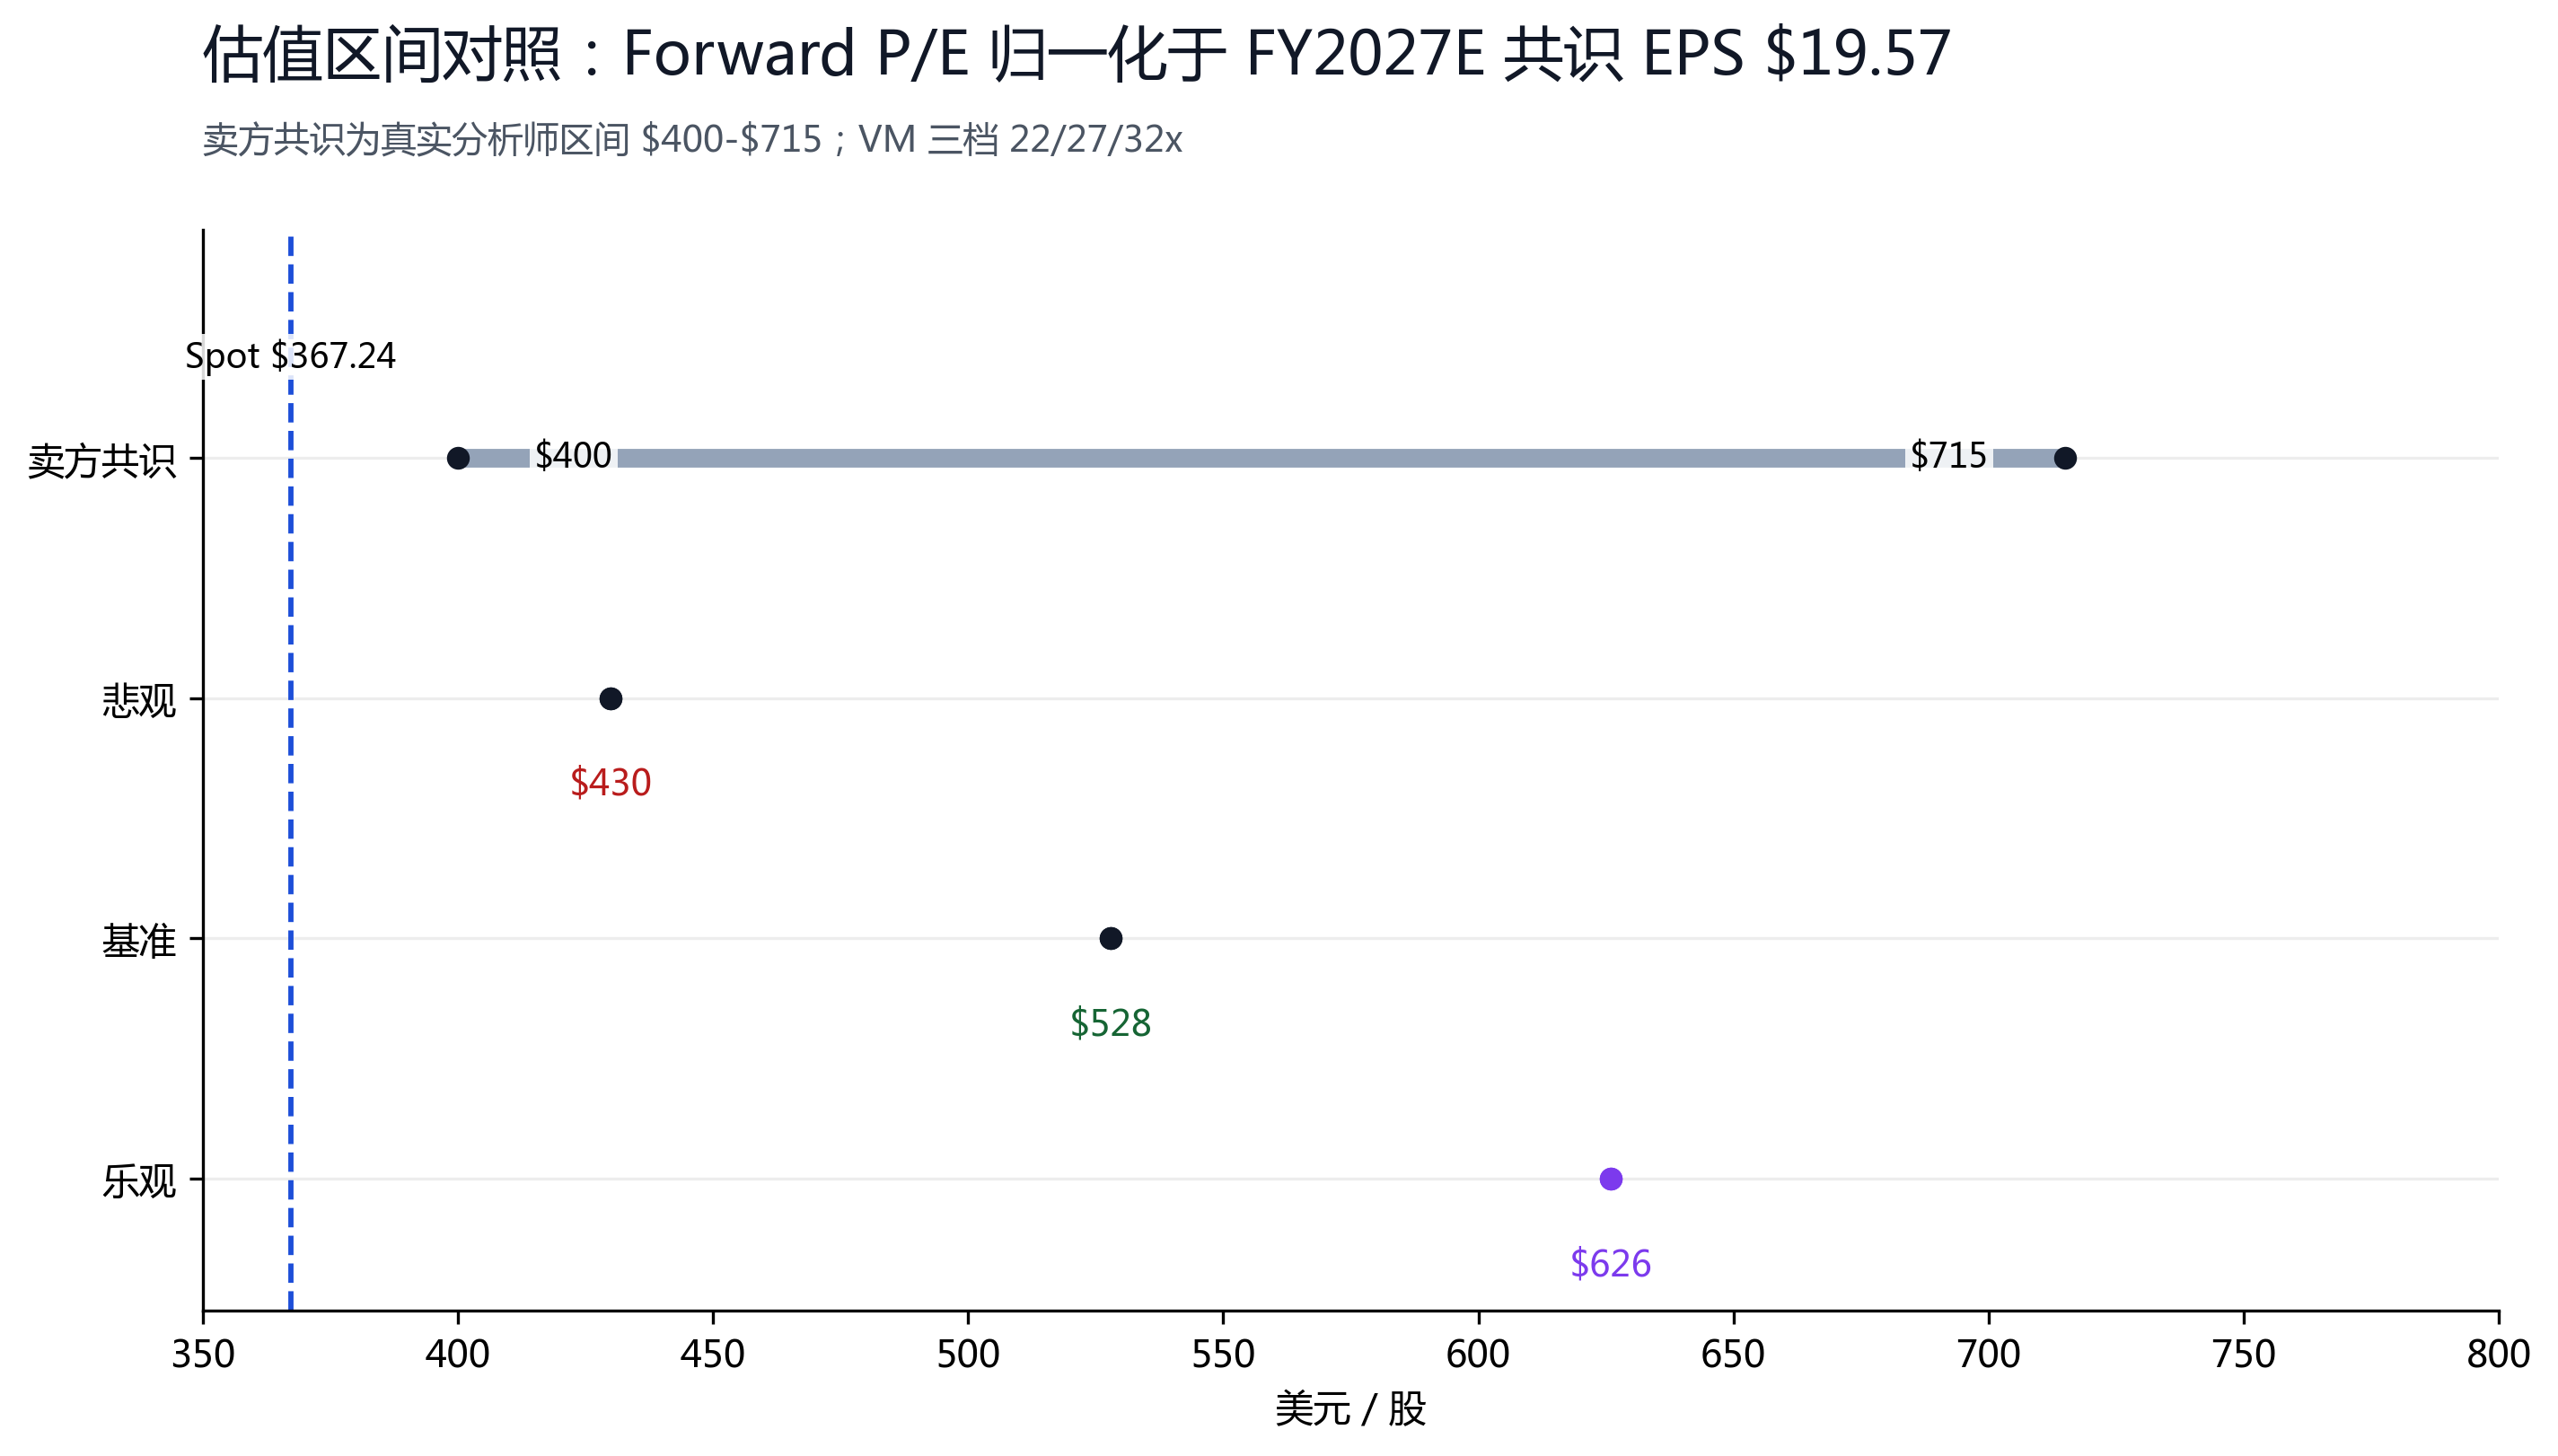
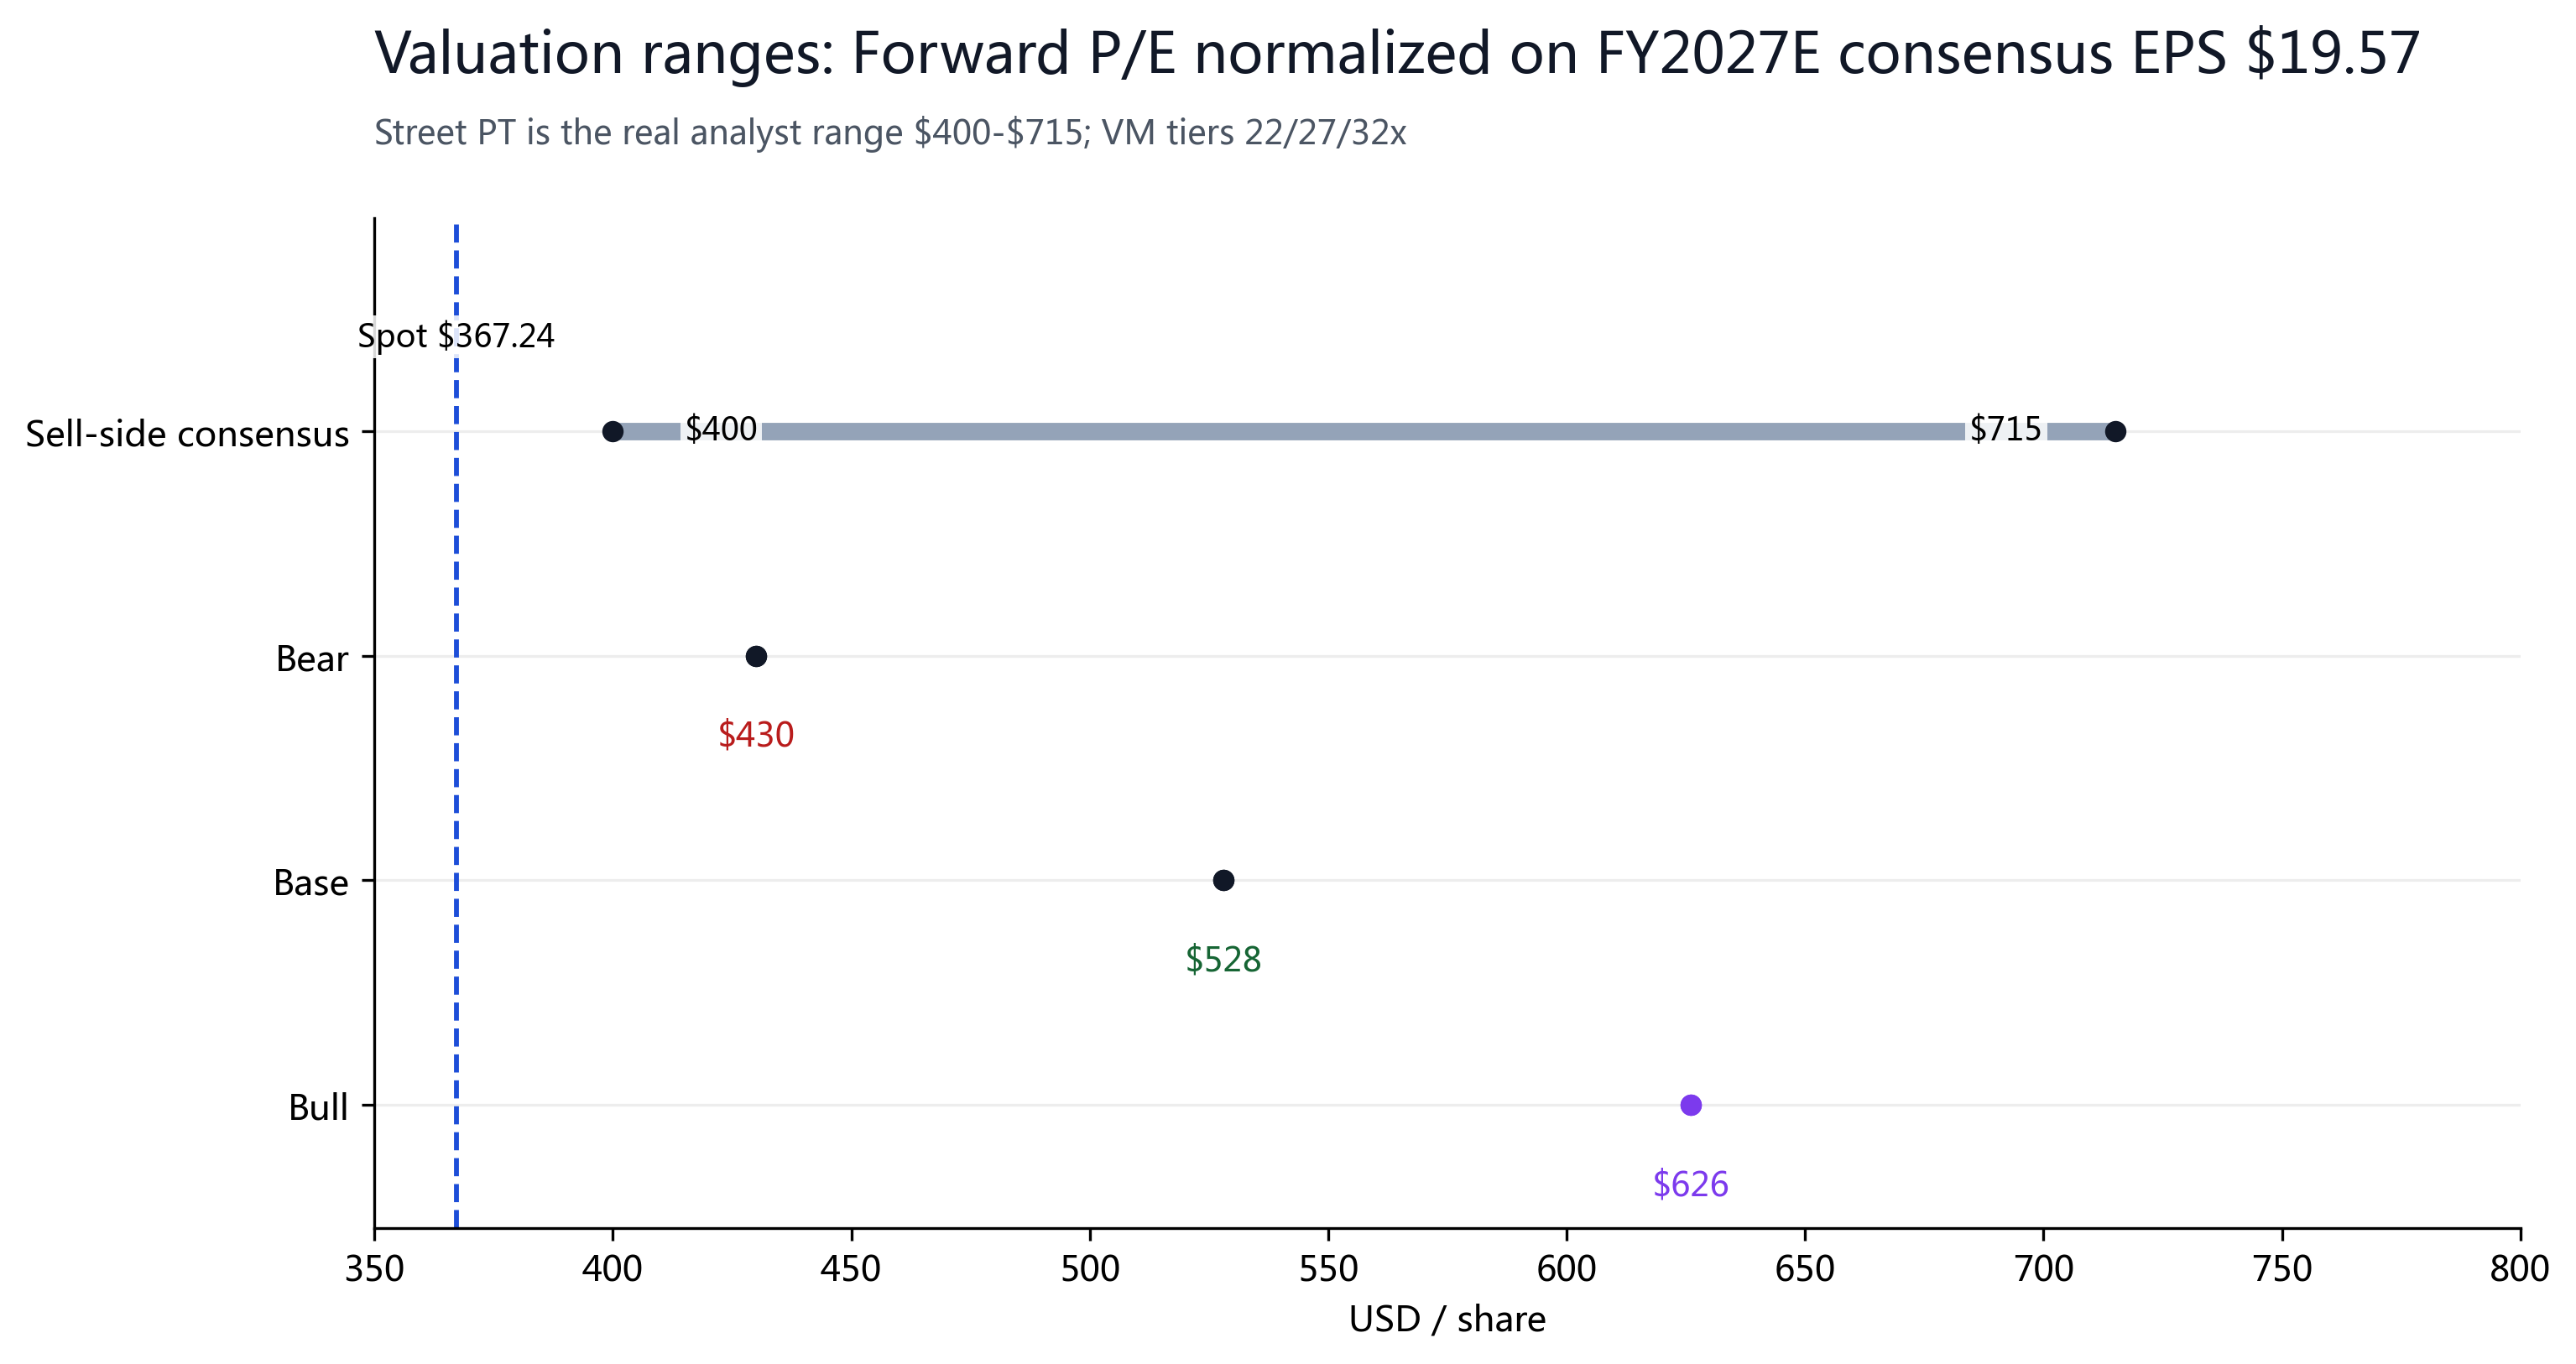
But the stock trades at only about 18.8x FY2027E consensus EPS ($19.57) — a 31% discount to the $535.25 Street average, reflecting worry over 'custom AI semi customer concentration (3 hyperscalers) + the semi cycle'. We believe this cycle is structural via AI networking (Tomahawk/TH) and custom compute (multi-year contracts with 3 large customers), but concentration and cycle coexist. We rate it Buy with Strong conviction and a 12-month base target of $528 (+43.8% vs the $367.24 spot): normalized on FY2027E consensus EPS $19.57 with a Forward P/E of 22/27/32x; probability-weighted $533. At 18.8x FY27E the stock is still below its historical centroid and semi peers; the margin of safety comes from FY2028 AI revenue visibility of $230B.
§01Investment Summary
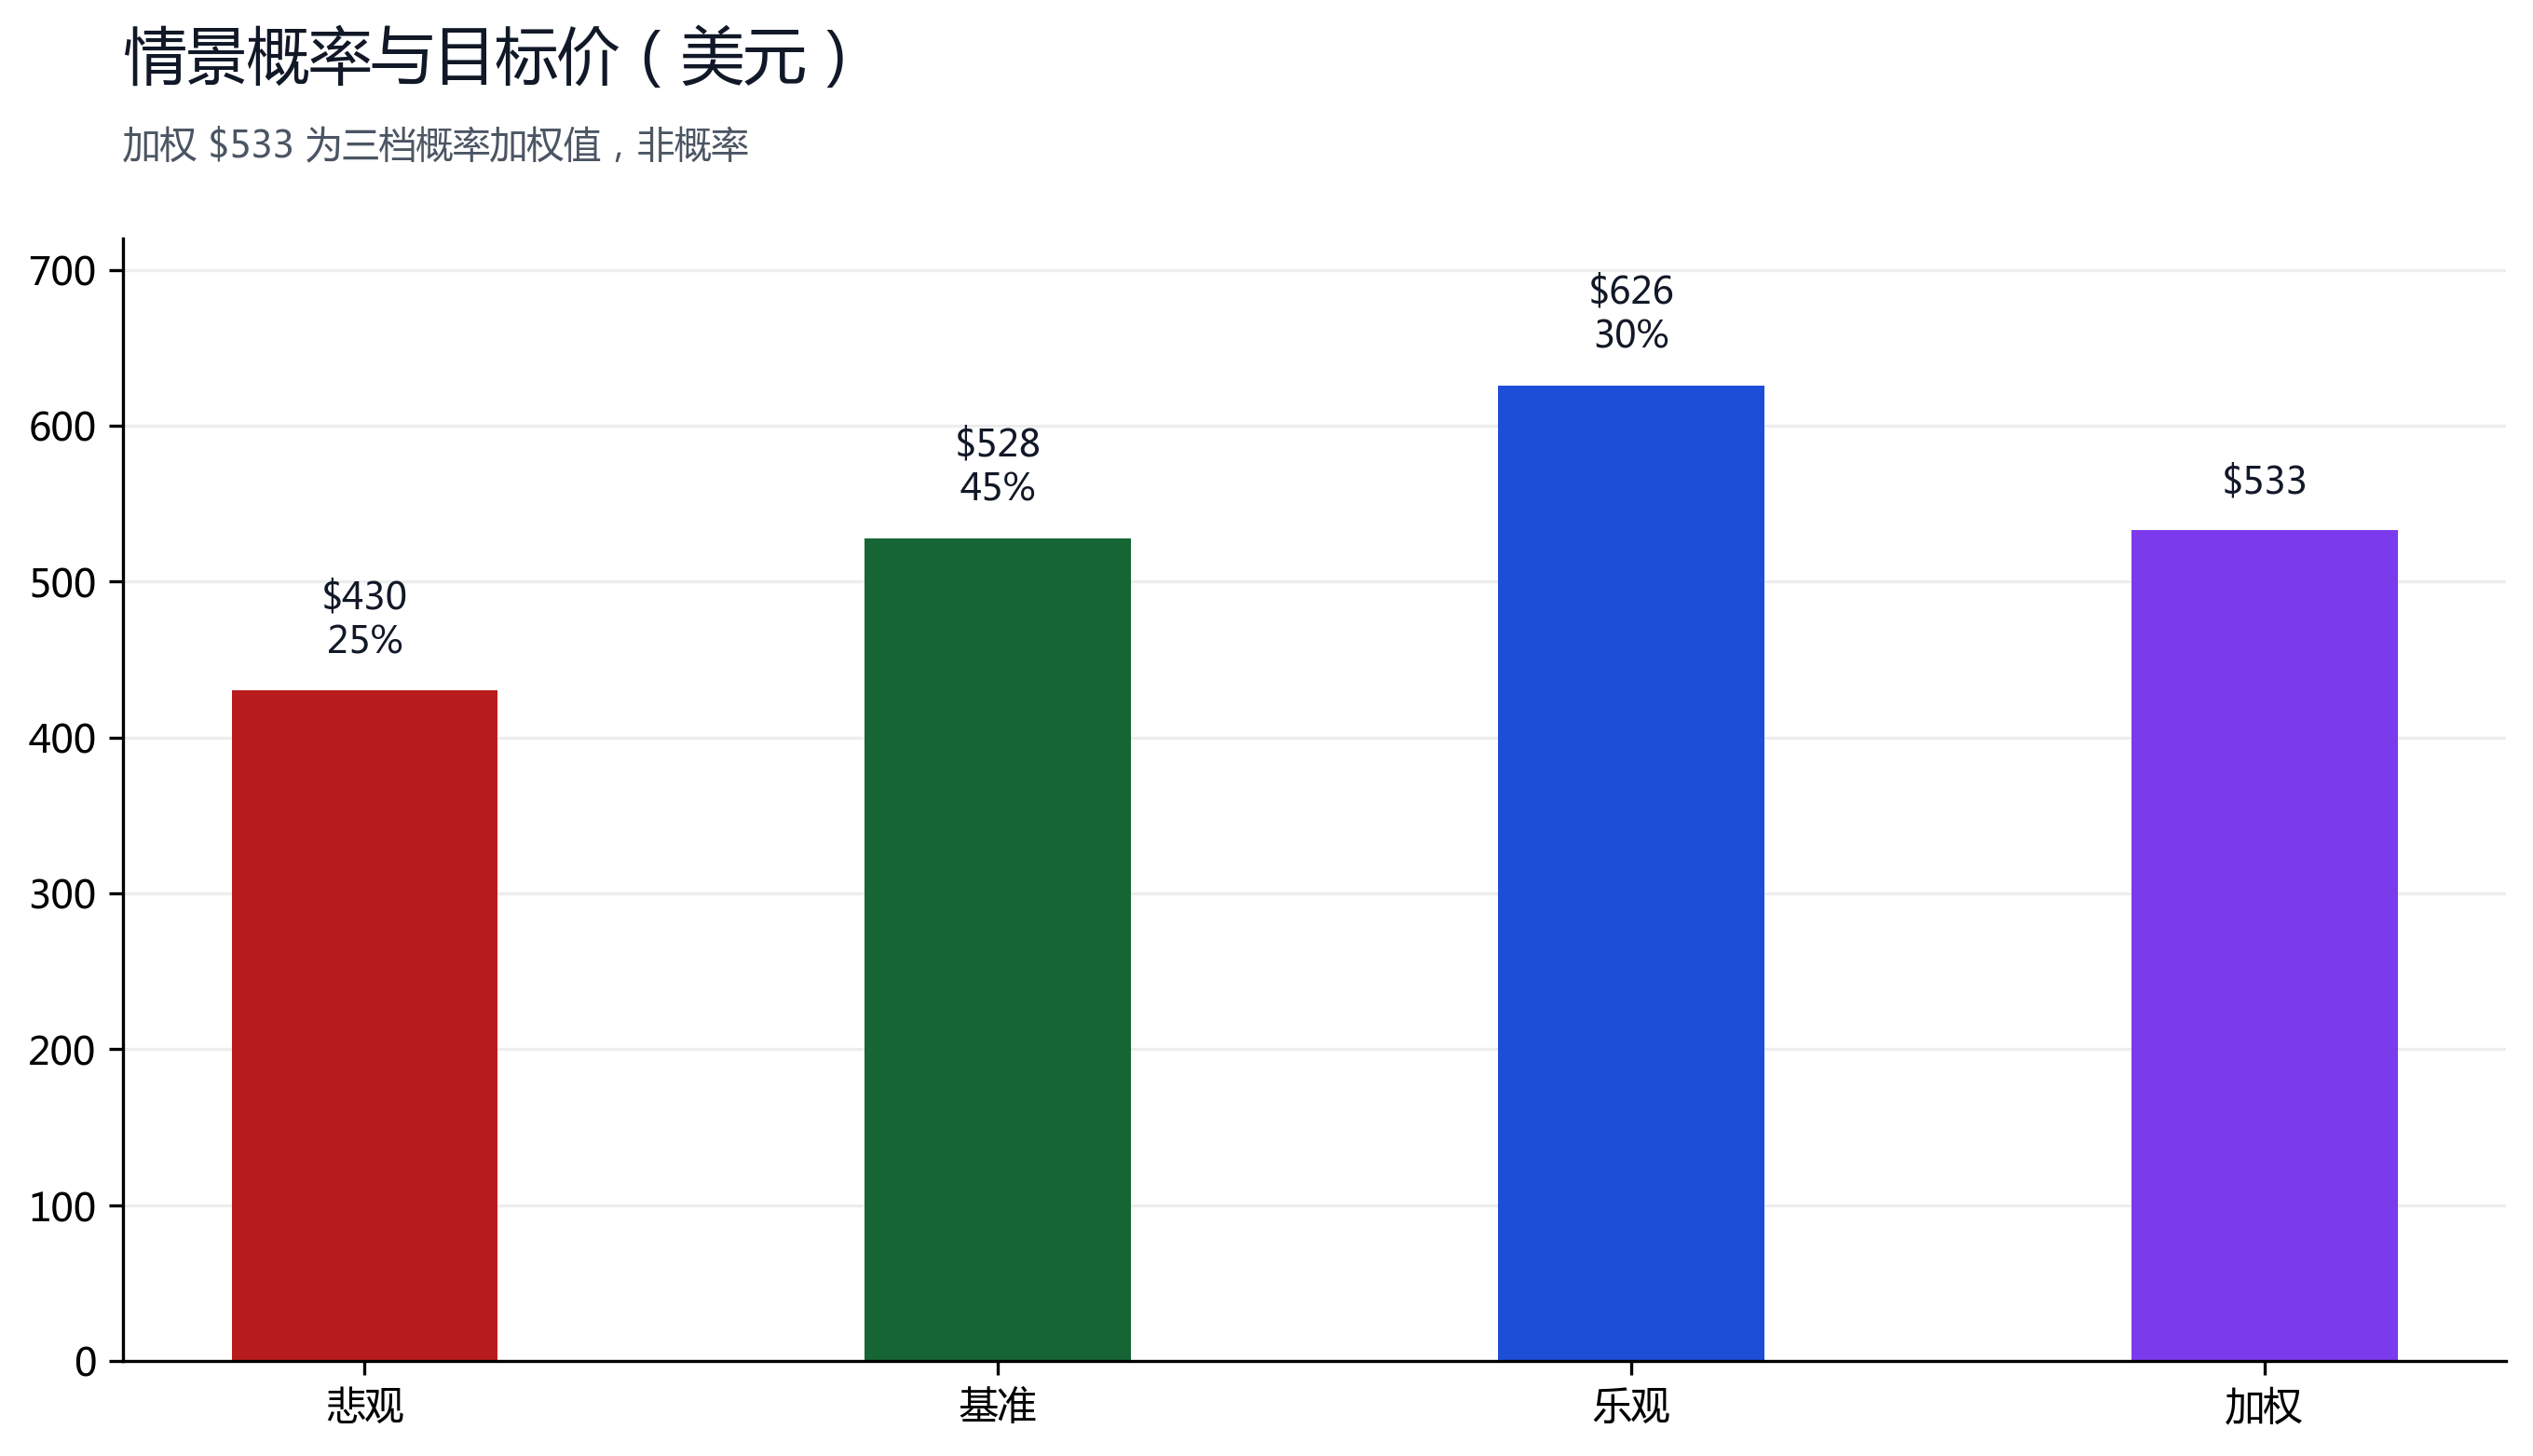
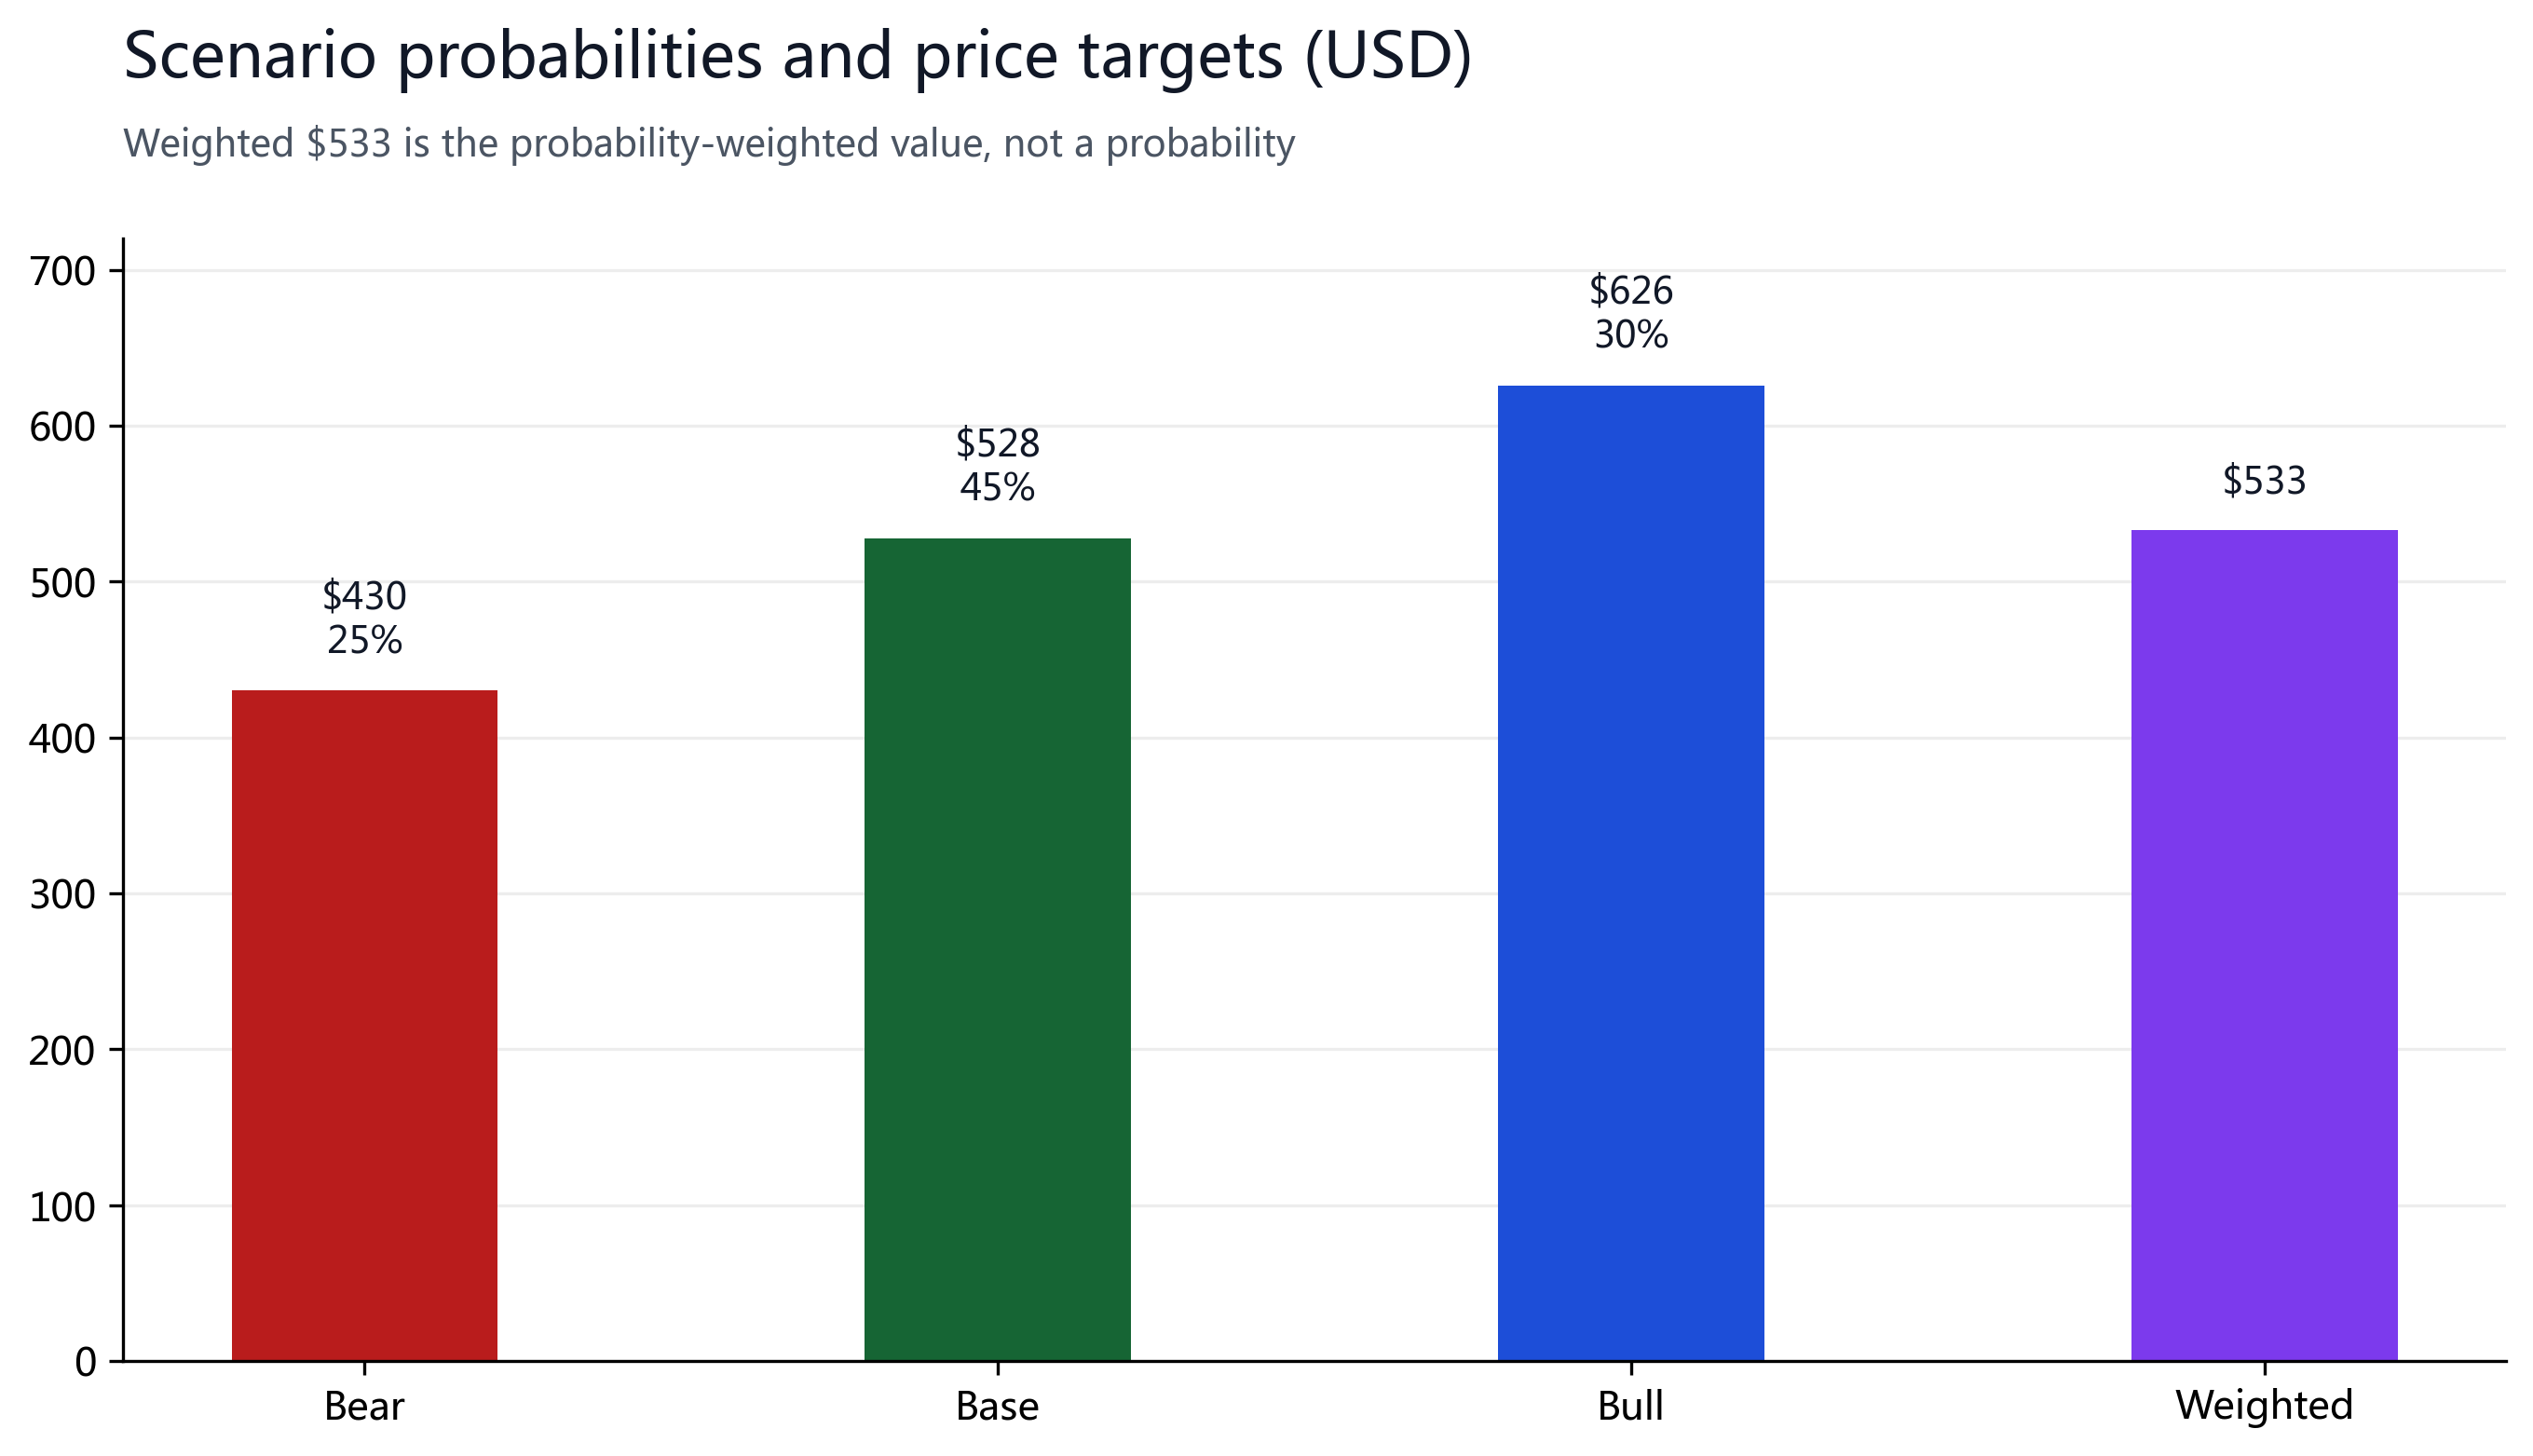
Broadcom's FY2026 Q3 report pushes the 'is AI infra just another cycle' debate further toward 'structural growth': revenue +86%, non-GAAP gross margin 74.0%, EPS $2.68 (GAAP) / $3.32 (non-GAAP) all beat, and AI semi revenue guide raised to FY2026 $58B / FY2027 $115B / FY2028 $230B. The stock trades at only 18.8x FY2027E consensus EPS ($19.57) as the market still prices 'custom-chip concentration + semi cycle'. We cross-check three Forward P/E scenarios (22/27/32x) on a normalized FY2027E EPS basis, arriving at a probability-weighted 12-month base target of $528 (+43.8%). Rating: Buy, Strong conviction. Formula: PT = FY2027E EPS $19.57 × Forward P/E (Bear 22x / Base 27x / Bull 32x) → $430 / $528 / $626; probabilities 25/45/30, weighted $533; base target $528.
Three key risks: (1) extreme custom-AI-semi customer concentration (3 hyperscalers are most of AI semi) — a single cut hits hard; (2) the market prices AVGO at only 18.8x FY27E, implying probability of a 2027-28 earnings roll-over / cycle; (3) insiders made 146 trades in 6 months — 1 buy / 145 sells (co-founder Henry Samueli 38 sales $500M, mostly 10b5-1 scheduled, but the zero-buy signal is weak). This is why our $528 base target sits near (not far above) the $535 consensus average — we apply a limited premium to the market's own logic, not pure AI euphoric pricing. Conviction mechanical rule: expected return +43.8% > 30% and base-scenario probability 45% ≥ 40% → Strong.
§02Price and Street View
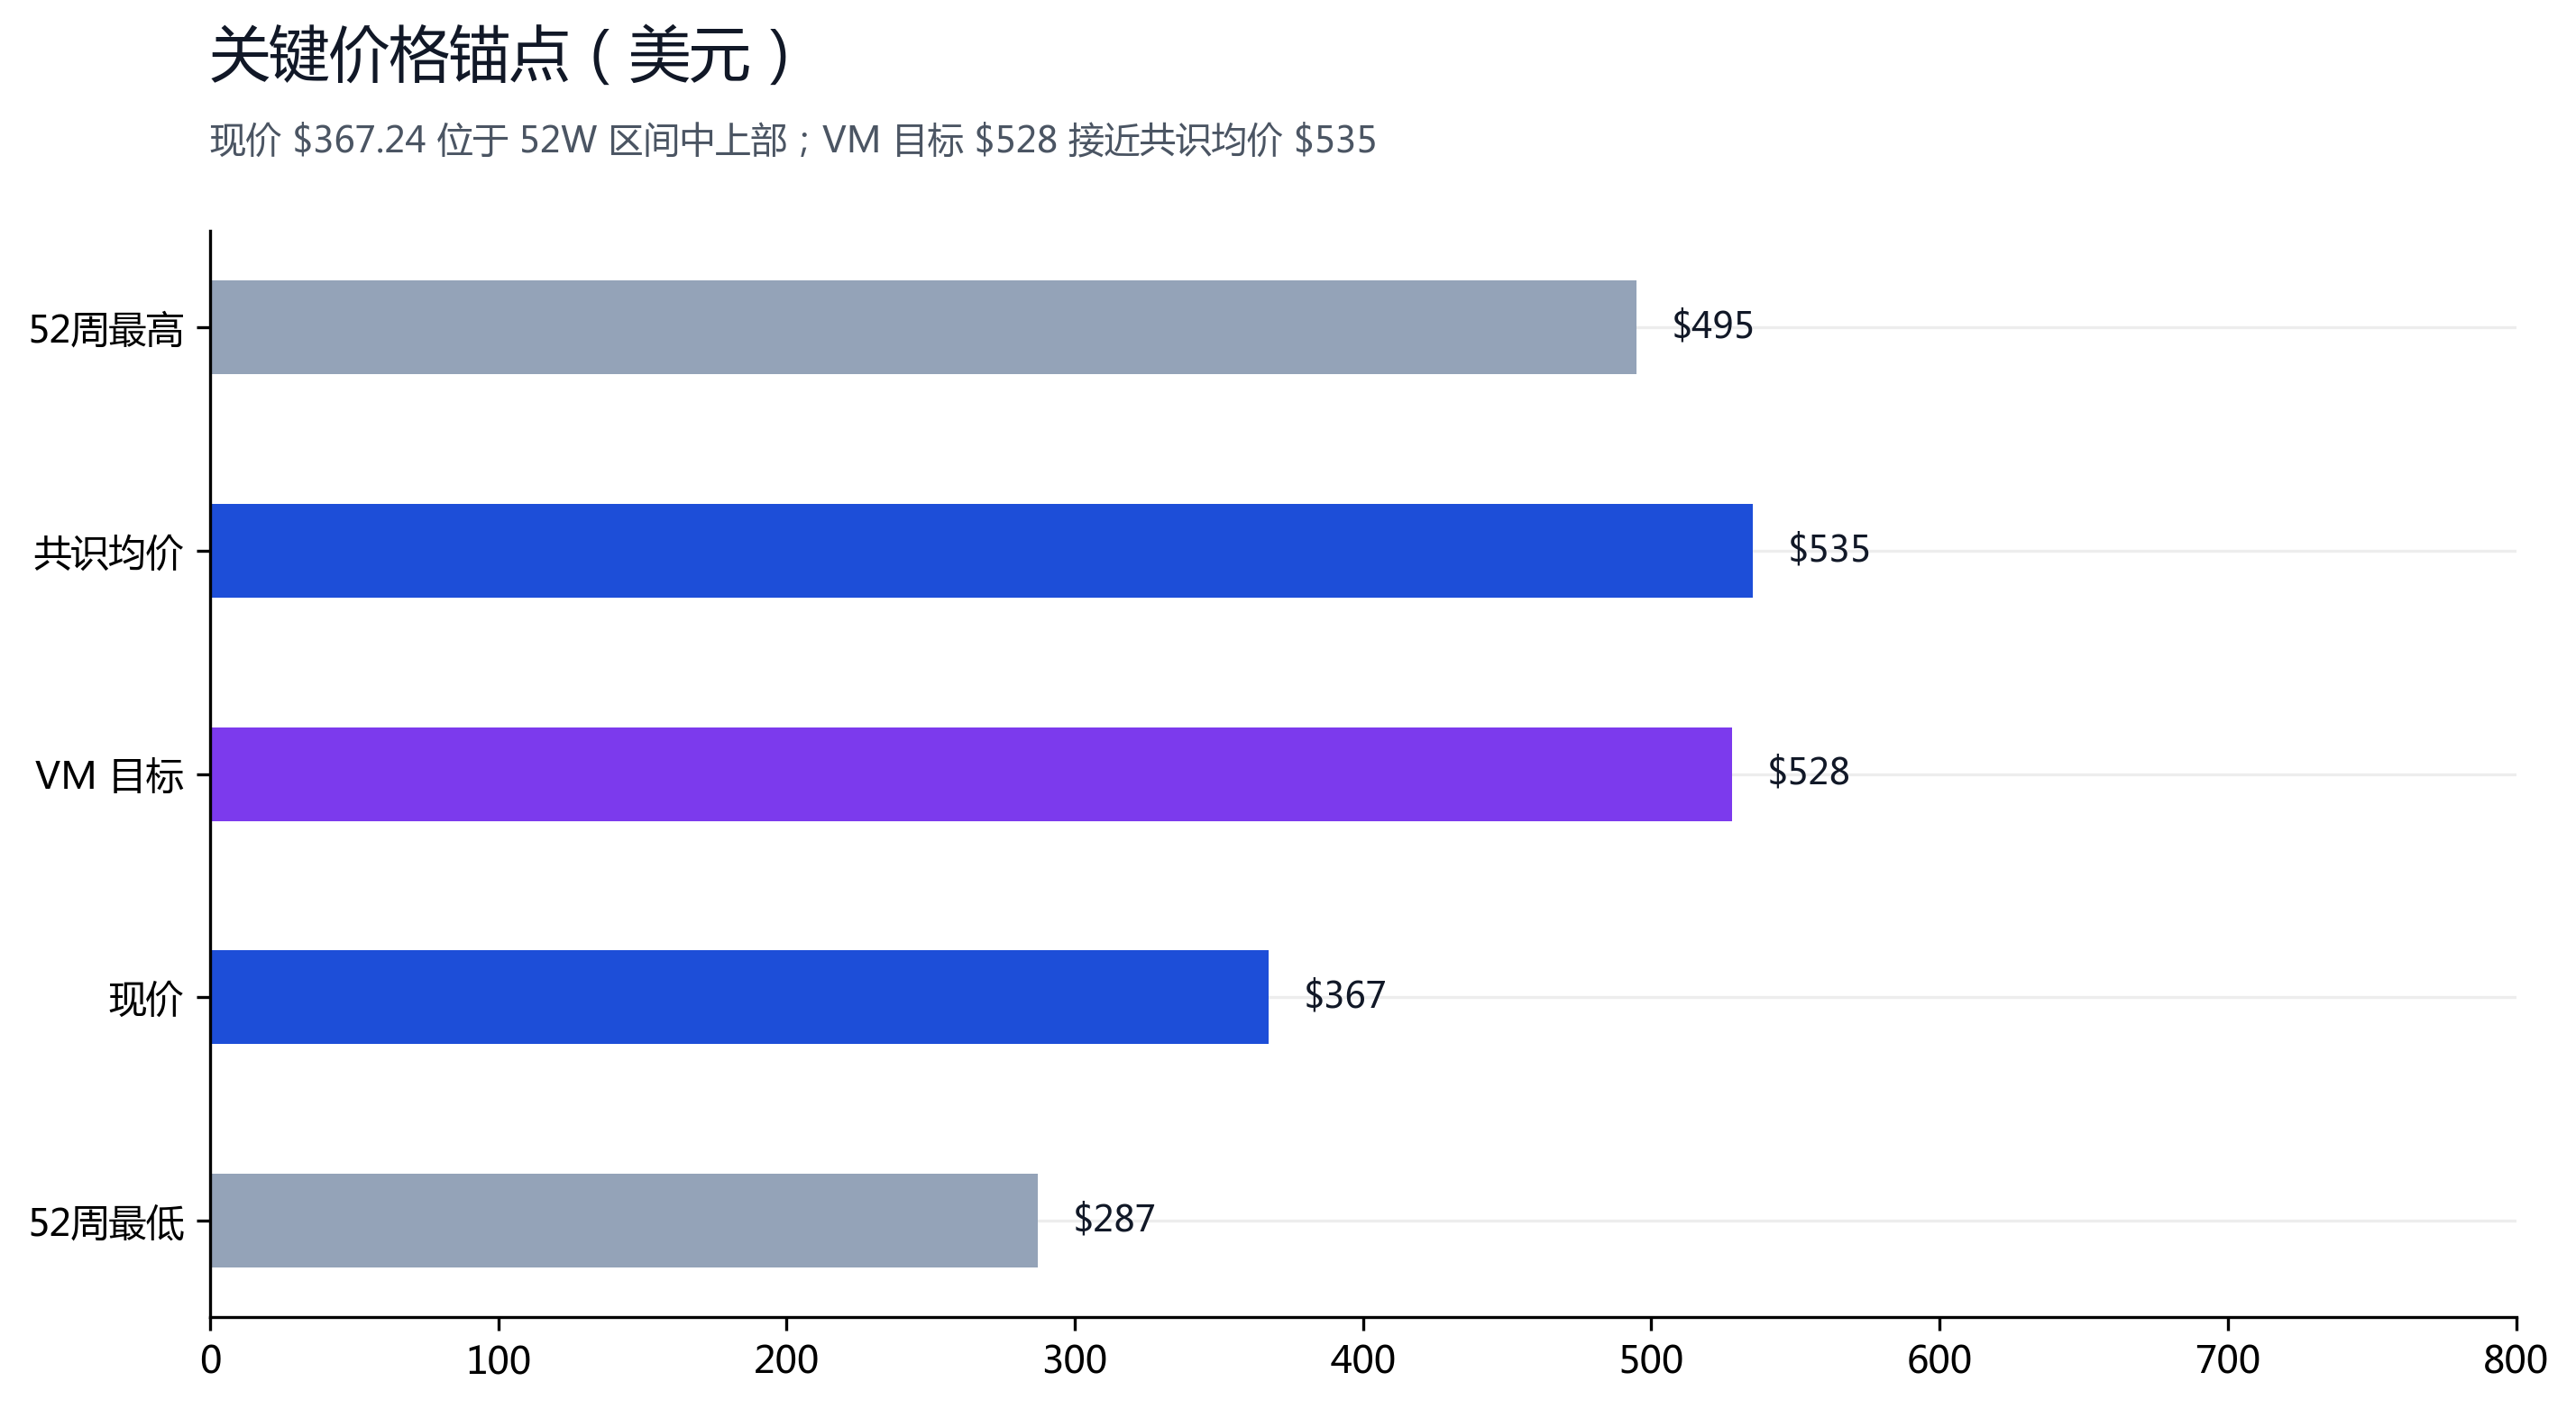
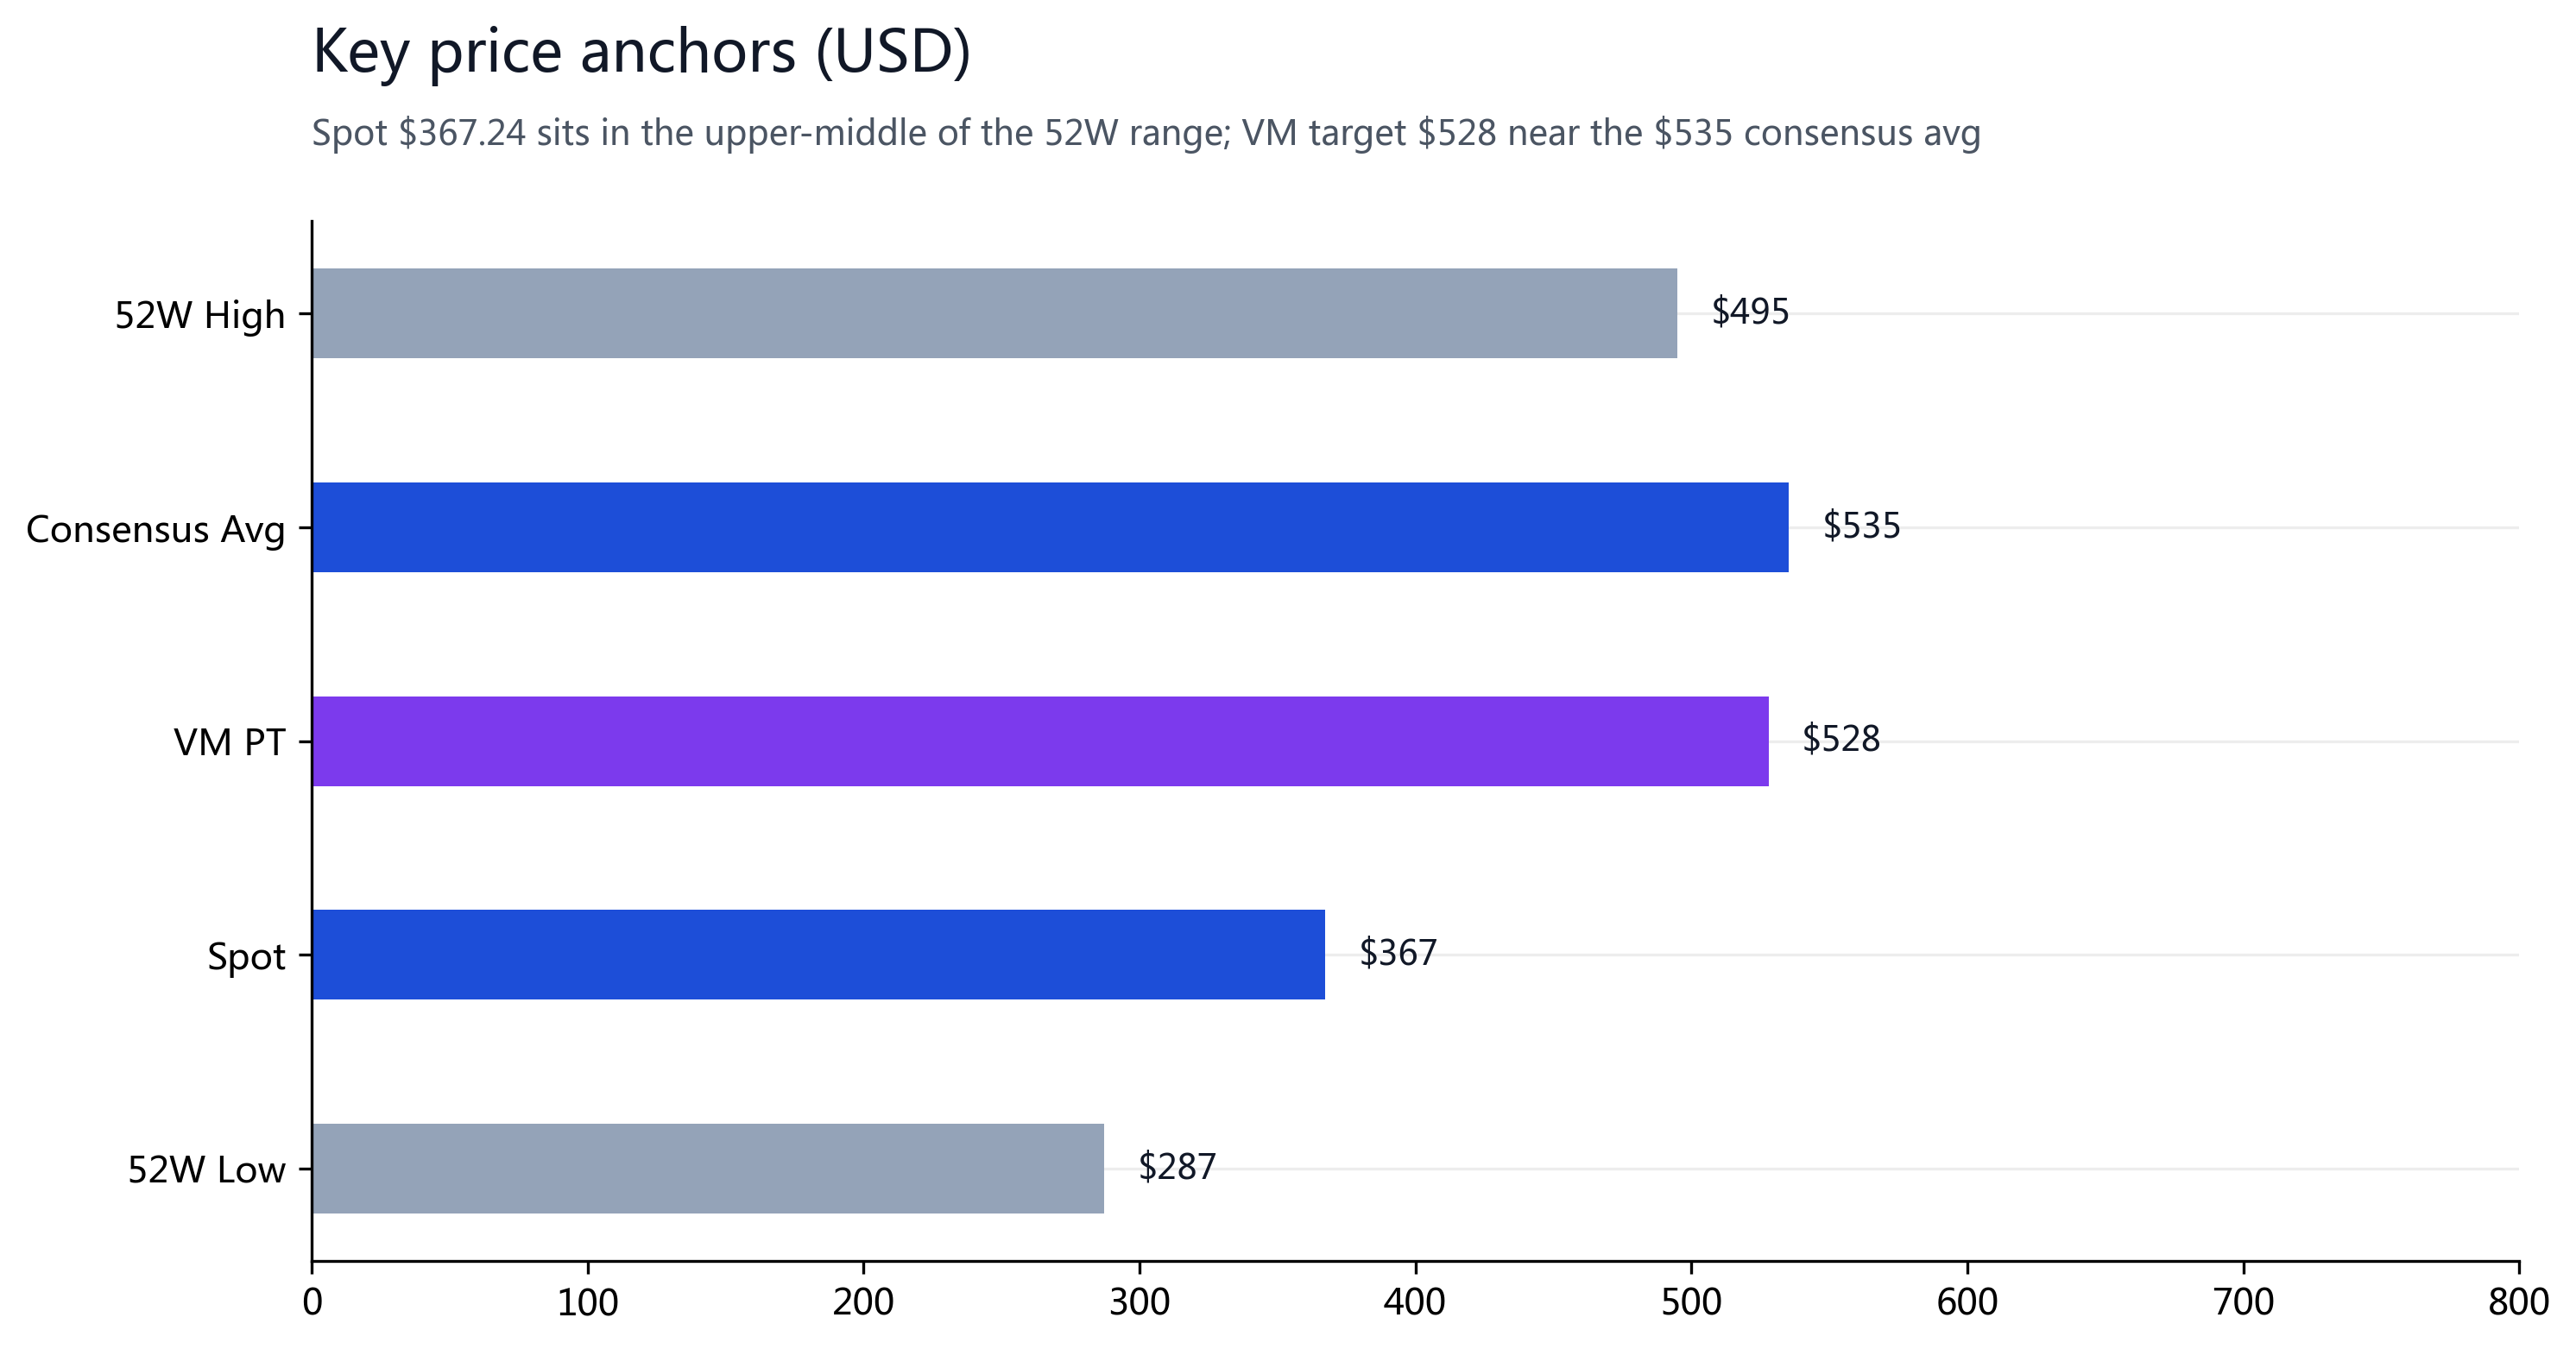
On 2026-09-02, AVGO closed at $367.24 (-0.66%, prior close $369.67; after-hours $354.34 post-FQ3'26), market cap $1.75T (4.766B shares × $367.24). The 52-week range is $287.17-$495.00, beta 1.47 (above market). Short interest 56.21M shares. From the $287.17 low to the $495.00 high the range is 72.4%; spot is -25.8% off the 52W high and +27.9% above the 52W low.
| Metric | Value | Source / Note |
|---|---|---|
| Current price | $367.24 | Sep 2 close (-0.66%); AH $354.34 |
| Market cap | $1.75T | 367.24 × 4,766M shares (NeoData) |
| 52W range | $287.17-$495.00 | Low/High (NeoData 9/3) |
| Beta | 1.47 | NeoData (above market) |
| Short interest | 56.21M | Short interest (NeoData) |
| TTM P/E (FY2025 GAAP) | 77.0x | 367.24 / FY2025 EPS $4.77 |
| Forward P/E (FY2027E) | 18.8x | 367.24 / FY2027E consensus EPS $19.57 (Yahoo/MarketWatch/Trefis) |
| Analyst PT | $400 / $535 / $715 | Low / Avg / High · 48-56 brokers (9/2026) |
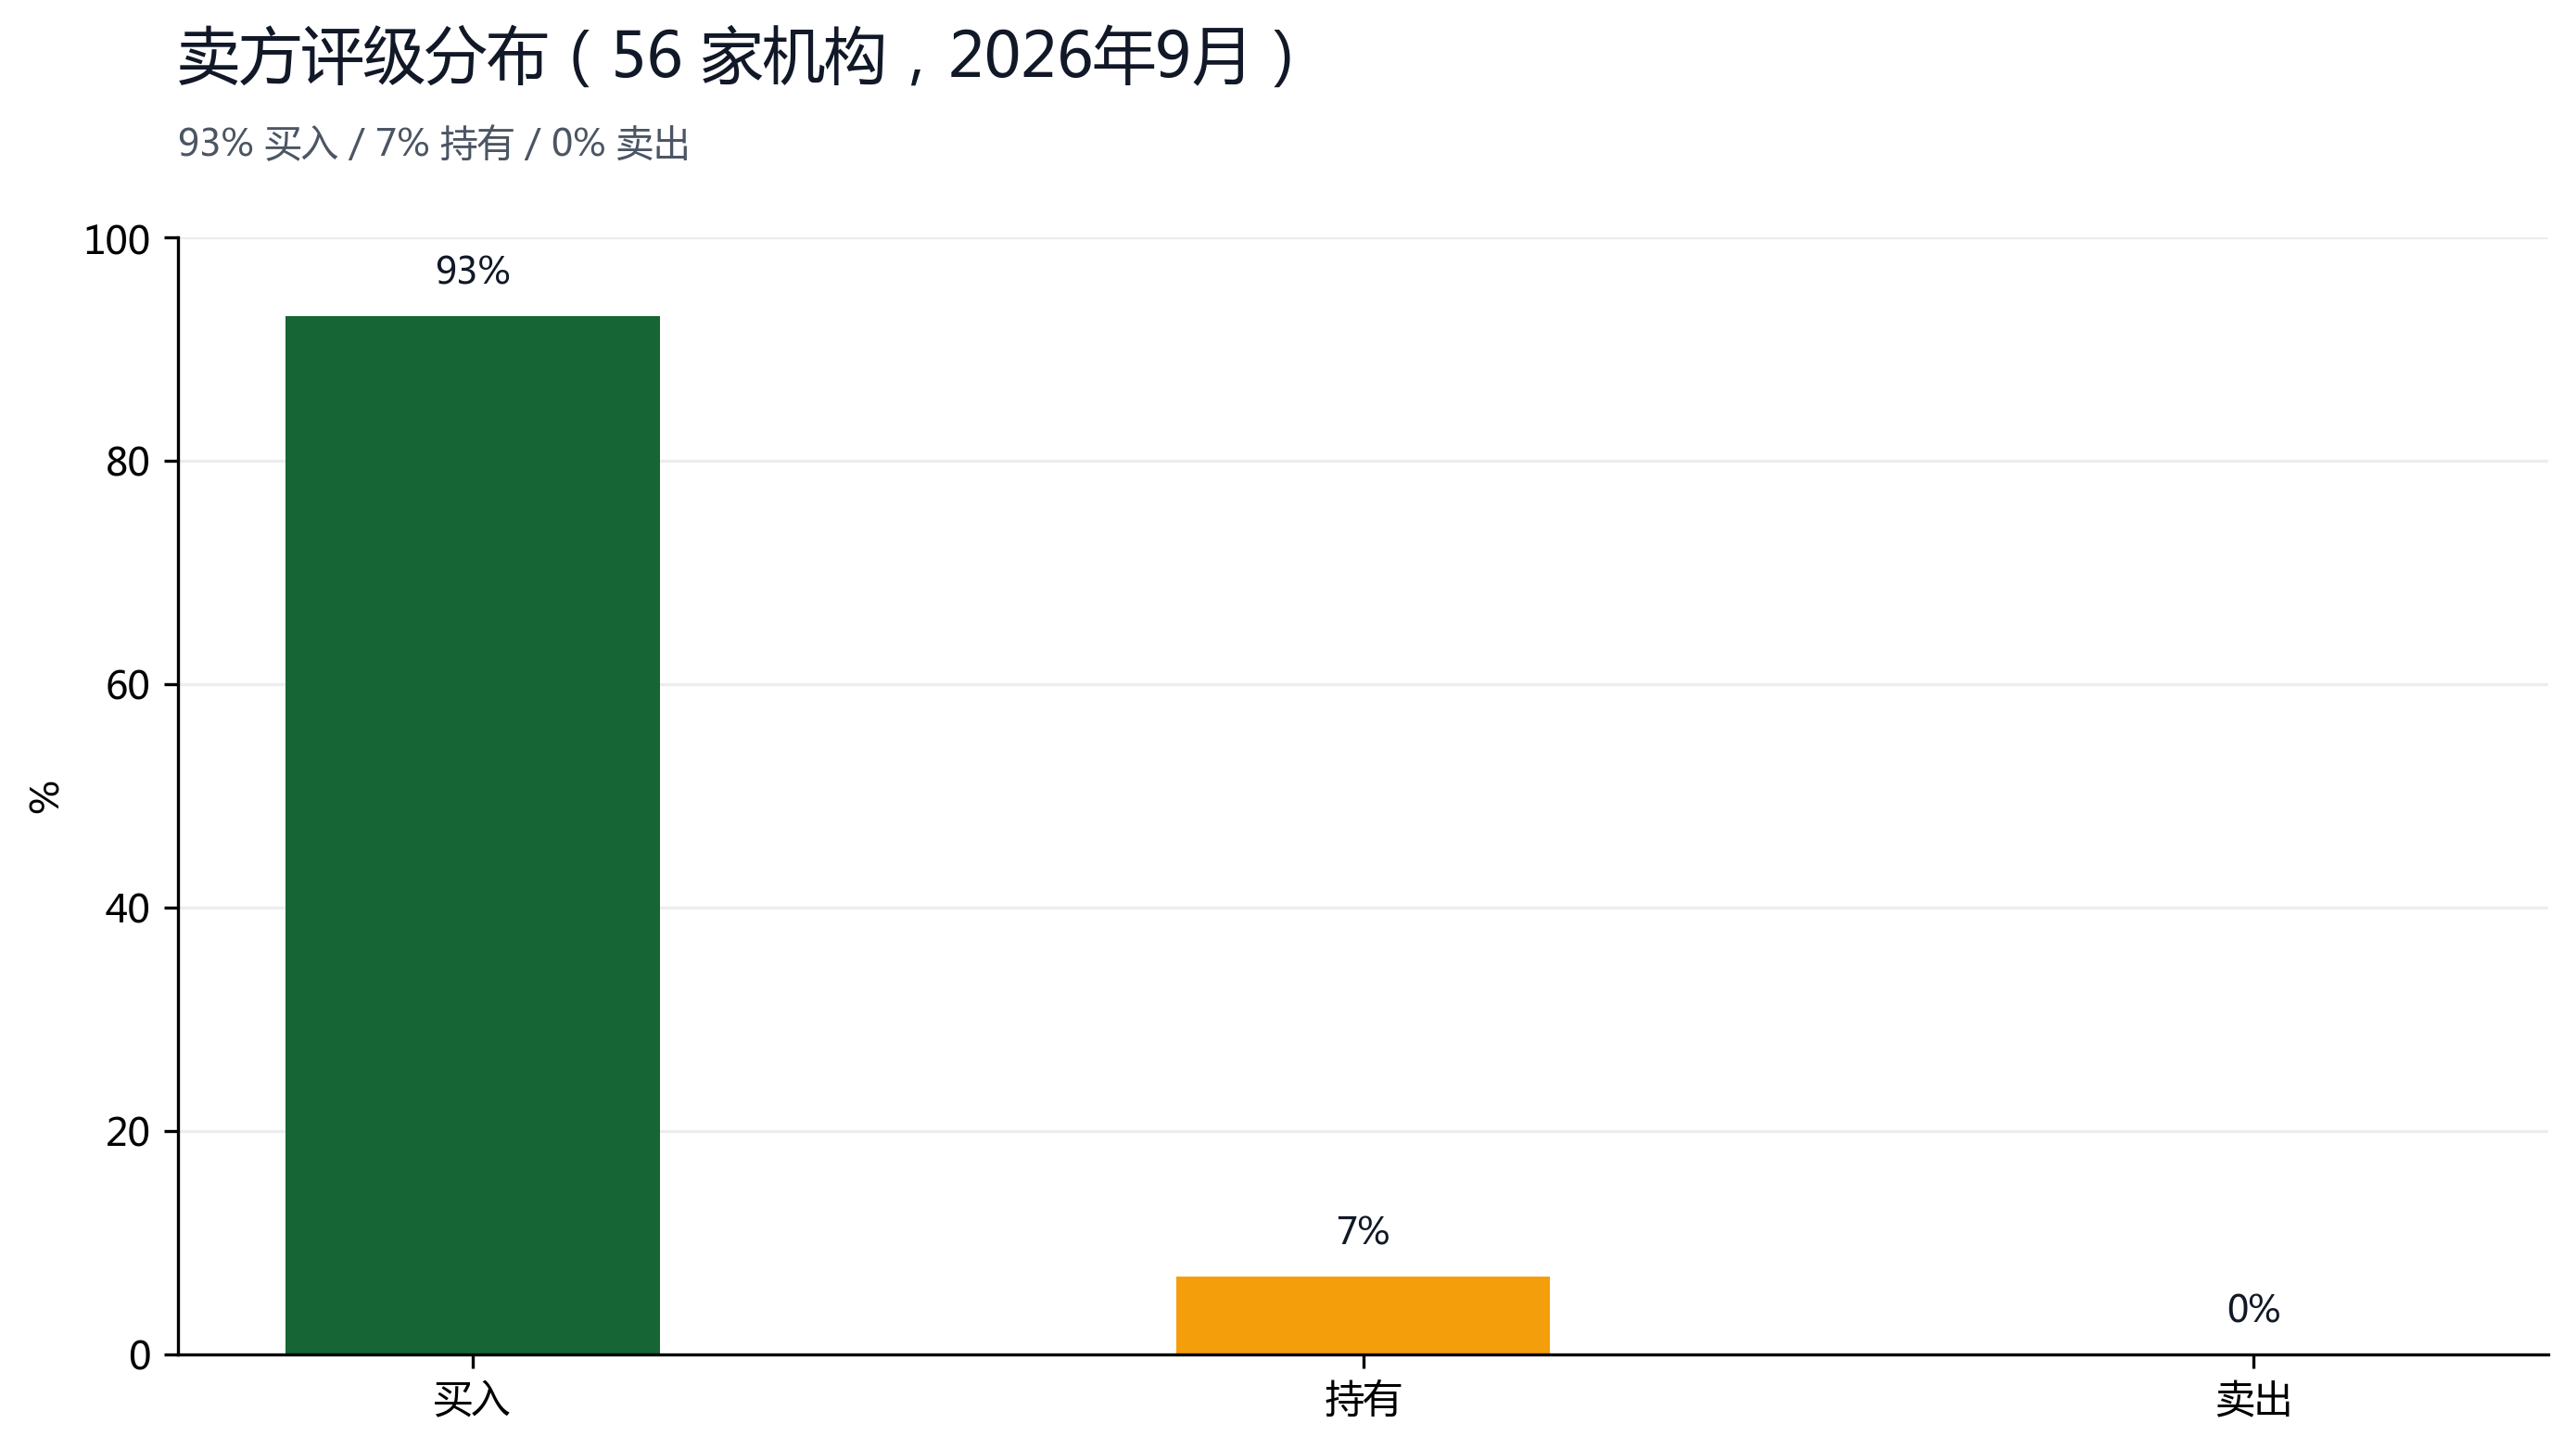
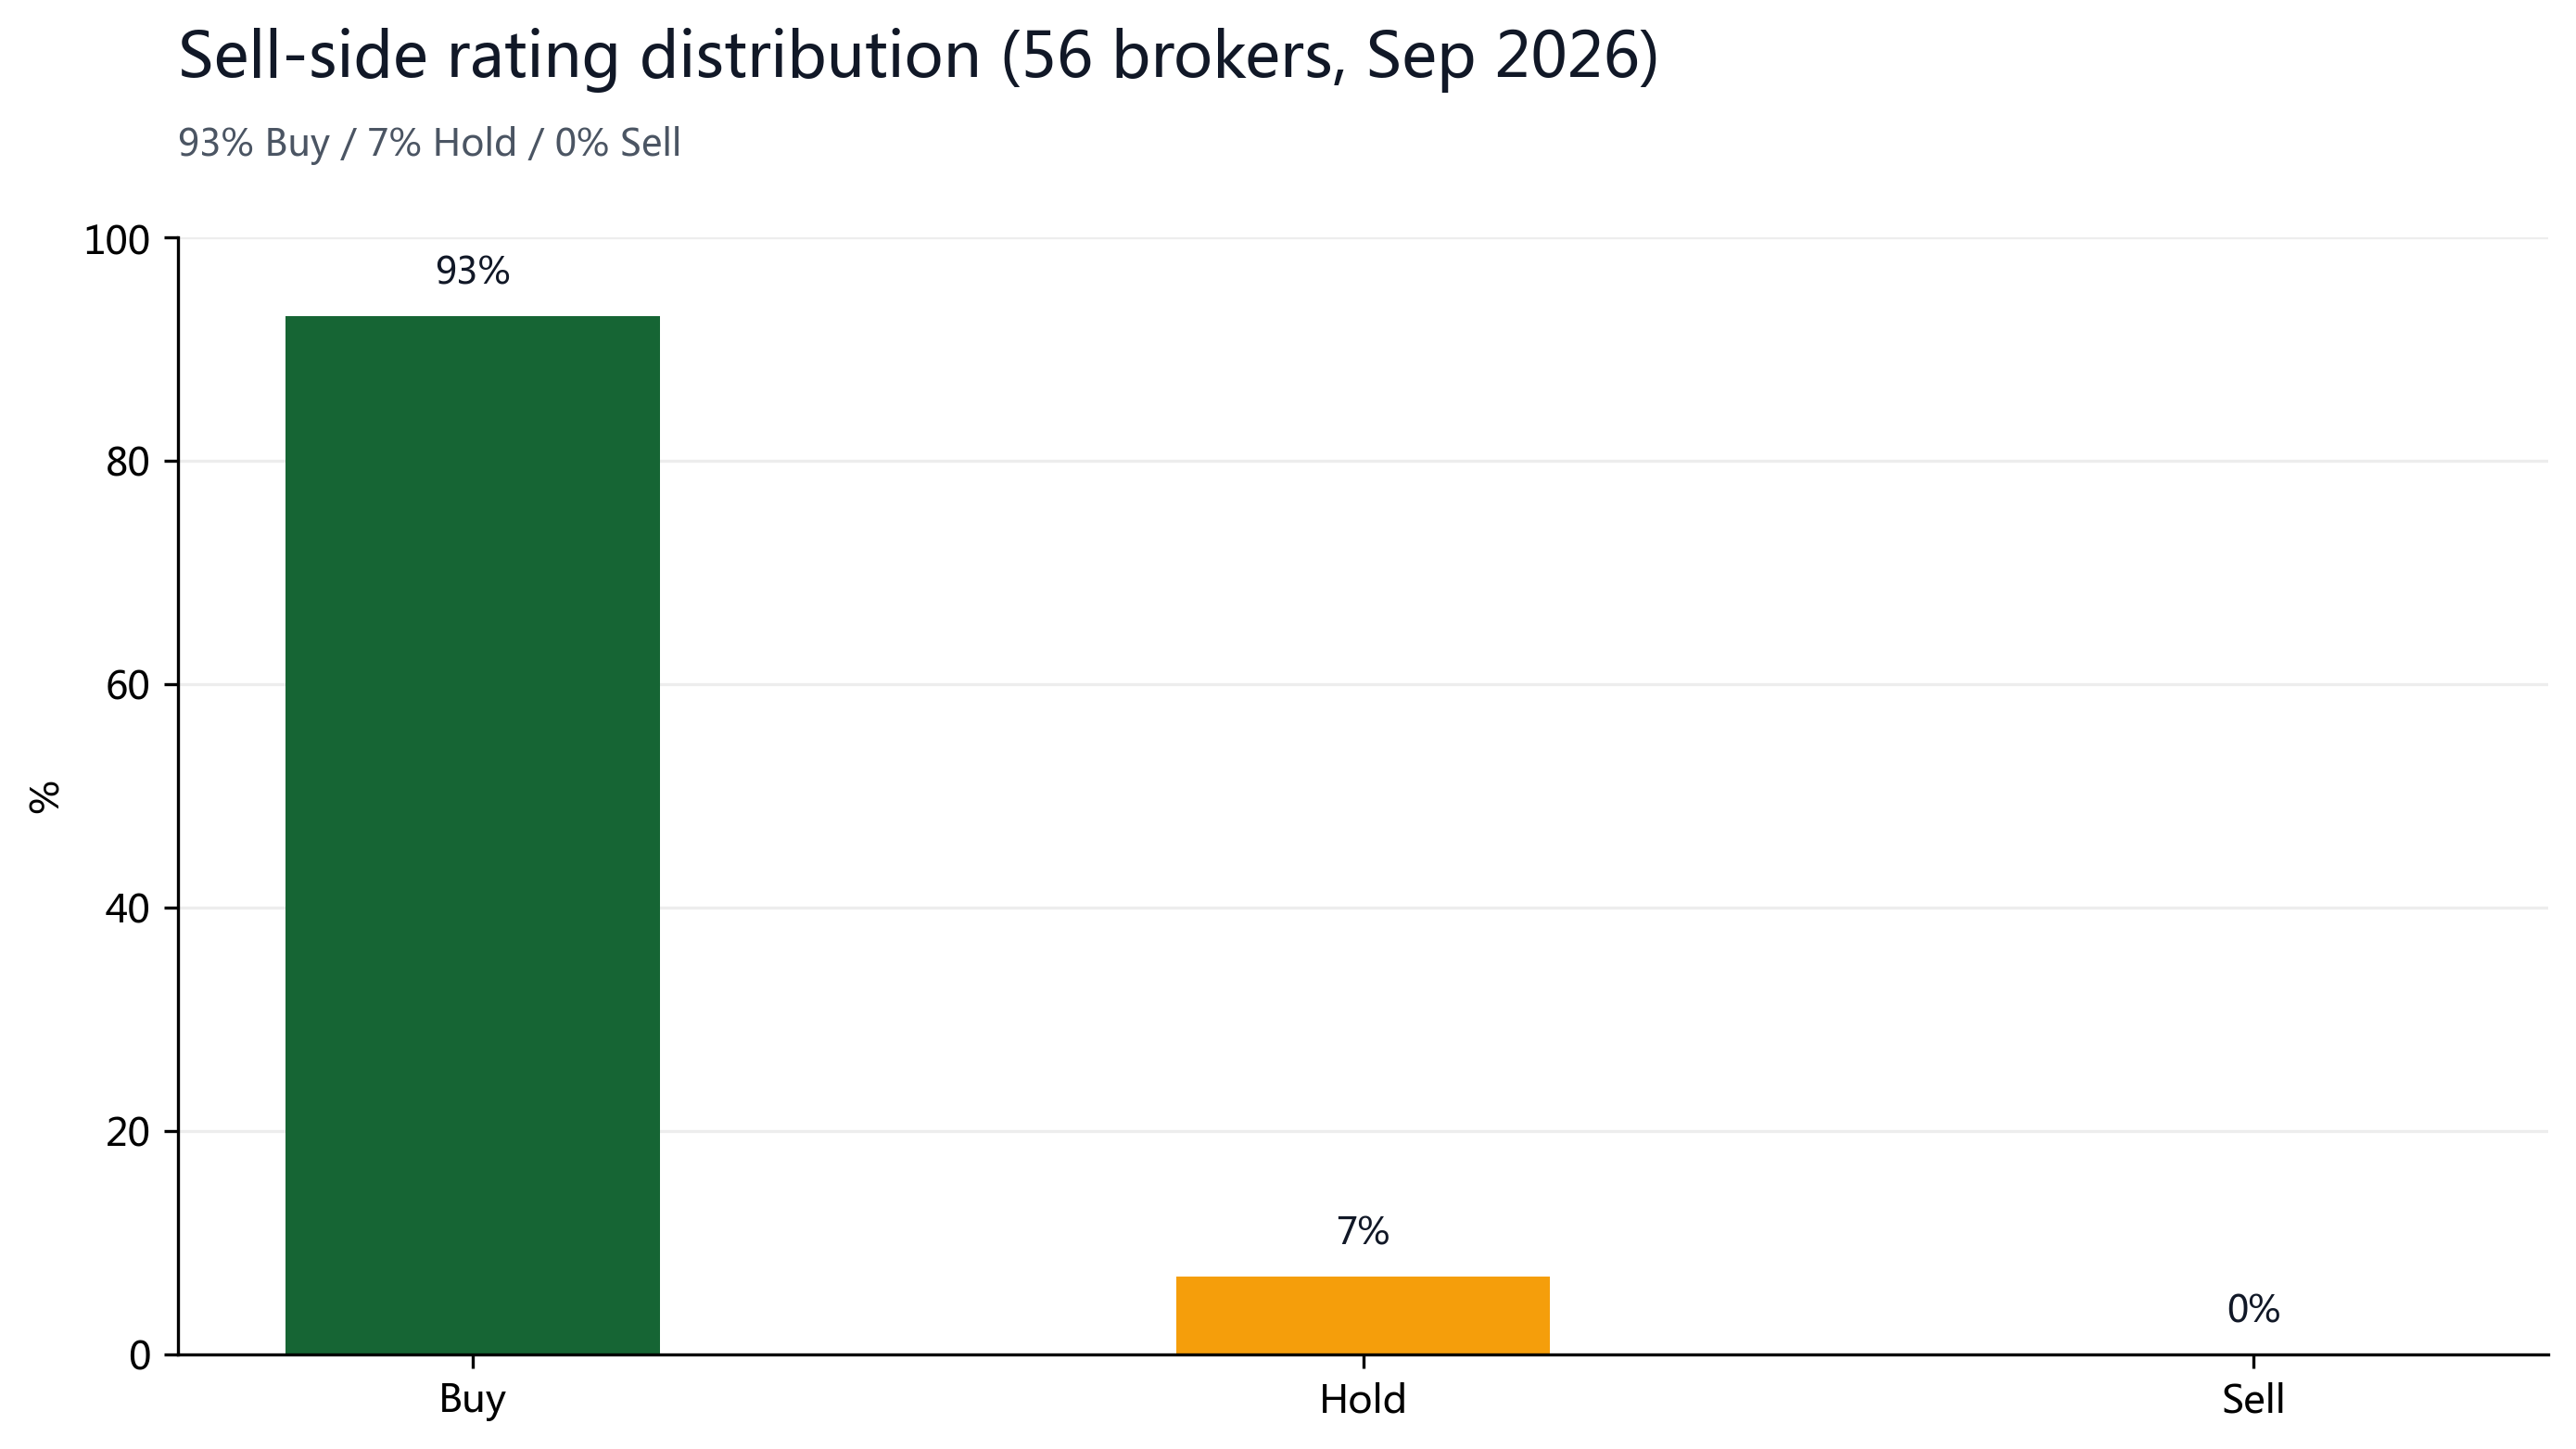
| Recommendation split | 93% / 7% / 0% | Buy / Hold / Sell · 56 brokers (Sep 2026) |
| Shares outstanding | 4,766M | NeoData / 10-Q diluted 4,876M (for EPS) |
§03Bull/Bear View
Bullish: 93% Street Buy + AI-network oligopoly + multi-year custom compute + FY2028 AI revenue $230B visibility
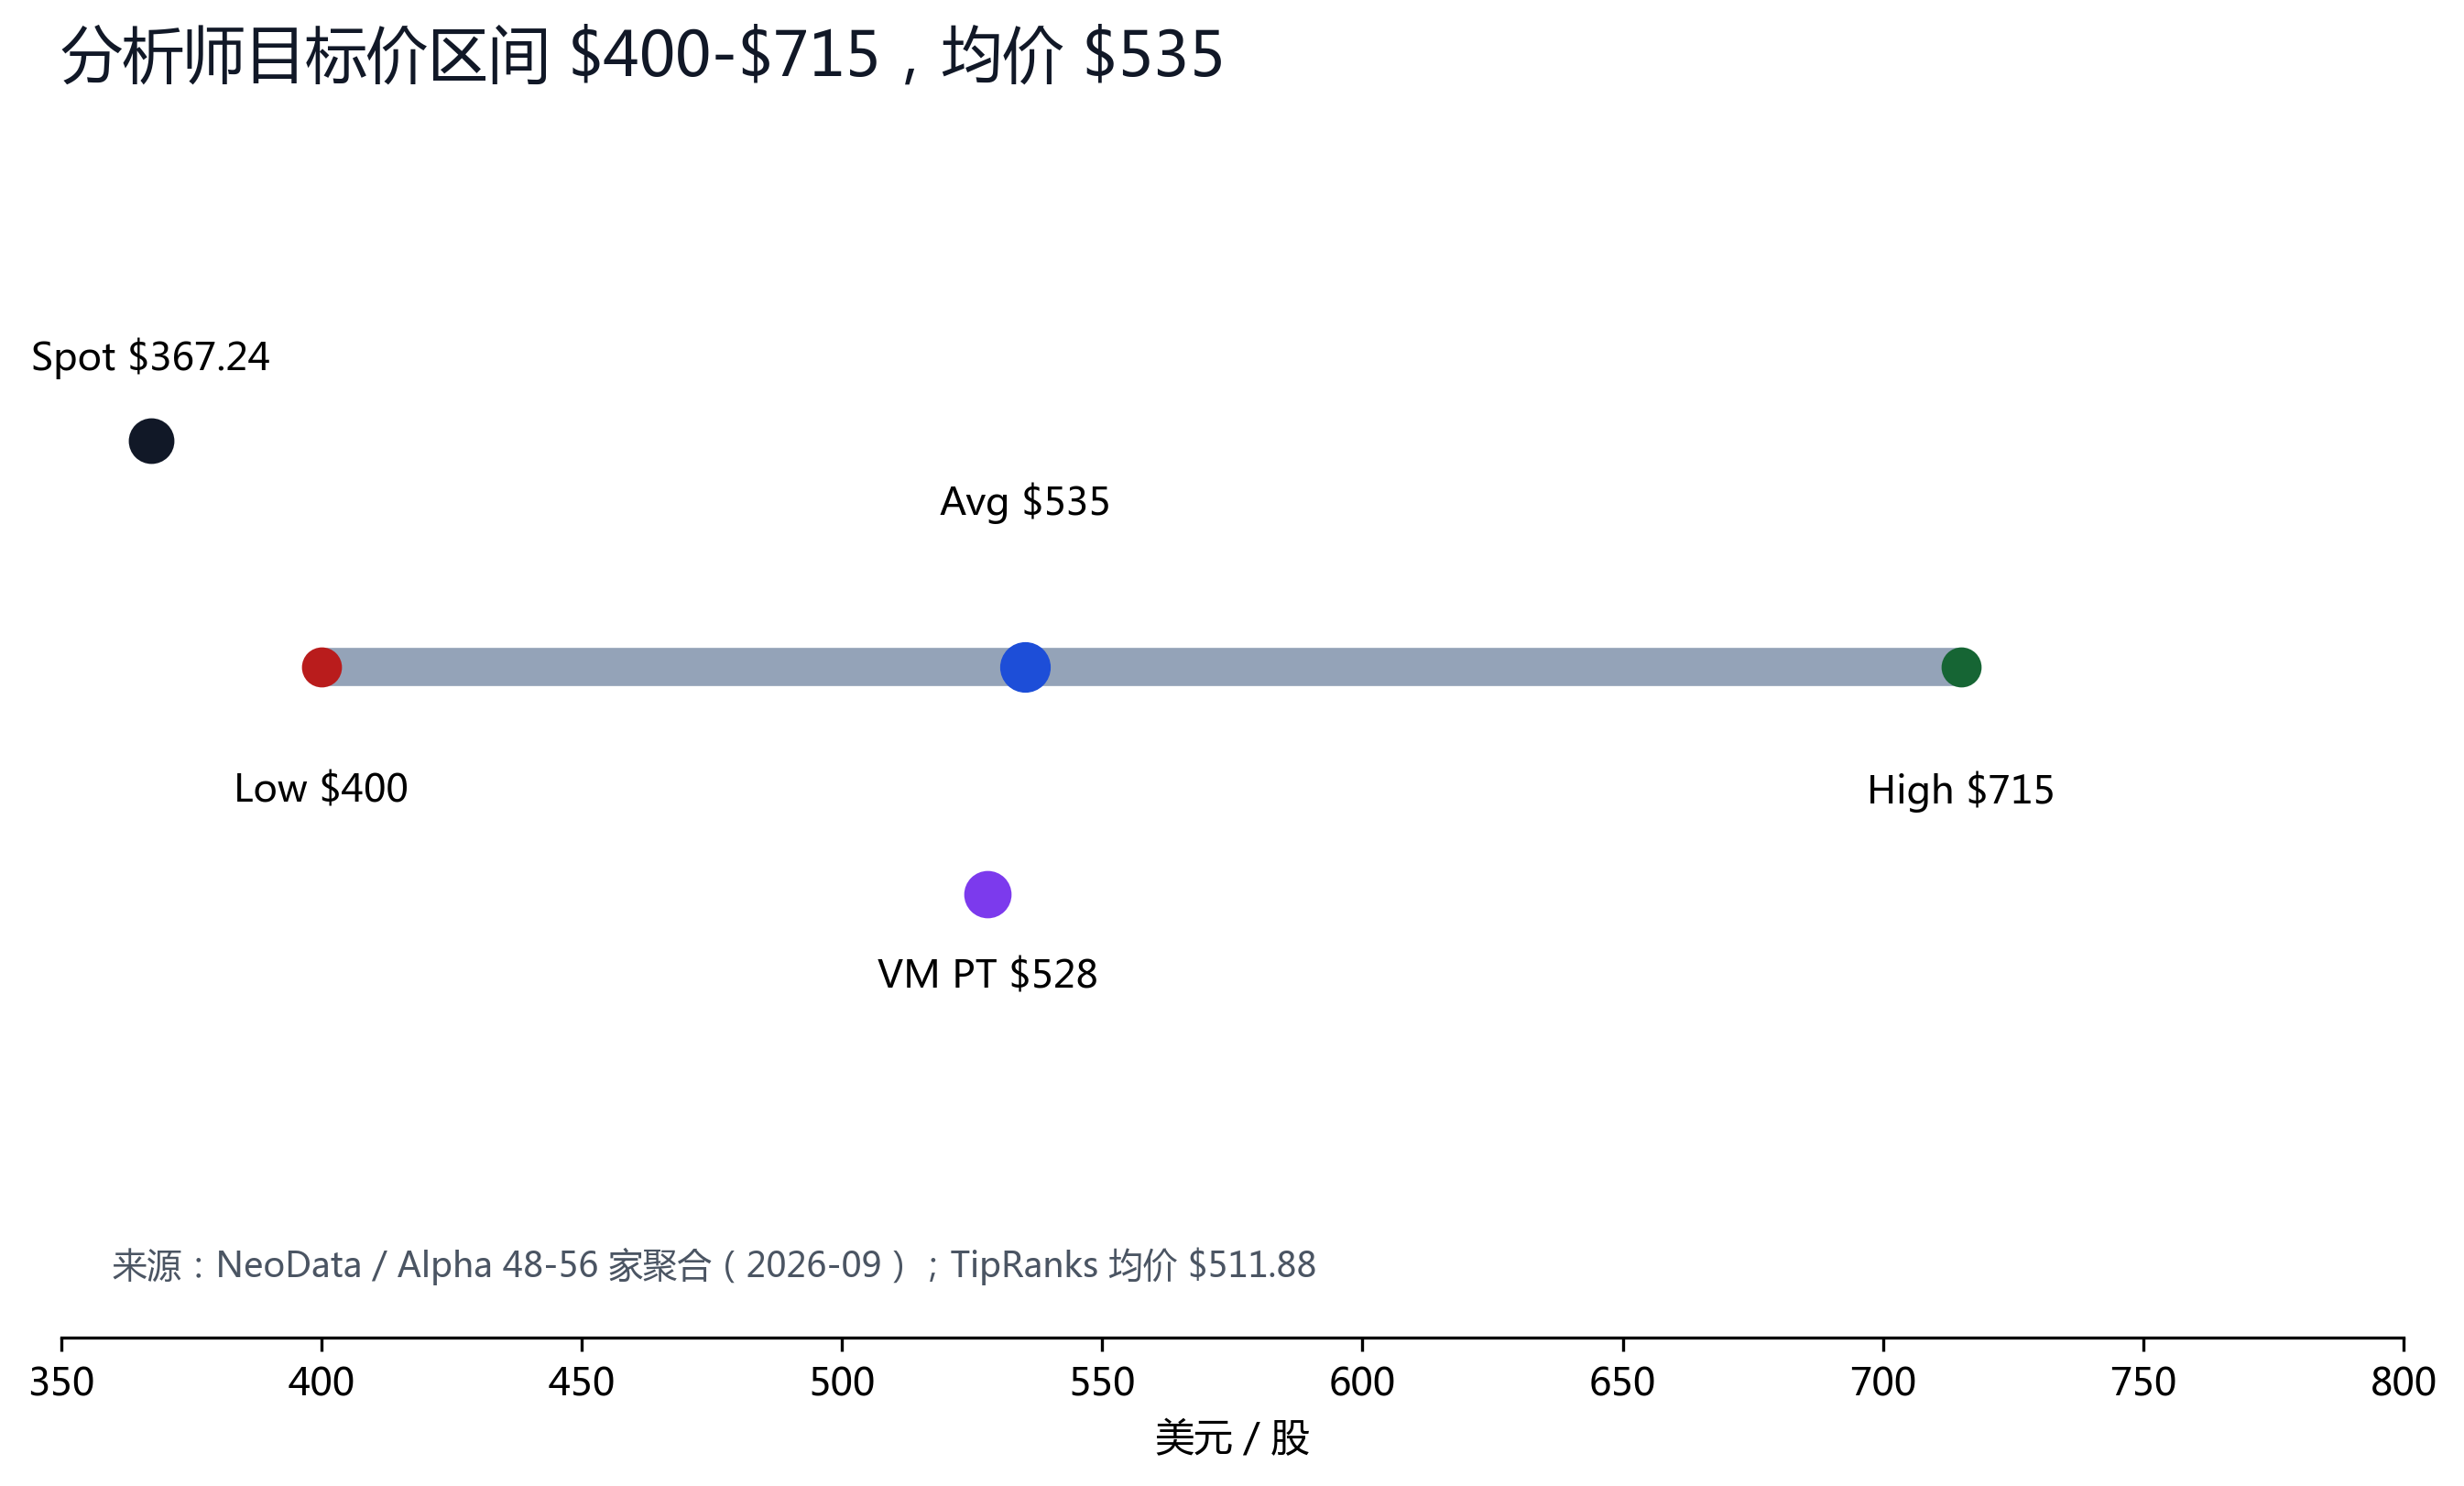
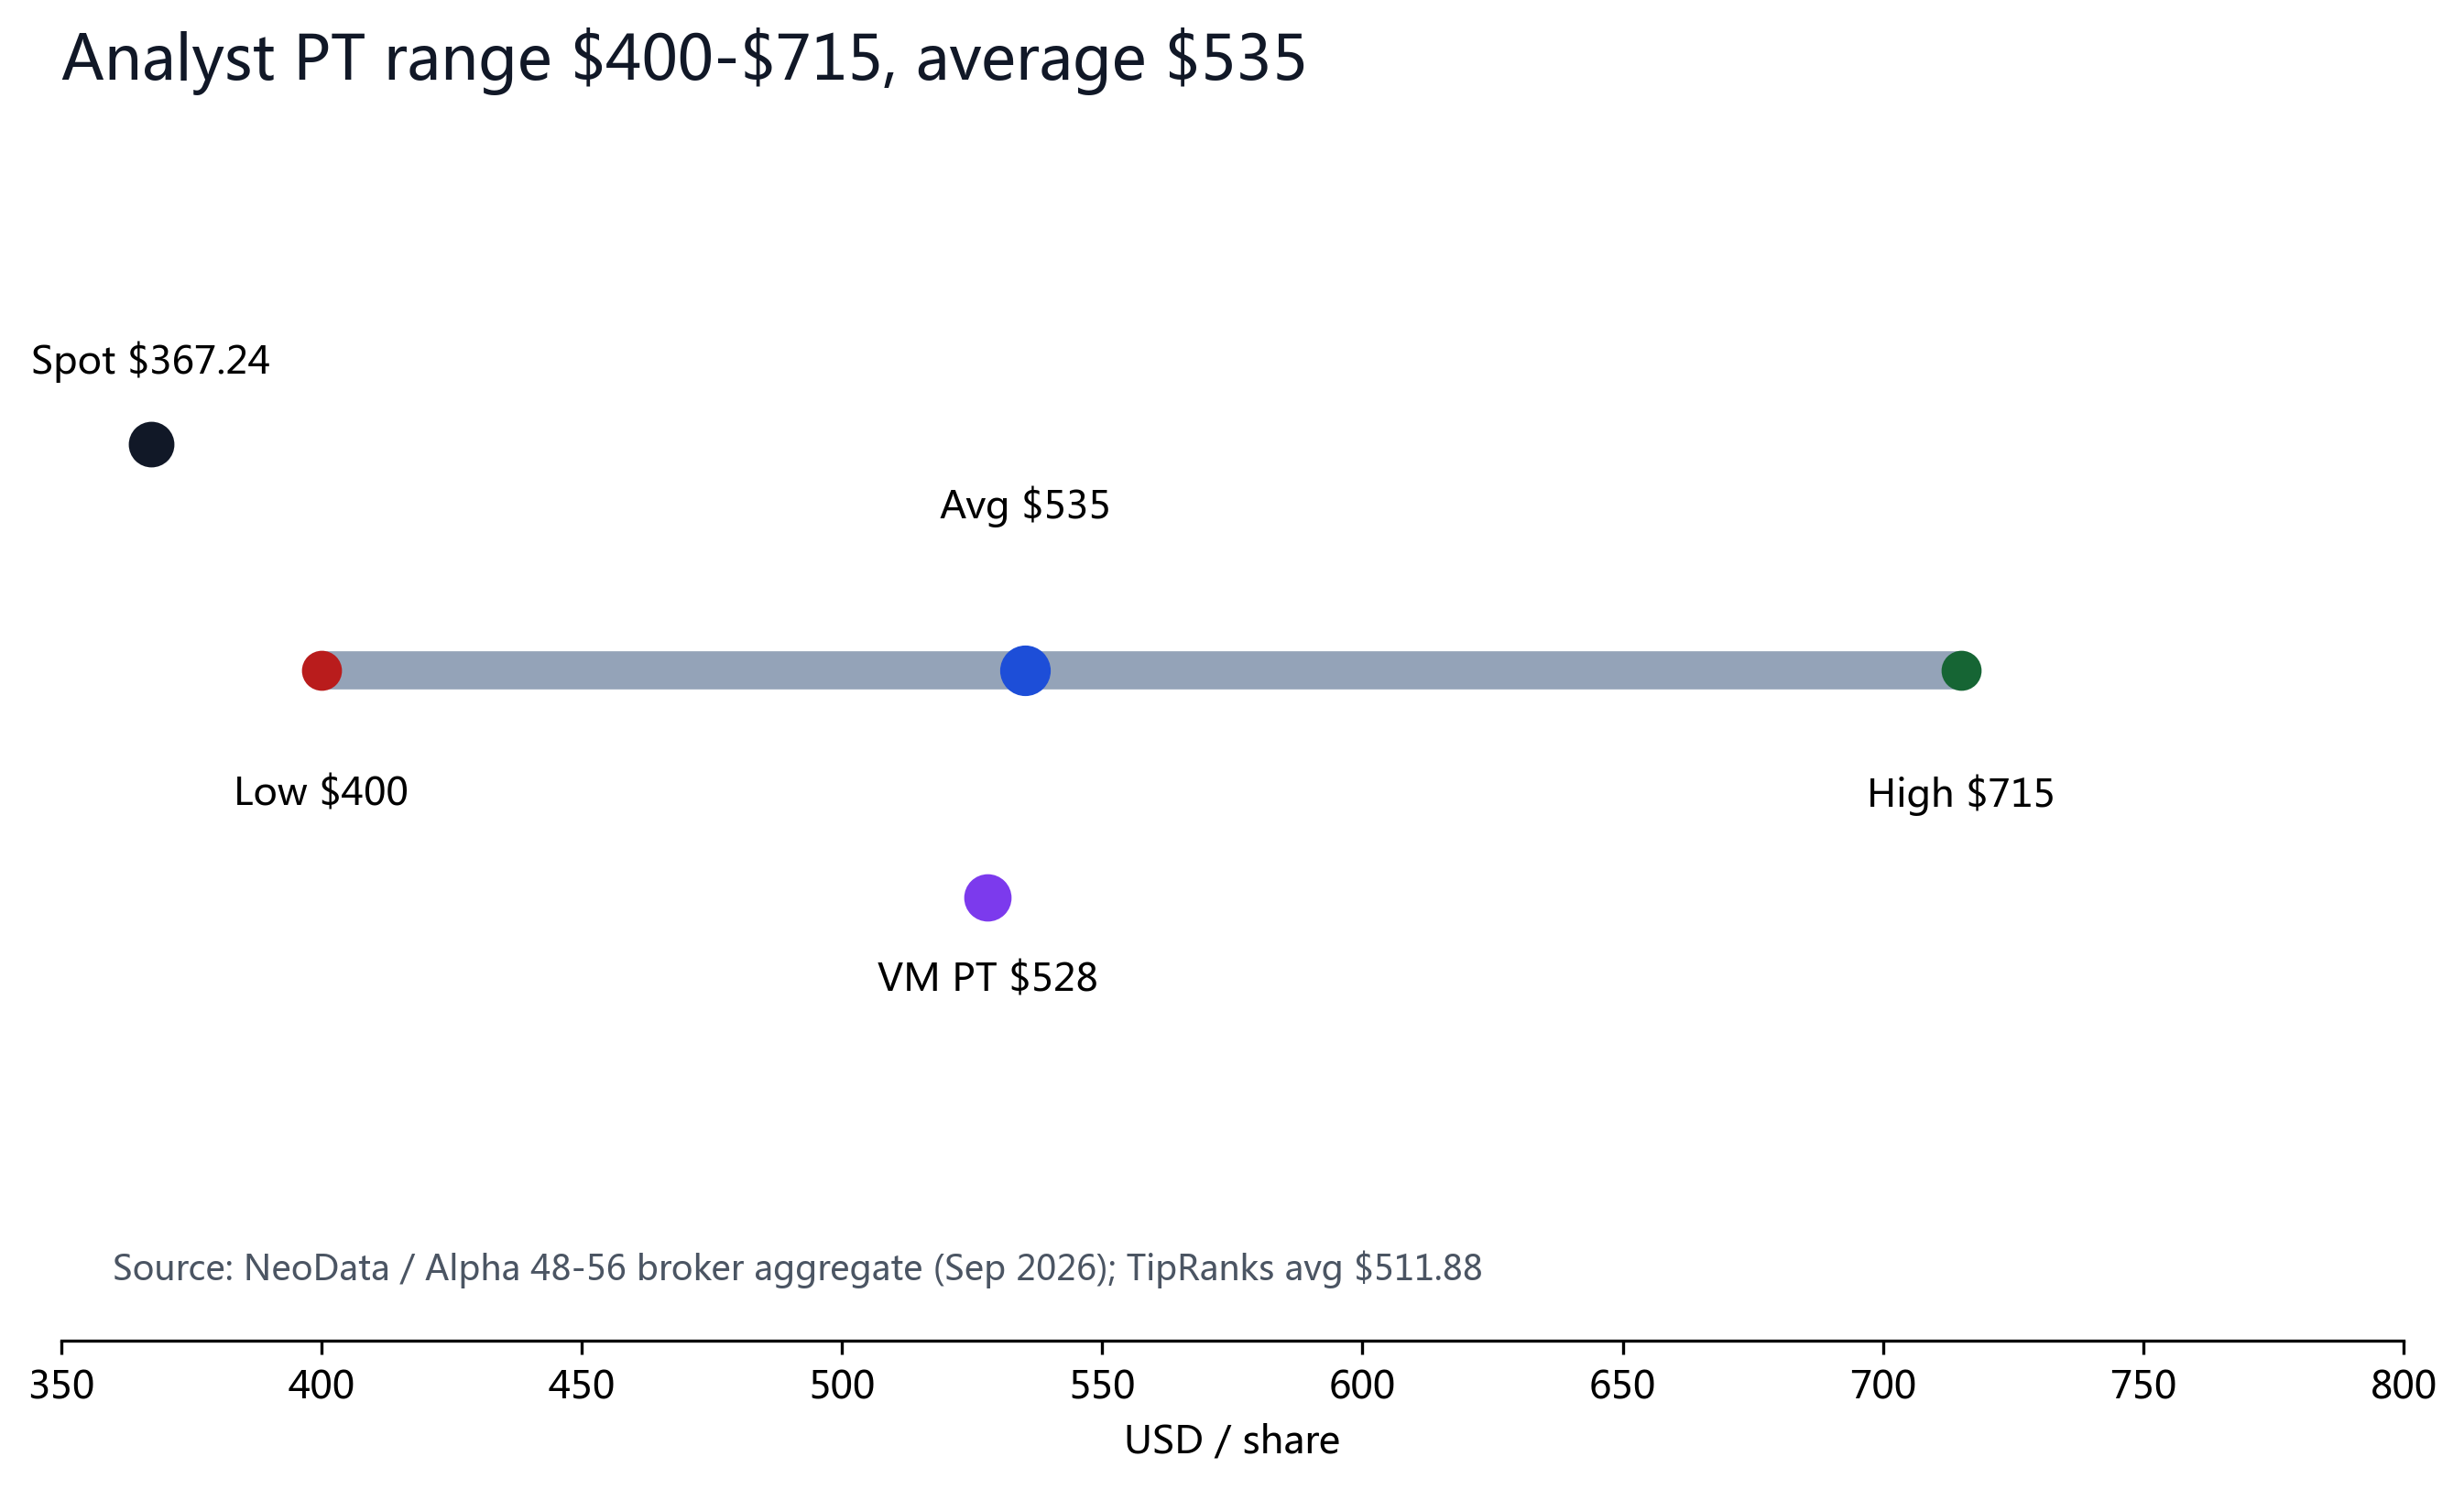
Sell-side: 56 brokers over the last 6 months — 93% Buy / 7% Hold / 0% Sell; consensus average $535.25 (high $715), TipRanks avg $511.88. AI side: Broadcom is the dual oligopolist in AI Ethernet switching (Tomahawk/TH) and custom compute (3 hyperscalers' bespoke AI accelerators); FQ3'26 AI semi $16.7B (+221% YoY, 56% of revenue), guide FY2026 $58B / FY2027 $115B / FY2028 $230B — nearly 4x in three years, an explicit endorsement of multi-year customer commitments. Infra software (VMware subscription) provides stable high-margin cash flow, hedging the semi cycle.
Bearish: extreme custom-AI-semi customer concentration + 18.8x-forward 'cycle memory' + insiders 146 trades 1 buy/145 sell
Custom AI semi revenue is overwhelmingly from 3 hyperscalers; a single customer's capex slowdown or in-house ASIC substitution could void the FY2028 $230B guide — Broadcom's biggest differentiated risk vs NVDA. The market prices AVGO at only 18.8x FY2027E, implying meaningful probability of a 2027-28 earnings roll-over (the 20-year semi-cycle memory). Insiders traded 146 times in 6 months — 1 buy / 145 sells; co-founder Henry Samueli made 38 sales ($500M), mostly scheduled Rule 10b5-1 plan sales (not timing-based bearishness), but the '1 buy' signal is weak, reflecting orderly management monetization at high prices.
§04Financial Truth
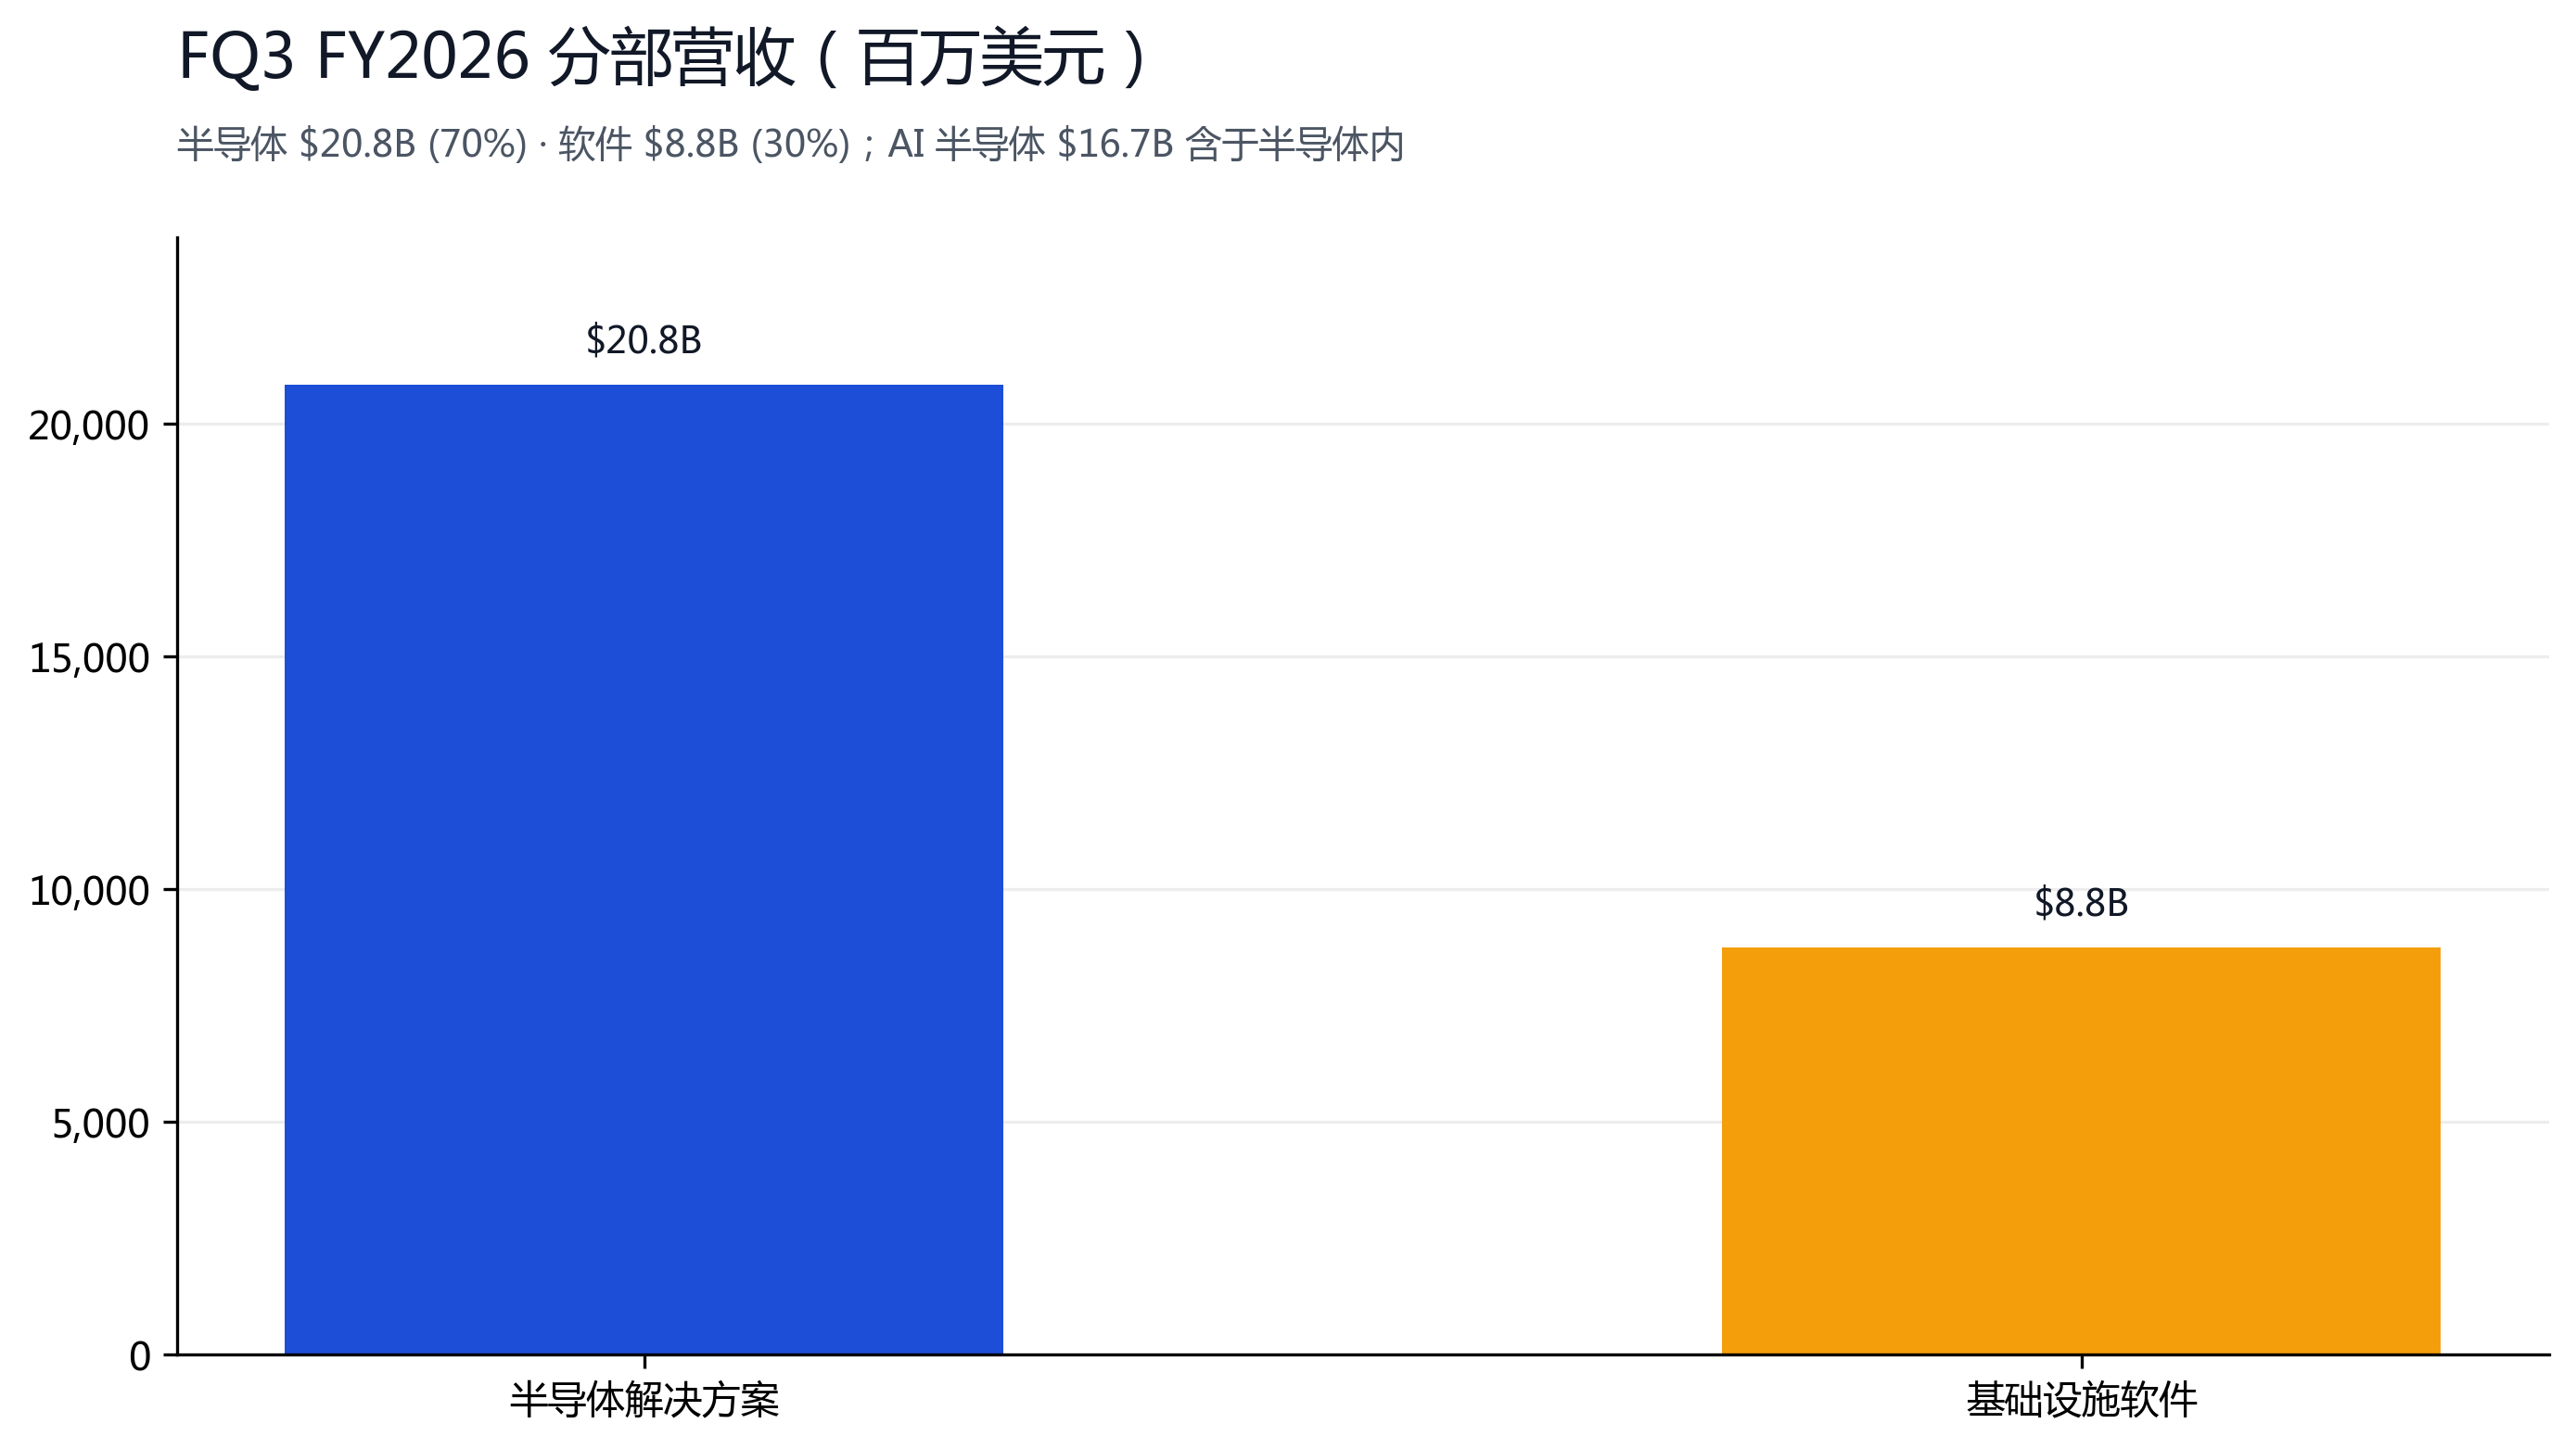
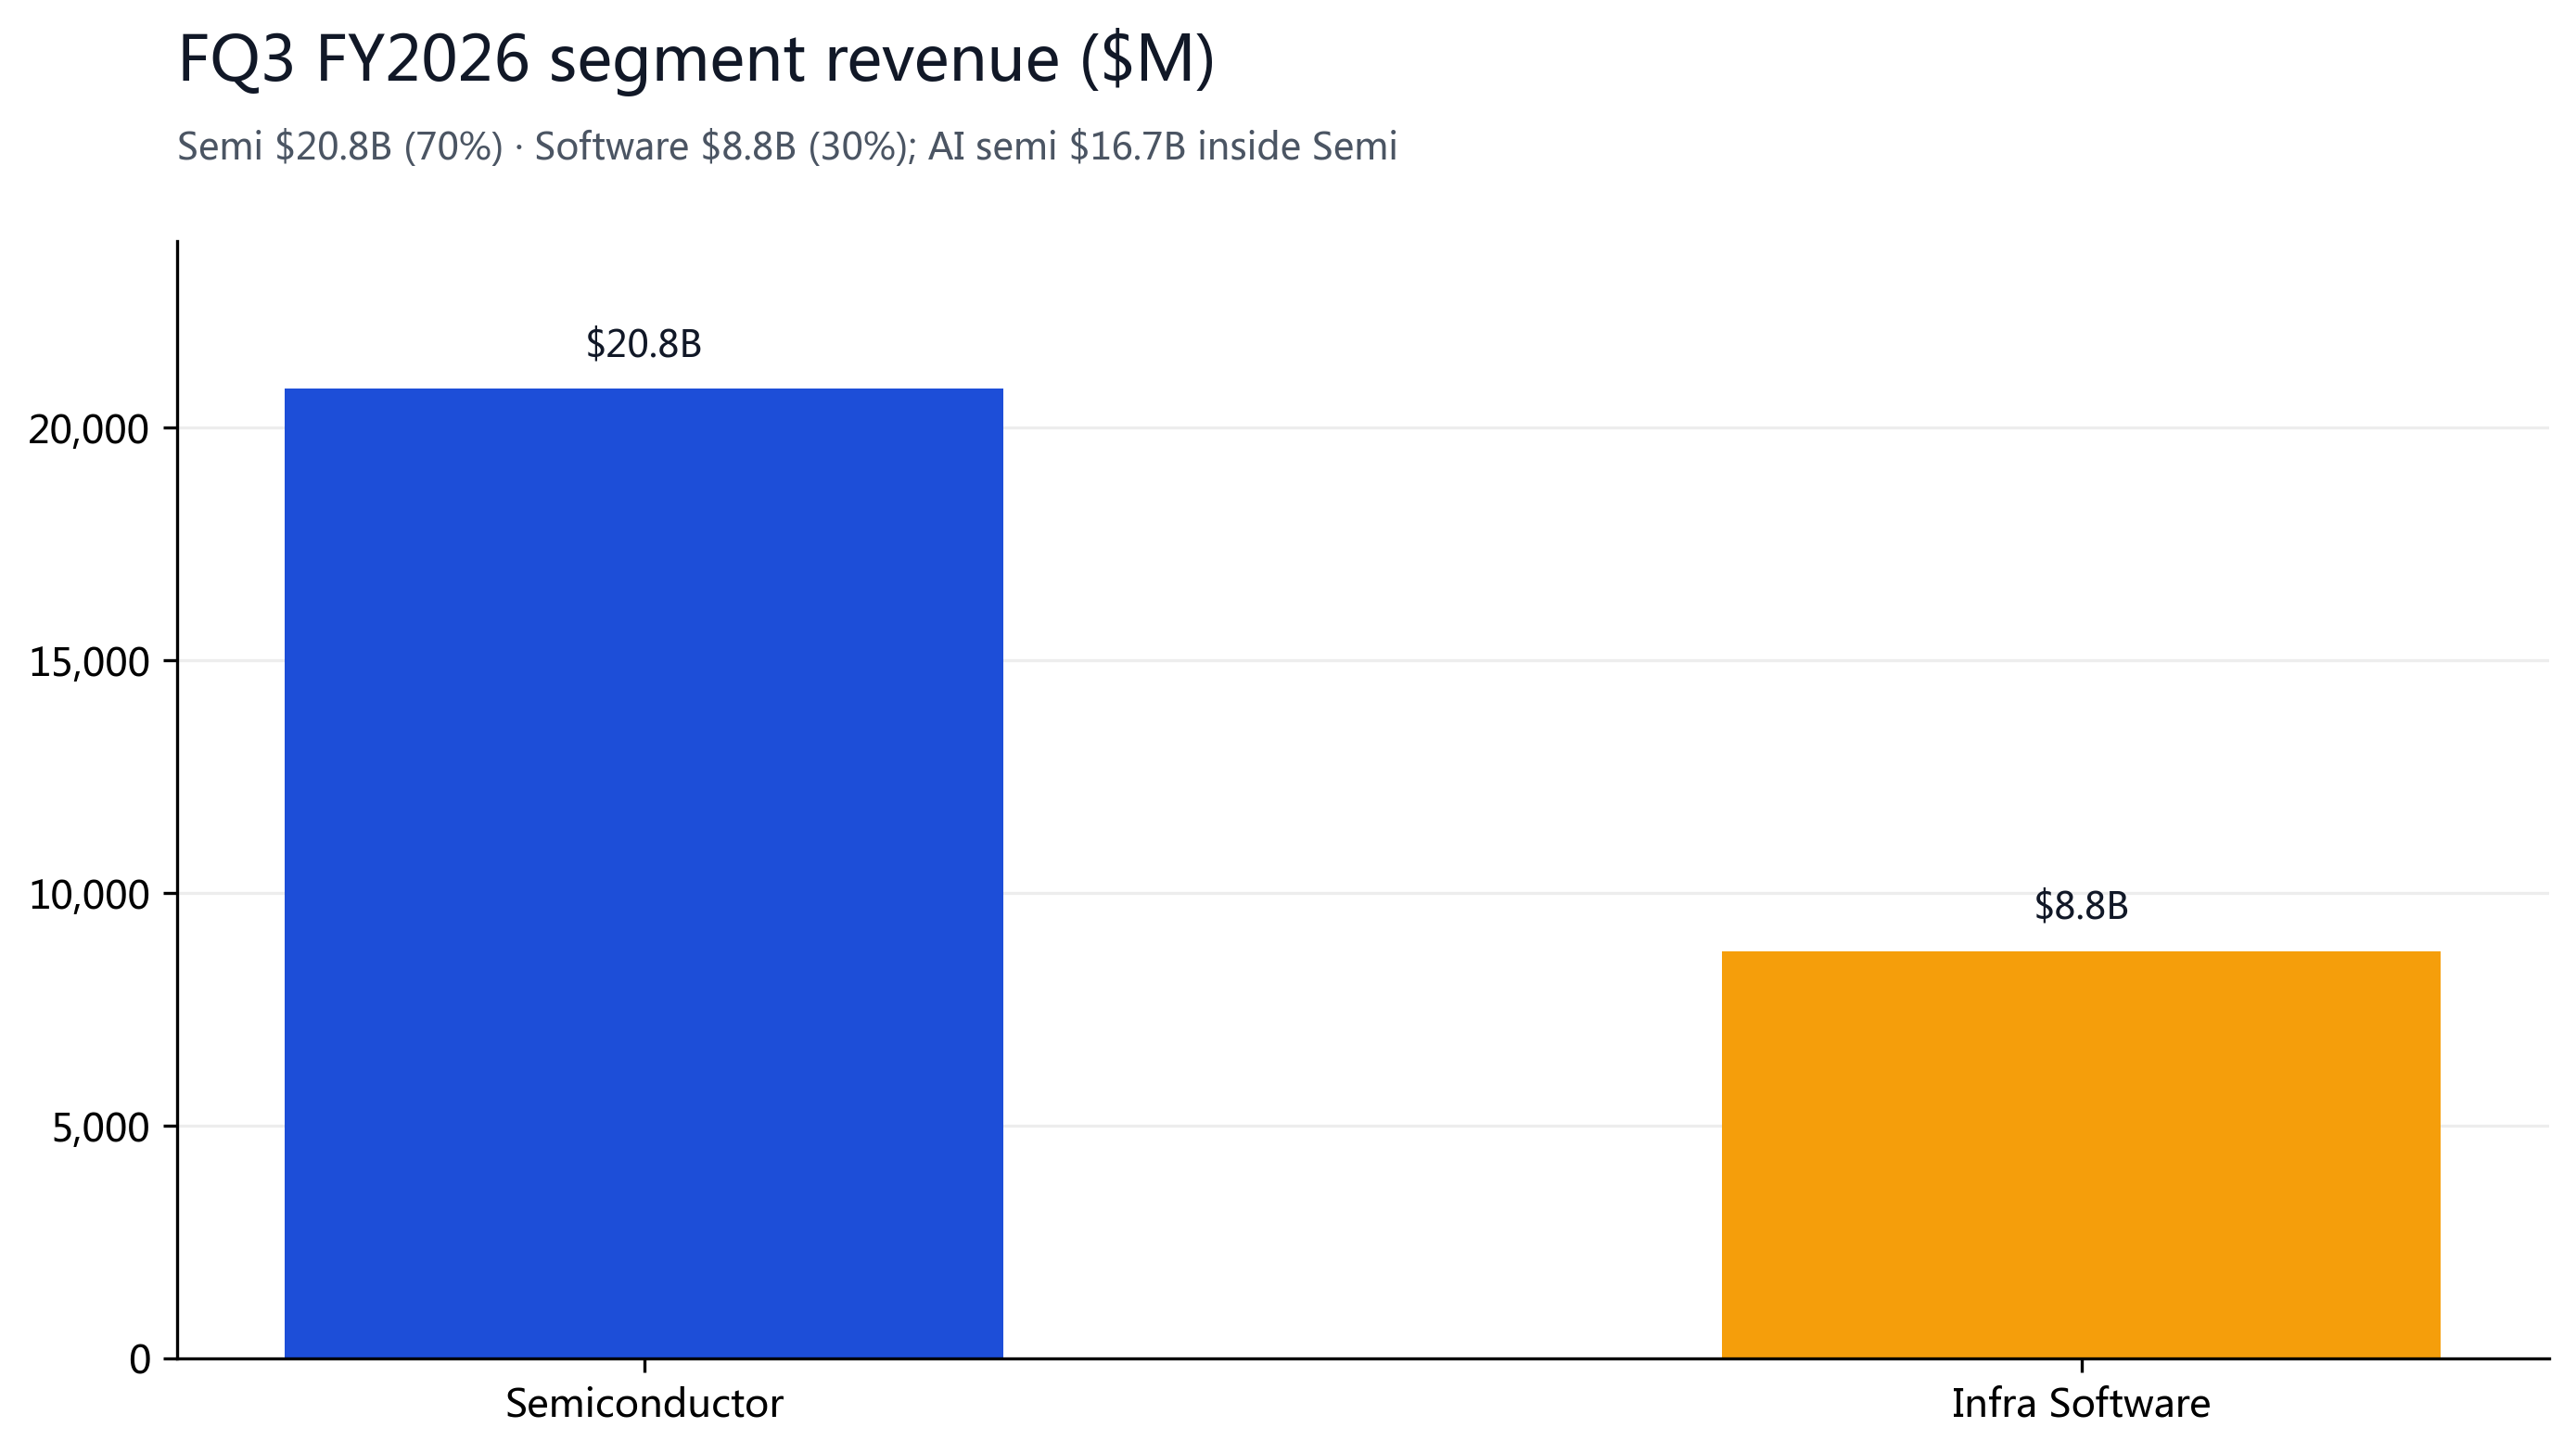
FQ3'26 revenue of $29,591M (+86% YoY, beating the $29.47B consensus by +$0.12B); non-GAAP gross margin 74.0% (down from 77.1% prior as custom-AI-semi mix rose); GAAP EPS $2.68 (non-GAAP $3.32, vs $3.21-3.24 consensus, a +8-11% beat); GAAP net income $13,088M; semiconductor solutions $20.8B (70% of revenue, AI networking + custom compute), infrastructure software $8.8B (30%). Free cash flow $13.67B (46% conversion), operating cash flow $14.20B; cash & investments $24.0B. Another consecutive revenue record, AI semi $16.7B (+221% YoY).
| Metric (FQ3'26) | Actual | Consensus | Diff | Note |
|---|---|---|---|---|
| Total revenue | $29.59B | $29.47B | beat +$0.12B | +86% YoY |
| GAAP EPS | $2.68 | — | — | non-GAAP $3.32 (consensus $3.21-3.24) |
| non-GAAP gross margin | 74.0% | 77.1% prior quarter | -3pp | Custom AI semi mix up |
| Semi / Software | $20.8B / $8.8B | — | 70% / 30% | AI semi $16.7B inside Semi |
| Free cash flow | $13.67B | — | 46% conversion | OCF $14.20B |
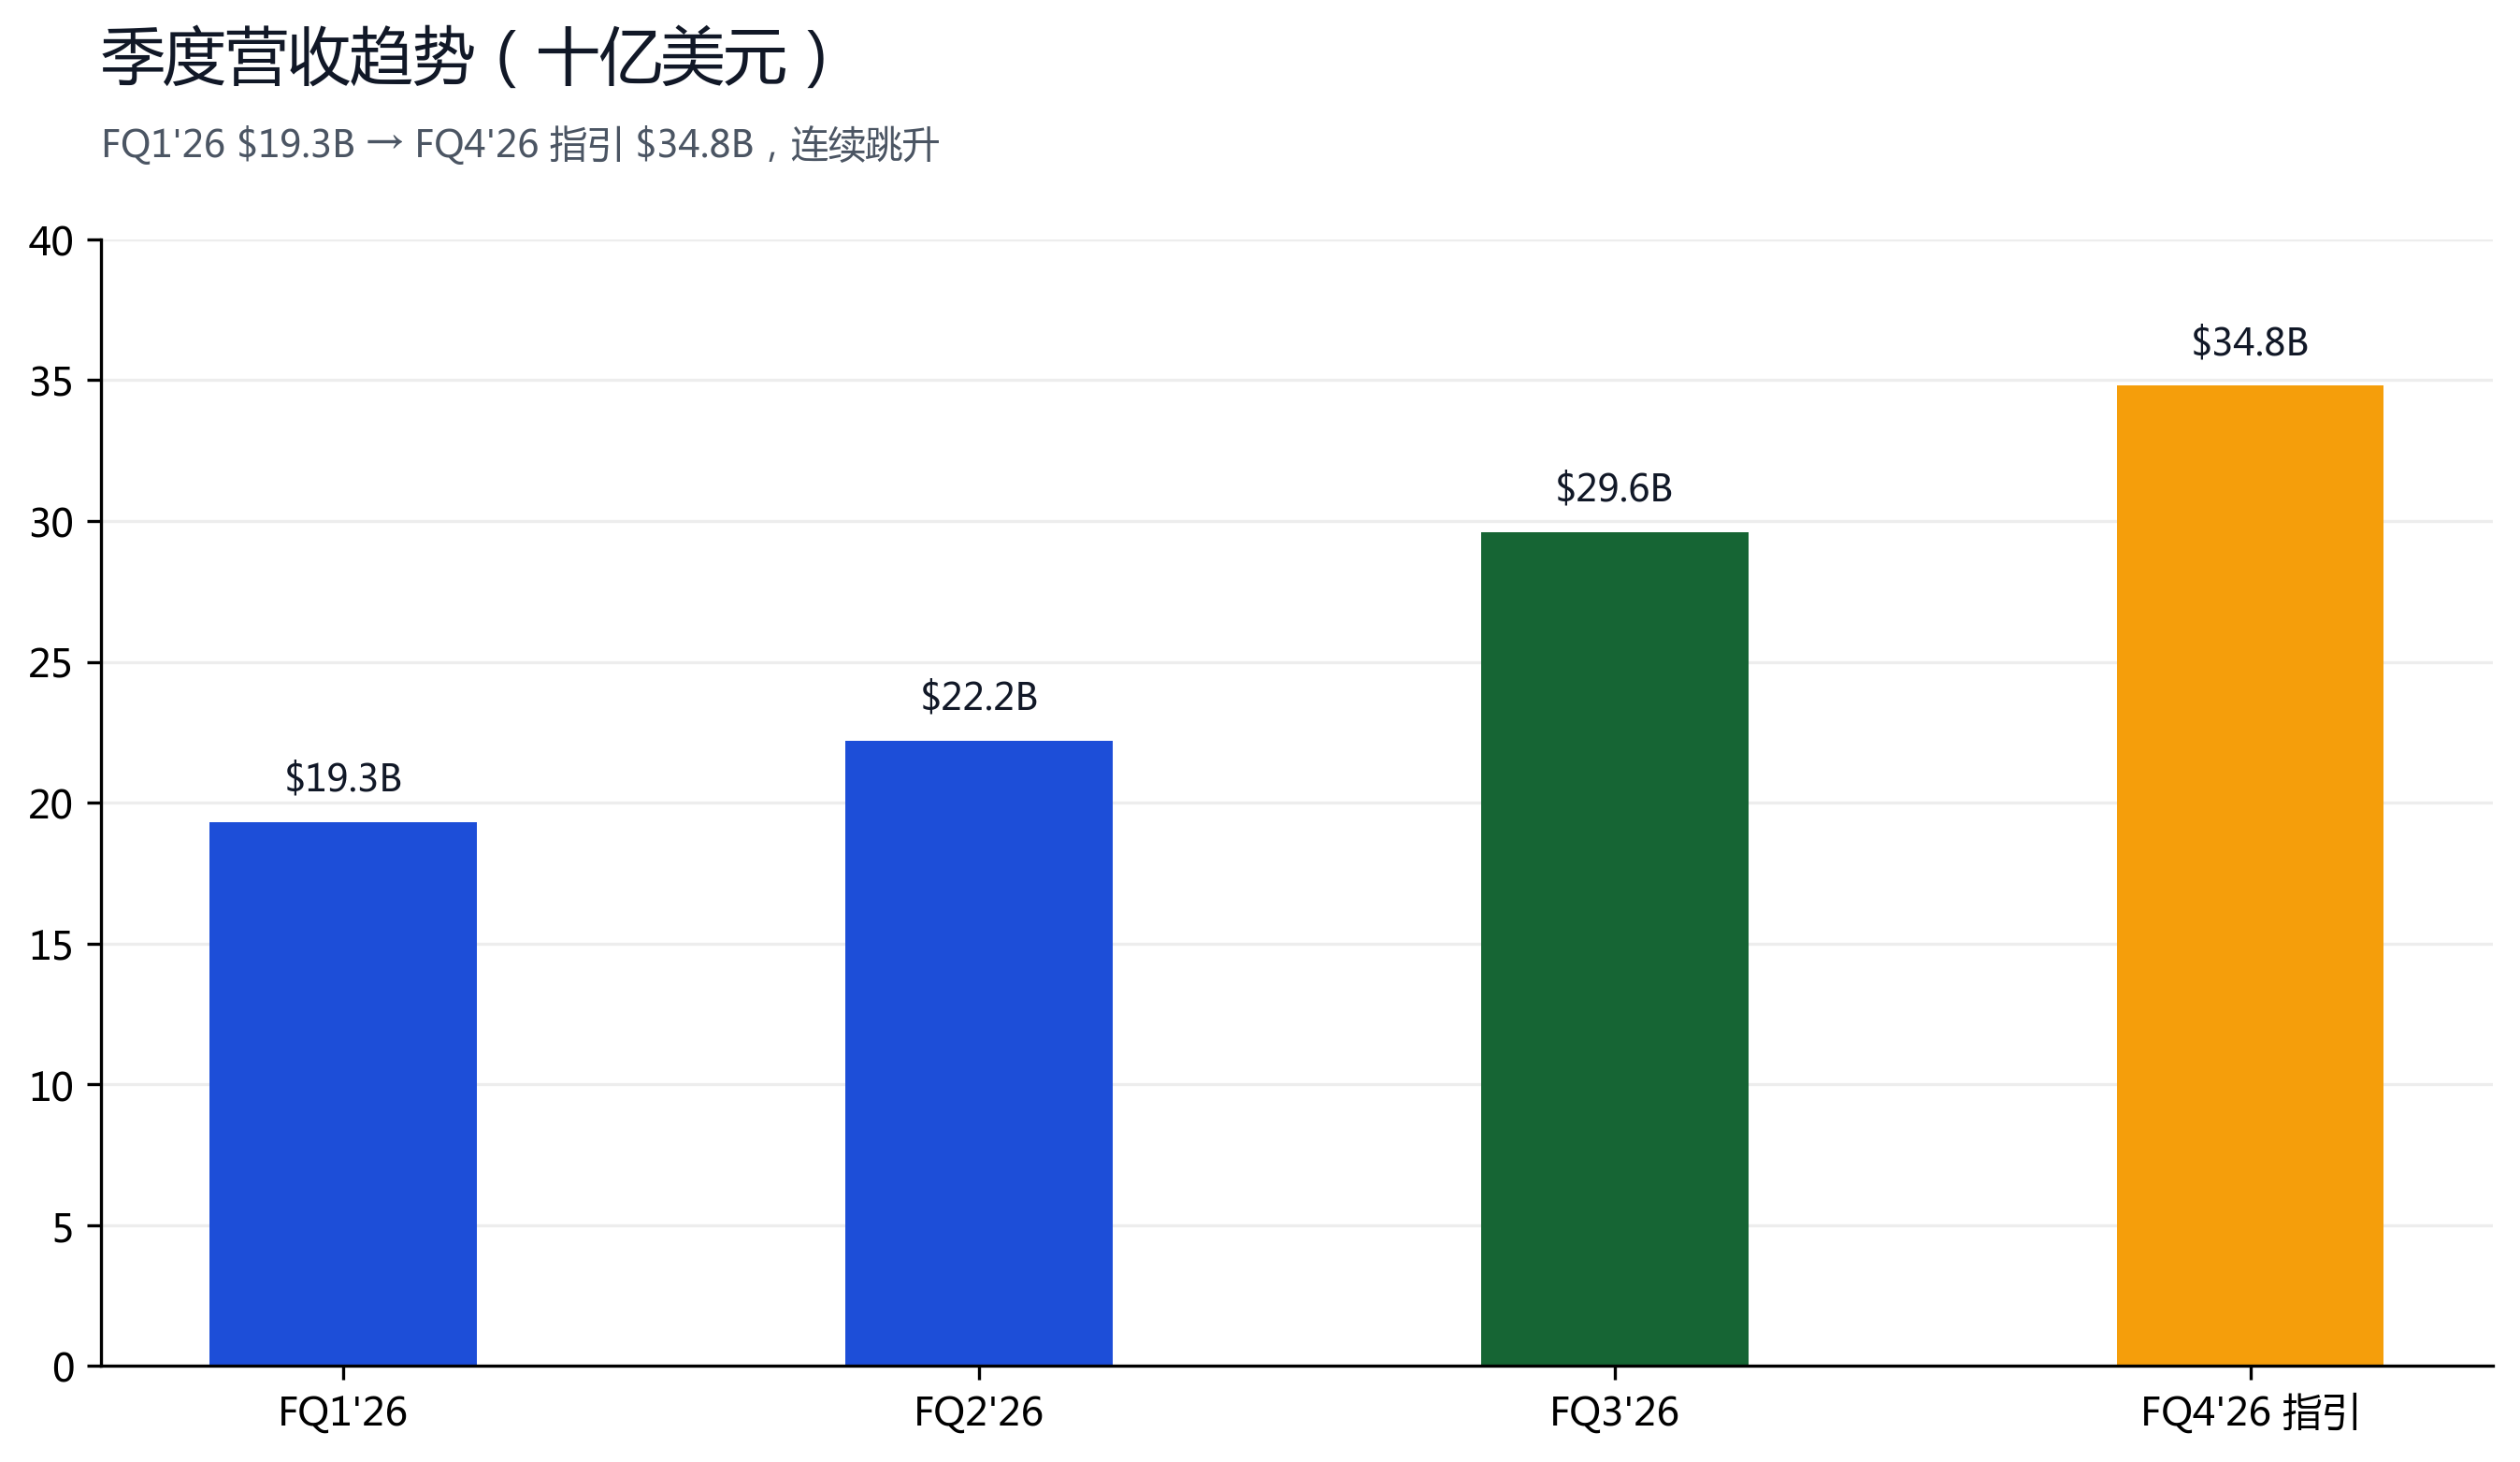
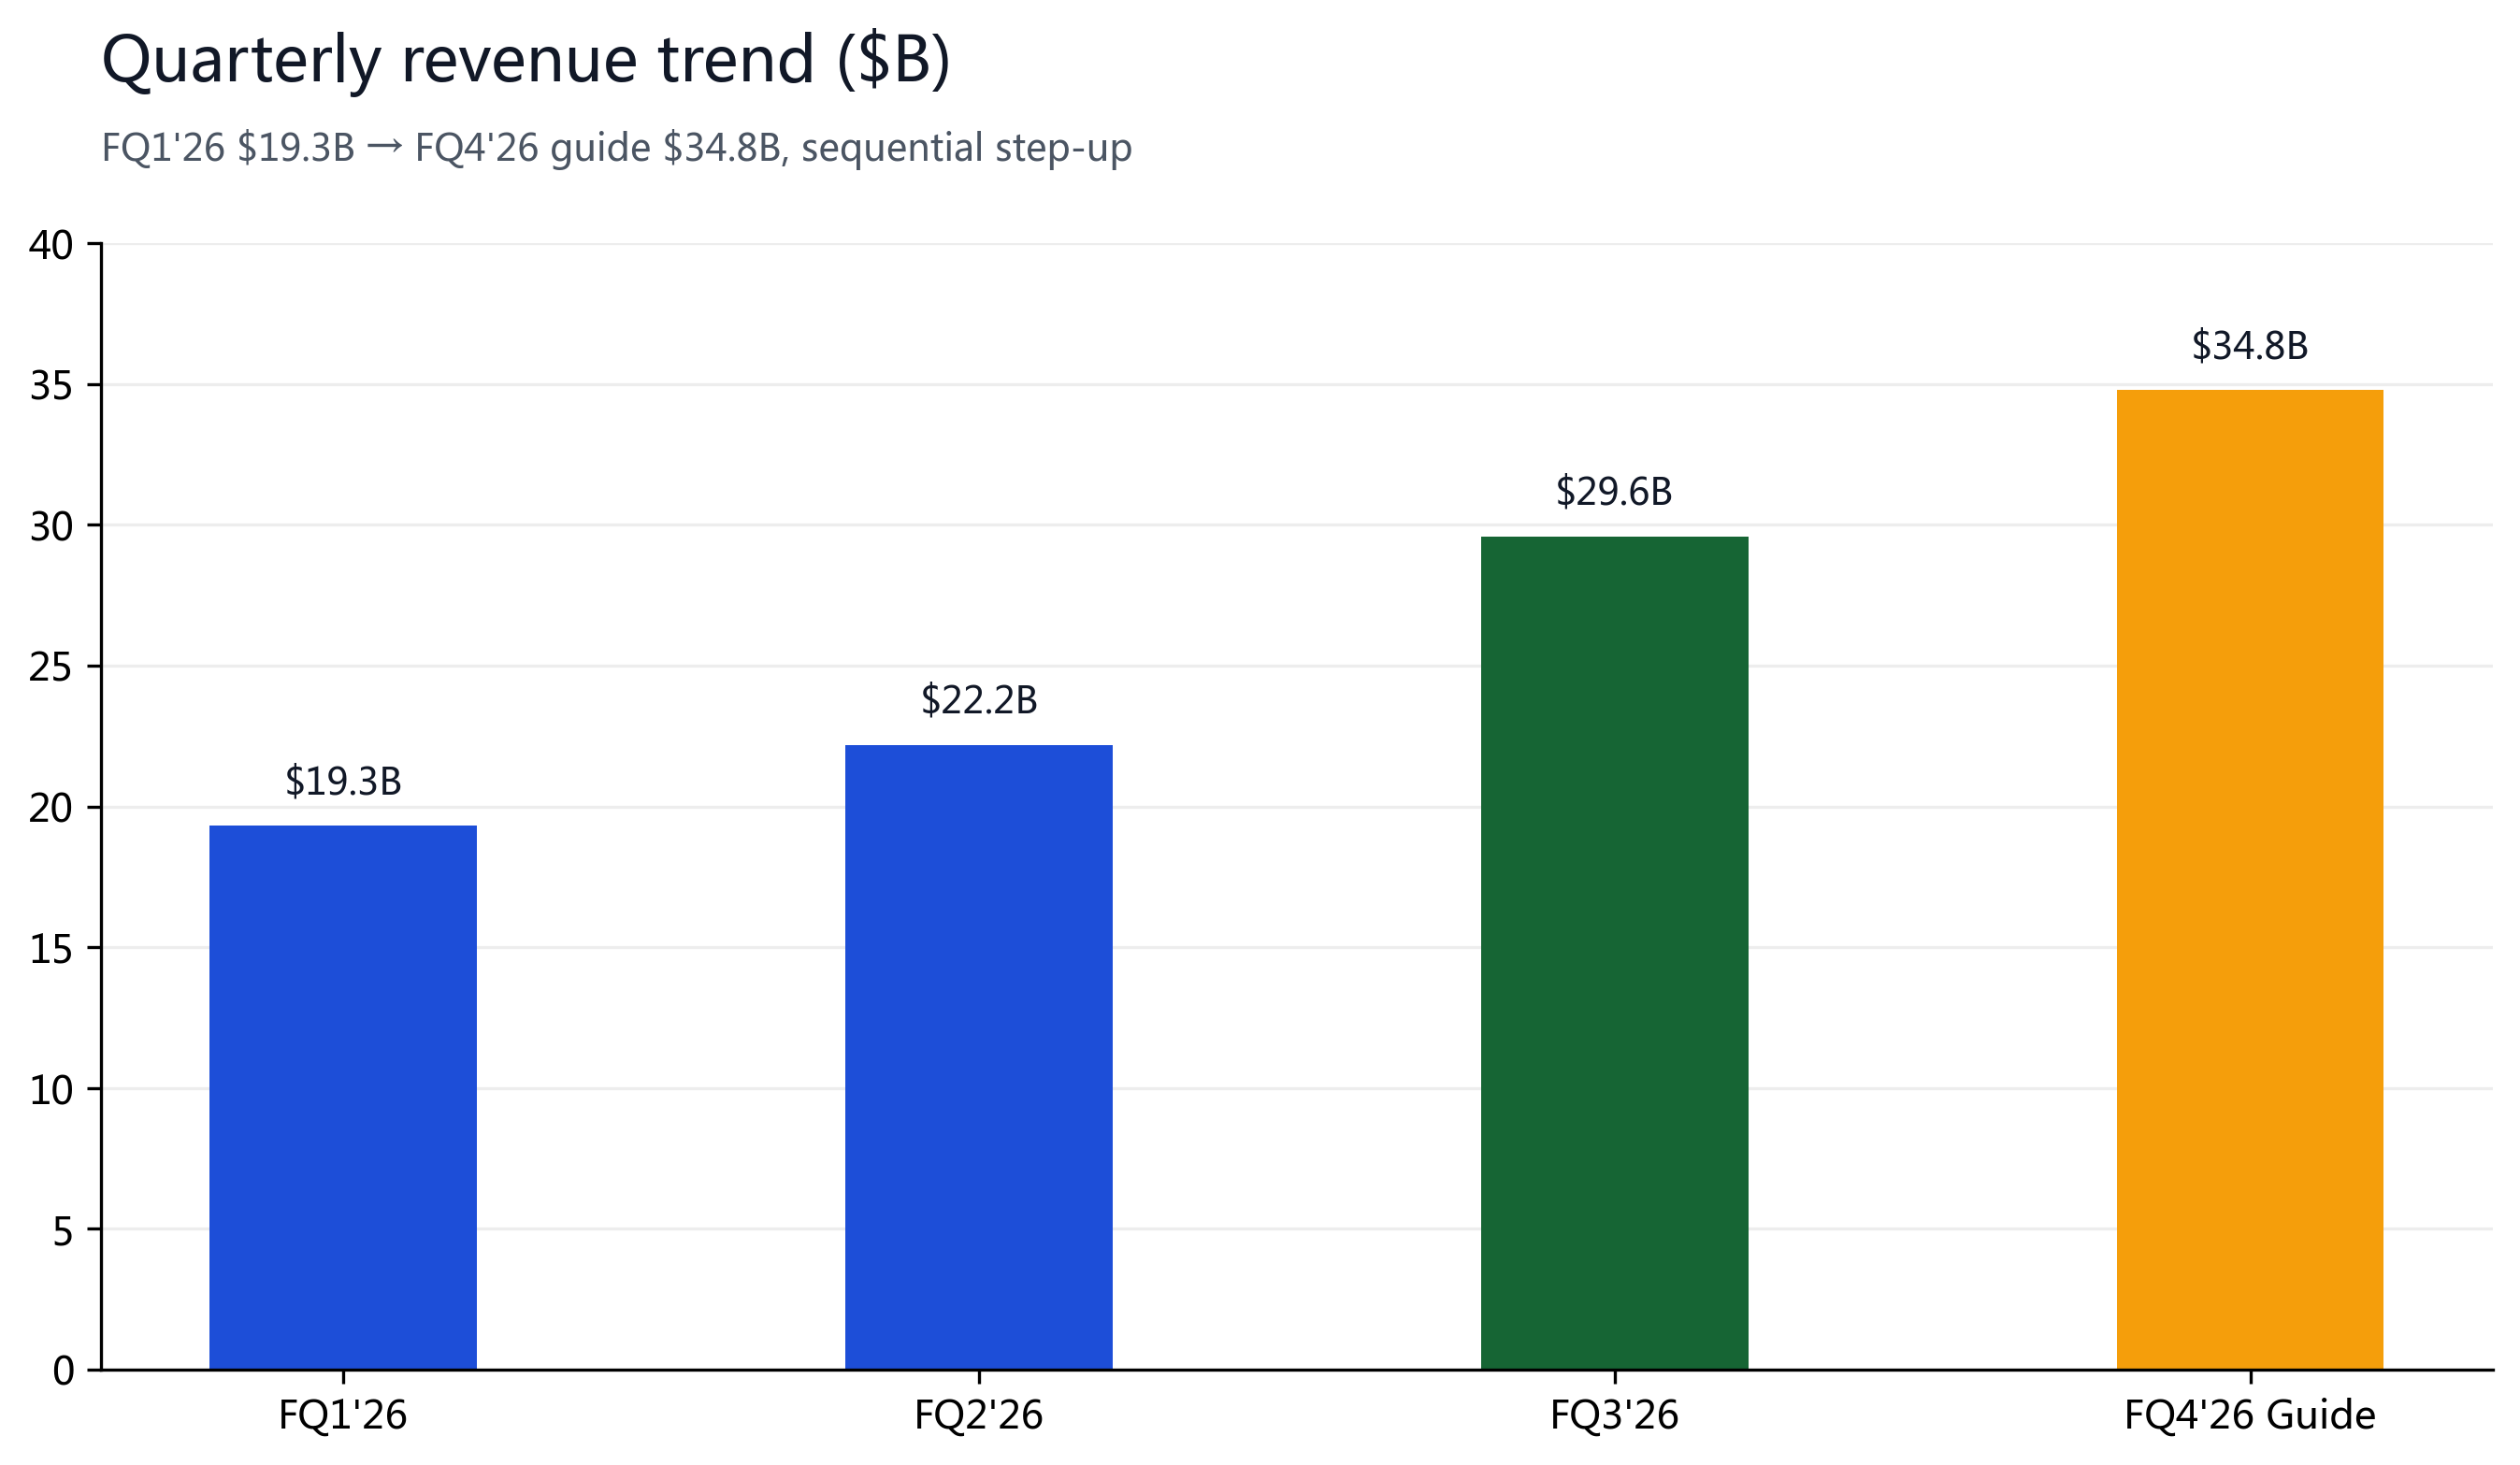
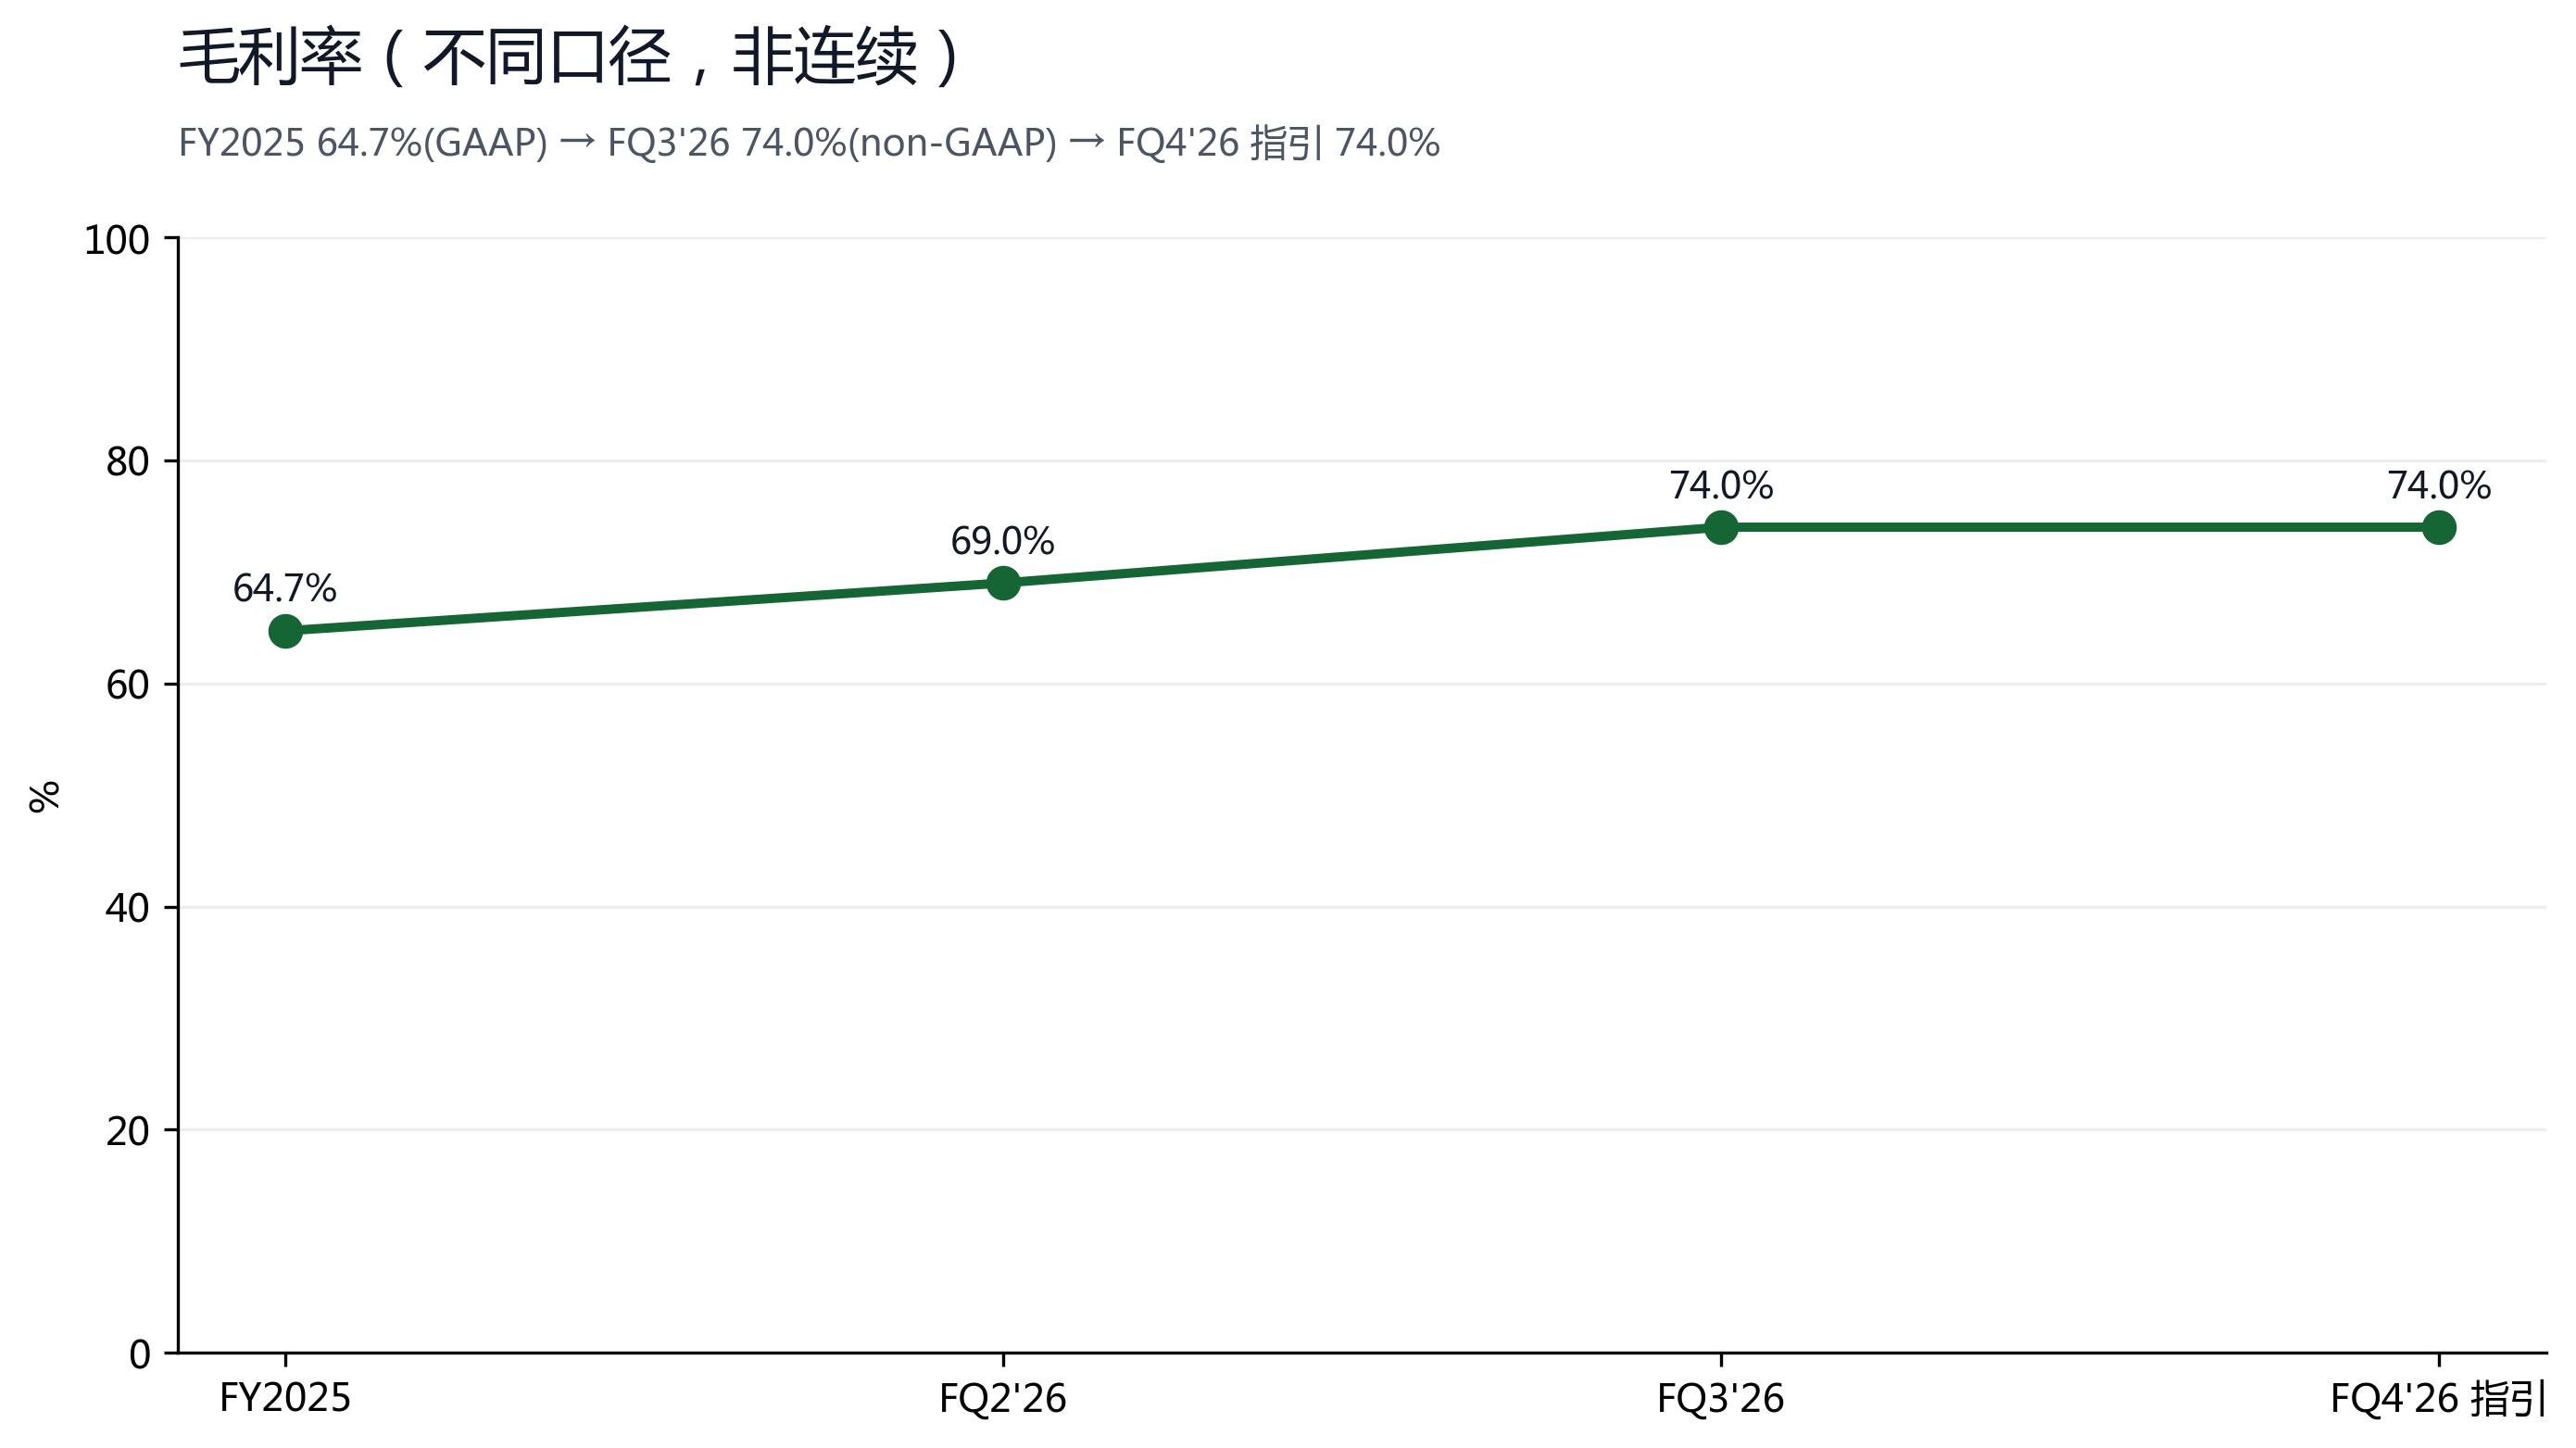
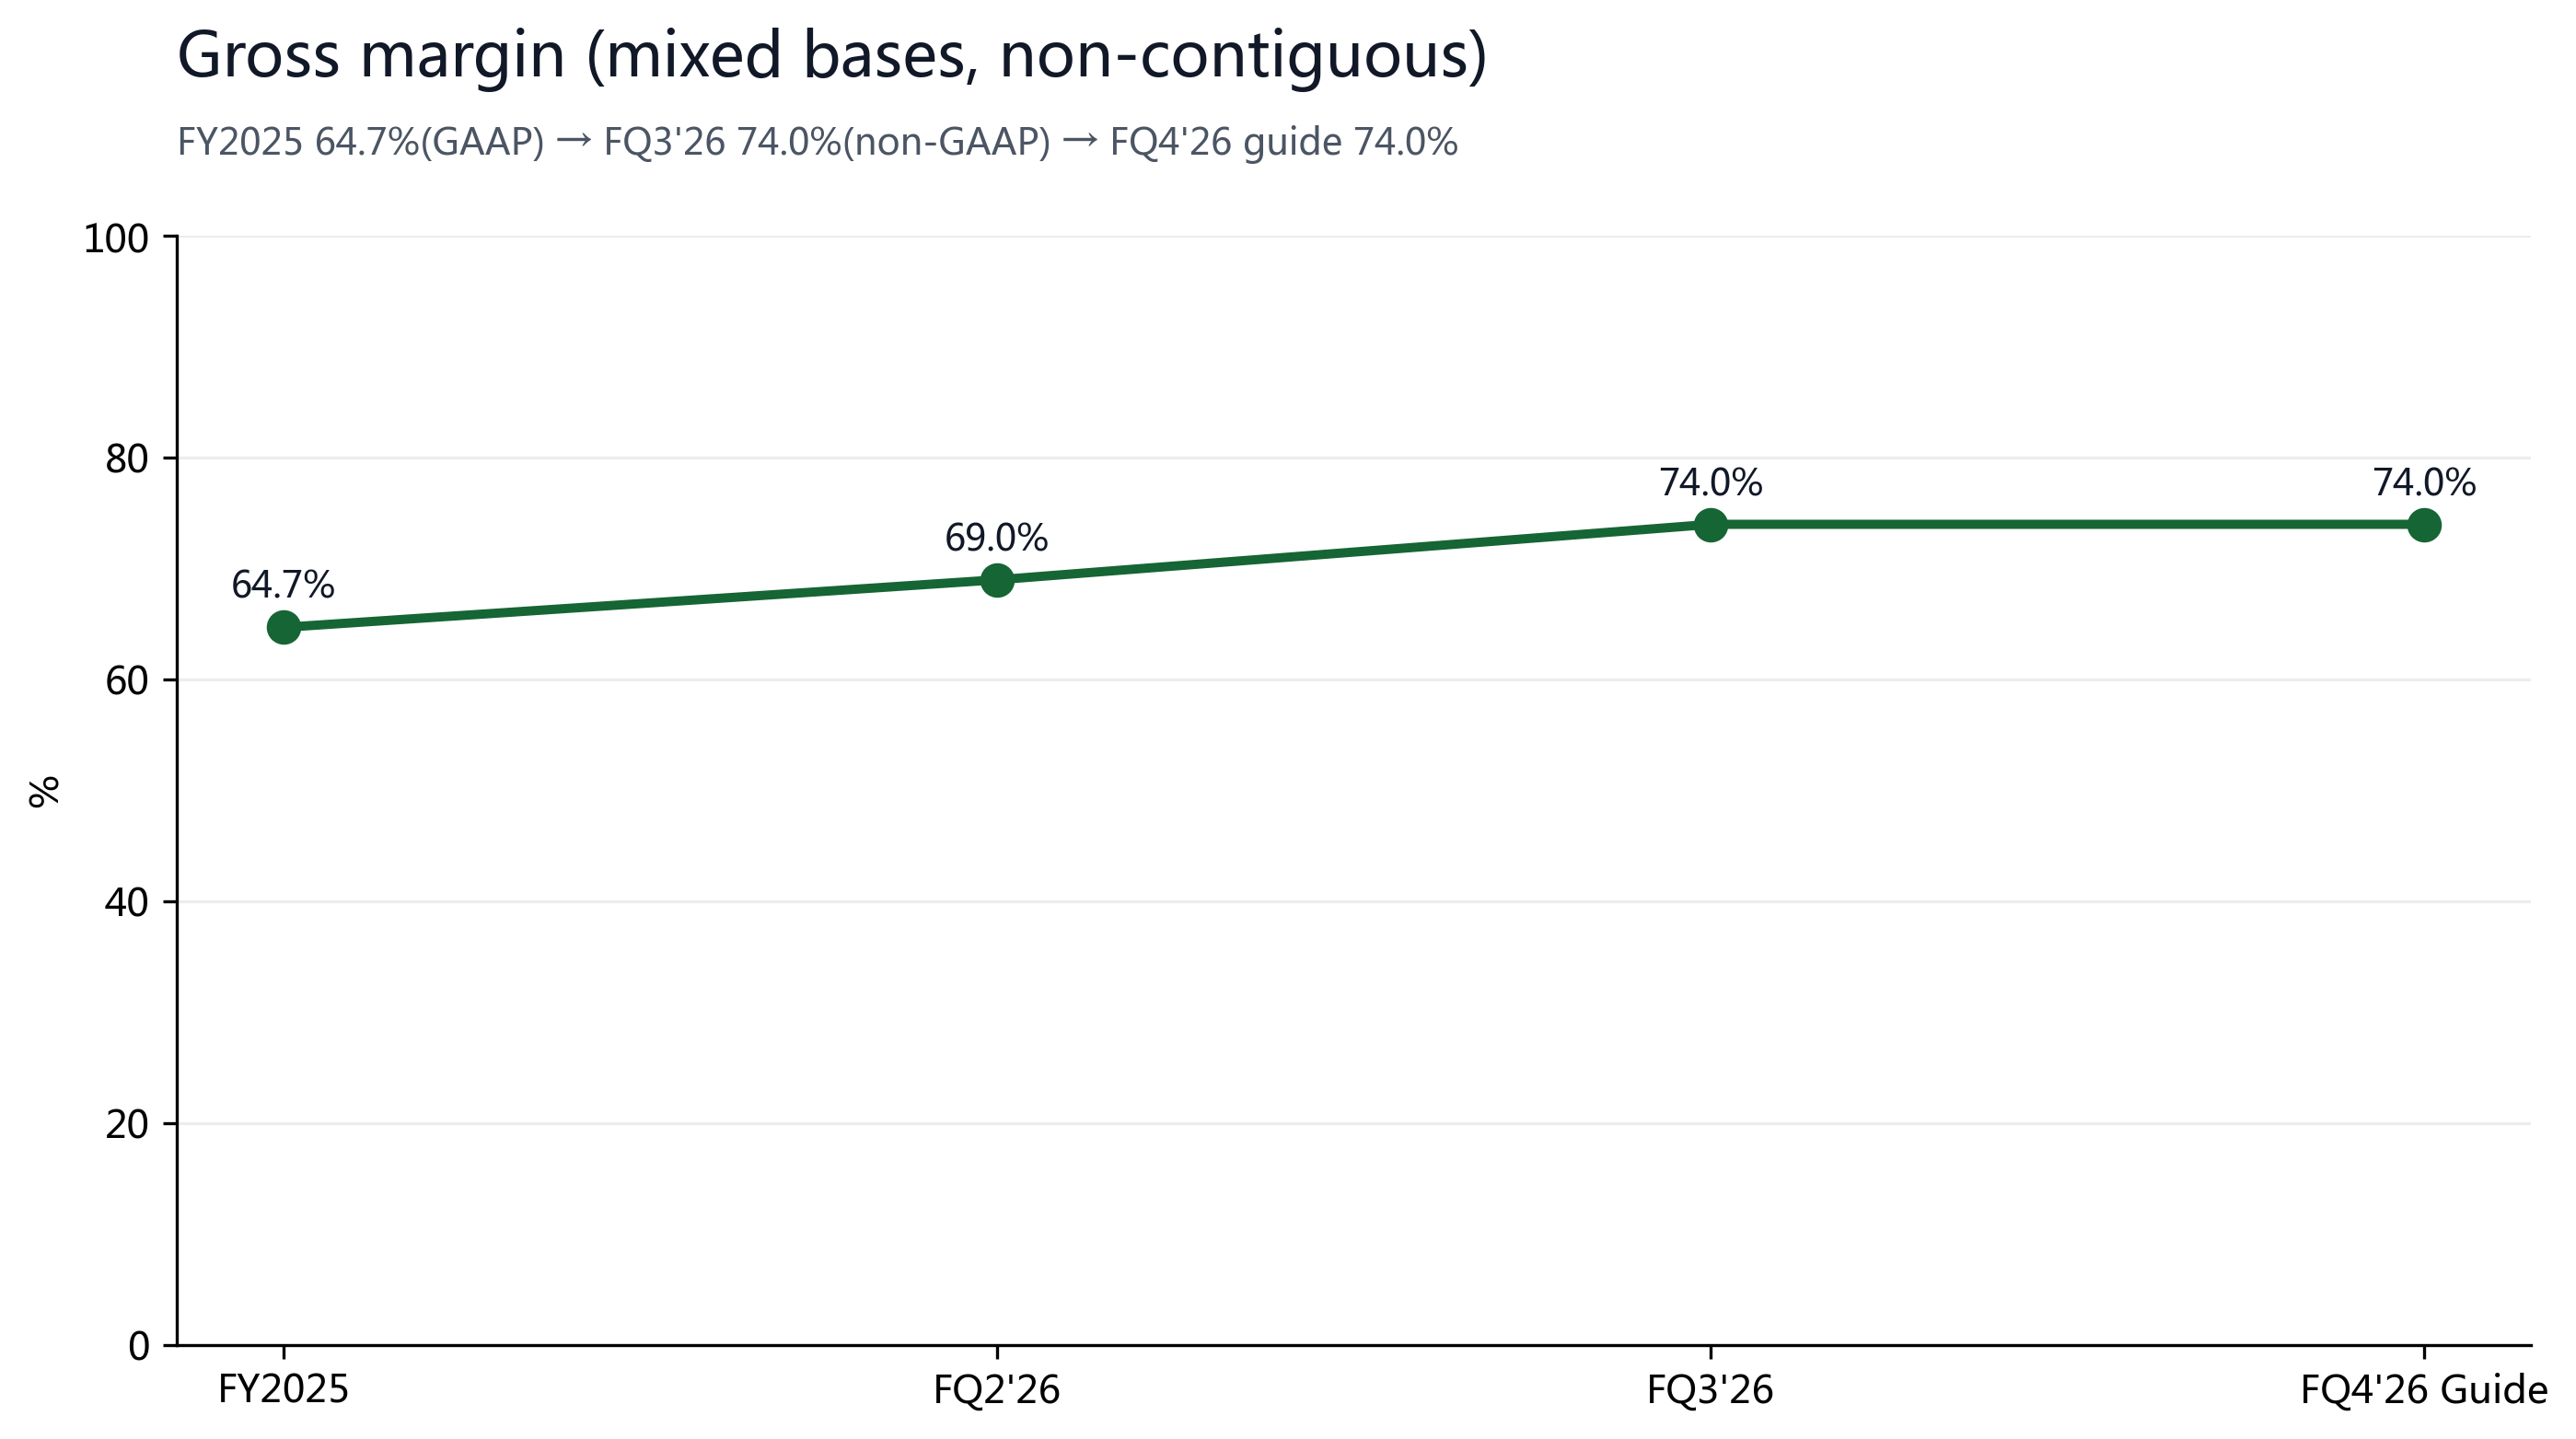
Quarterly trajectory (Broadcom IR / 10-Q, $M): revenue FQ1'26 $19,311 (derived H1-FQ2) / FQ2'26 $22,187 / FQ3'26 $29,591 / FQ4'26 guide $34,800 — sequential step-up; gross margin FY2025 64.7%(GAAP) → FQ2'26 69.0%(GAAP) → FQ3'26 74.0%(non-GAAP) stepping up (mixed bases, non-GAAP higher recently); EPS (GAAP) $1.91 (FQ2'26) → $2.68 (FQ3'26). FQ4'26 guide revenue $34.8B (+93% YoY), AI semi $21.7B (+236% YoY), non-GAAP operating margin 66.0% — if delivered, FY2026 revenue reaches $106B with AI semi $58B.
| Quarter ($M) | FQ1'26 | FQ2'26 (10-Q) | FQ3'26 | FQ4'26 Guide |
|---|---|---|---|---|
| Revenue | 19,311 | 22,187 | 29,591 | 34,800 |
| Semiconductor | — | 15,009 | 20,839 | AI $21.7B |
| Software | — | 7,178 | 8,752 | — |
| Gross margin | — | 69.0% | 74.0% | 74.0% |
| Diluted EPS (GAAP) | — | $1.91 | $2.68 | — |
Cash flow (Broadcom IR / 10-Q, $M): FQ3'26 OCF $14,197, FCF $13,665 (46% conversion); FY2025 OCF $27,537, FCF $26,914 — extremely high cash conversion supports ongoing buybacks and dividends ($0.65/quarter). Cash & investments $24.0B, solid net-cash position (Broadcom carries modest net debt but FCF easily covers it). FY2026 capex stays elevated for advanced packaging and custom capacity, yet FCF remains at record levels.
§05Peer Comps
Broadcom sits in a 'dual-oligopoly' of AI infrastructure: AI networking (Ethernet switching Tomahawk/TH) and custom compute (3 hyperscalers' bespoke ASICs) — complementary to, not a direct substitute for, NVDA's general-purpose GPUs; on software, VMware subscription benchmarks against legacy enterprise software. The differentiator: Broadcom is among the few with 'AI-network patent ecosystem + multi-year custom-compute contracts + high-margin software cash flow', and is pure US design & manufacturing (geopolitical hedge). Note: this report does not fetch peer exact financials/valuation multiples; the AI-semi three-year guide below is the quantitative anchor for 'relative competitiveness', with precise peer-multiple comps to be sourced later.
AI capex is the core industry driver: hyperscalers (Microsoft, Google, Amazon, Meta, OpenAI et al.) and Broadcom's custom-chip commitments confirm demand intensity — the FY2028 AI-semi $230B guide is management's endorsement of multi-year customer lock-in. On rates, Broadcom is a high-beta (1.47) growth stock; a 10Y rise pressures high multiples, but at only 18.8x FY27E with strong cash flow and a stable dividend, its rate sensitivity is lower than pure-expectation growth names. Dollar & trade policy: US design & manufacturing favors Broadcom (vs some overseas peers), but tariffs and China export controls cut both ways. Overall macro is strongly tailwind for 'AI-infrastructure build' and sensitive to 'customer concentration + cycle reversal' — the source of Broadcom's valuation dichotomy.
§06Ownership Structure
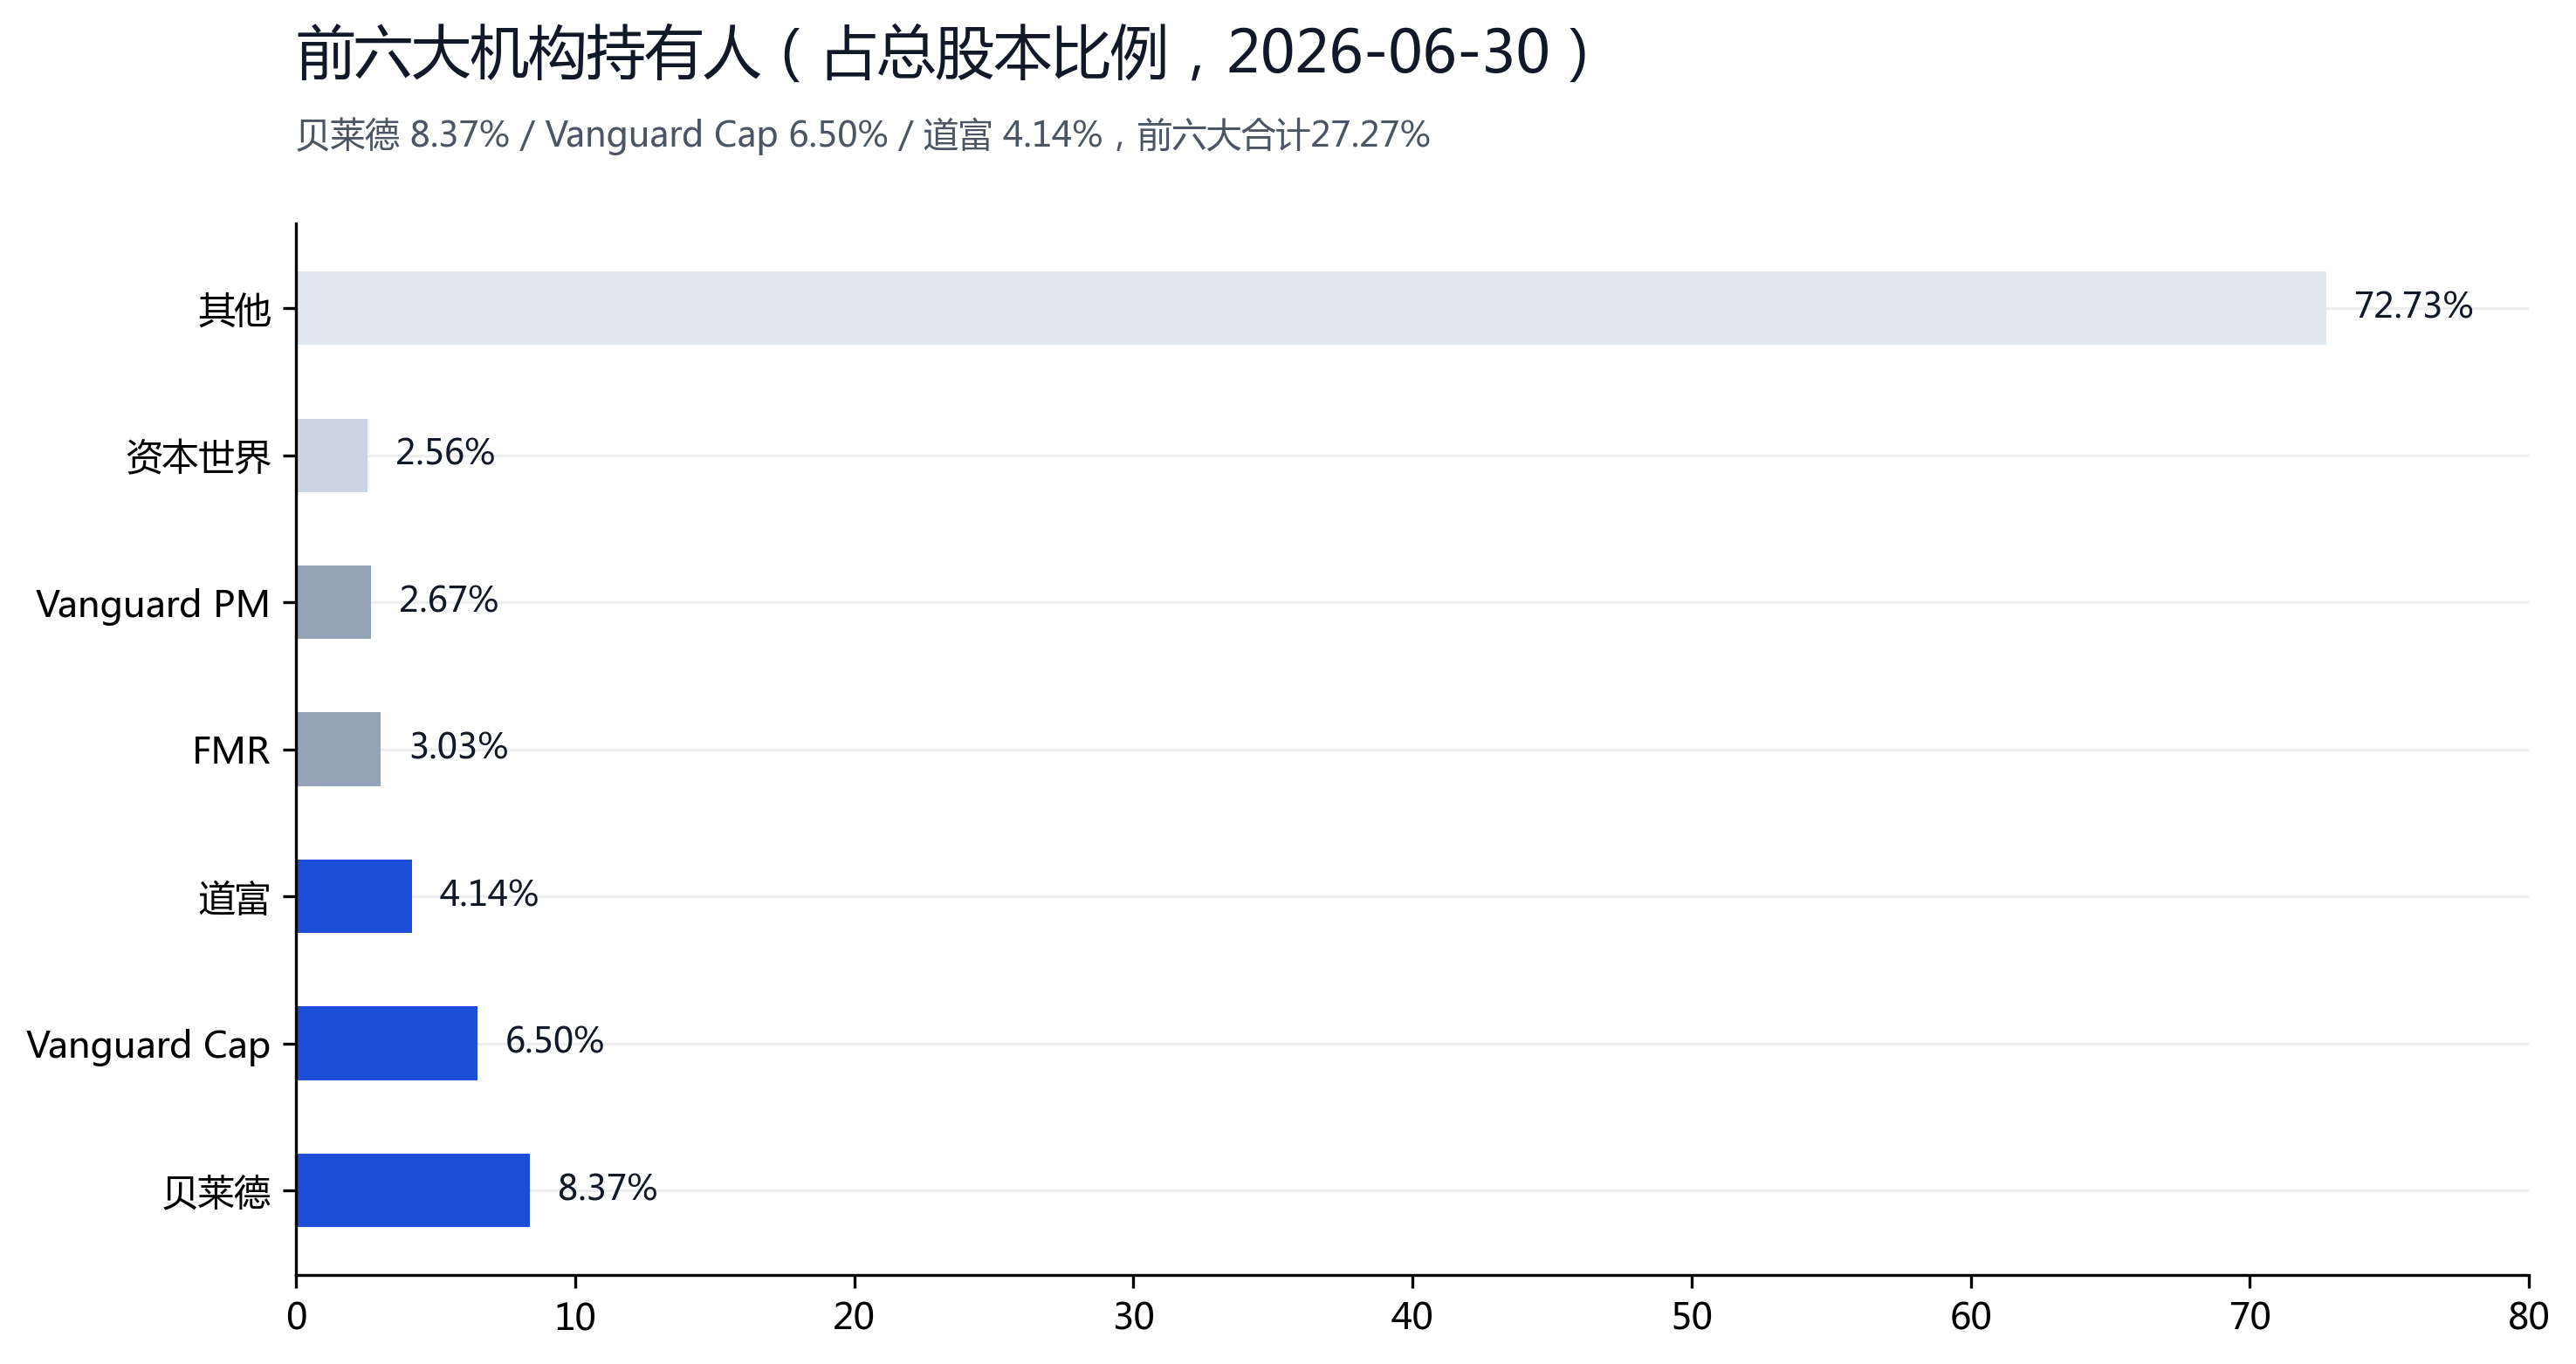
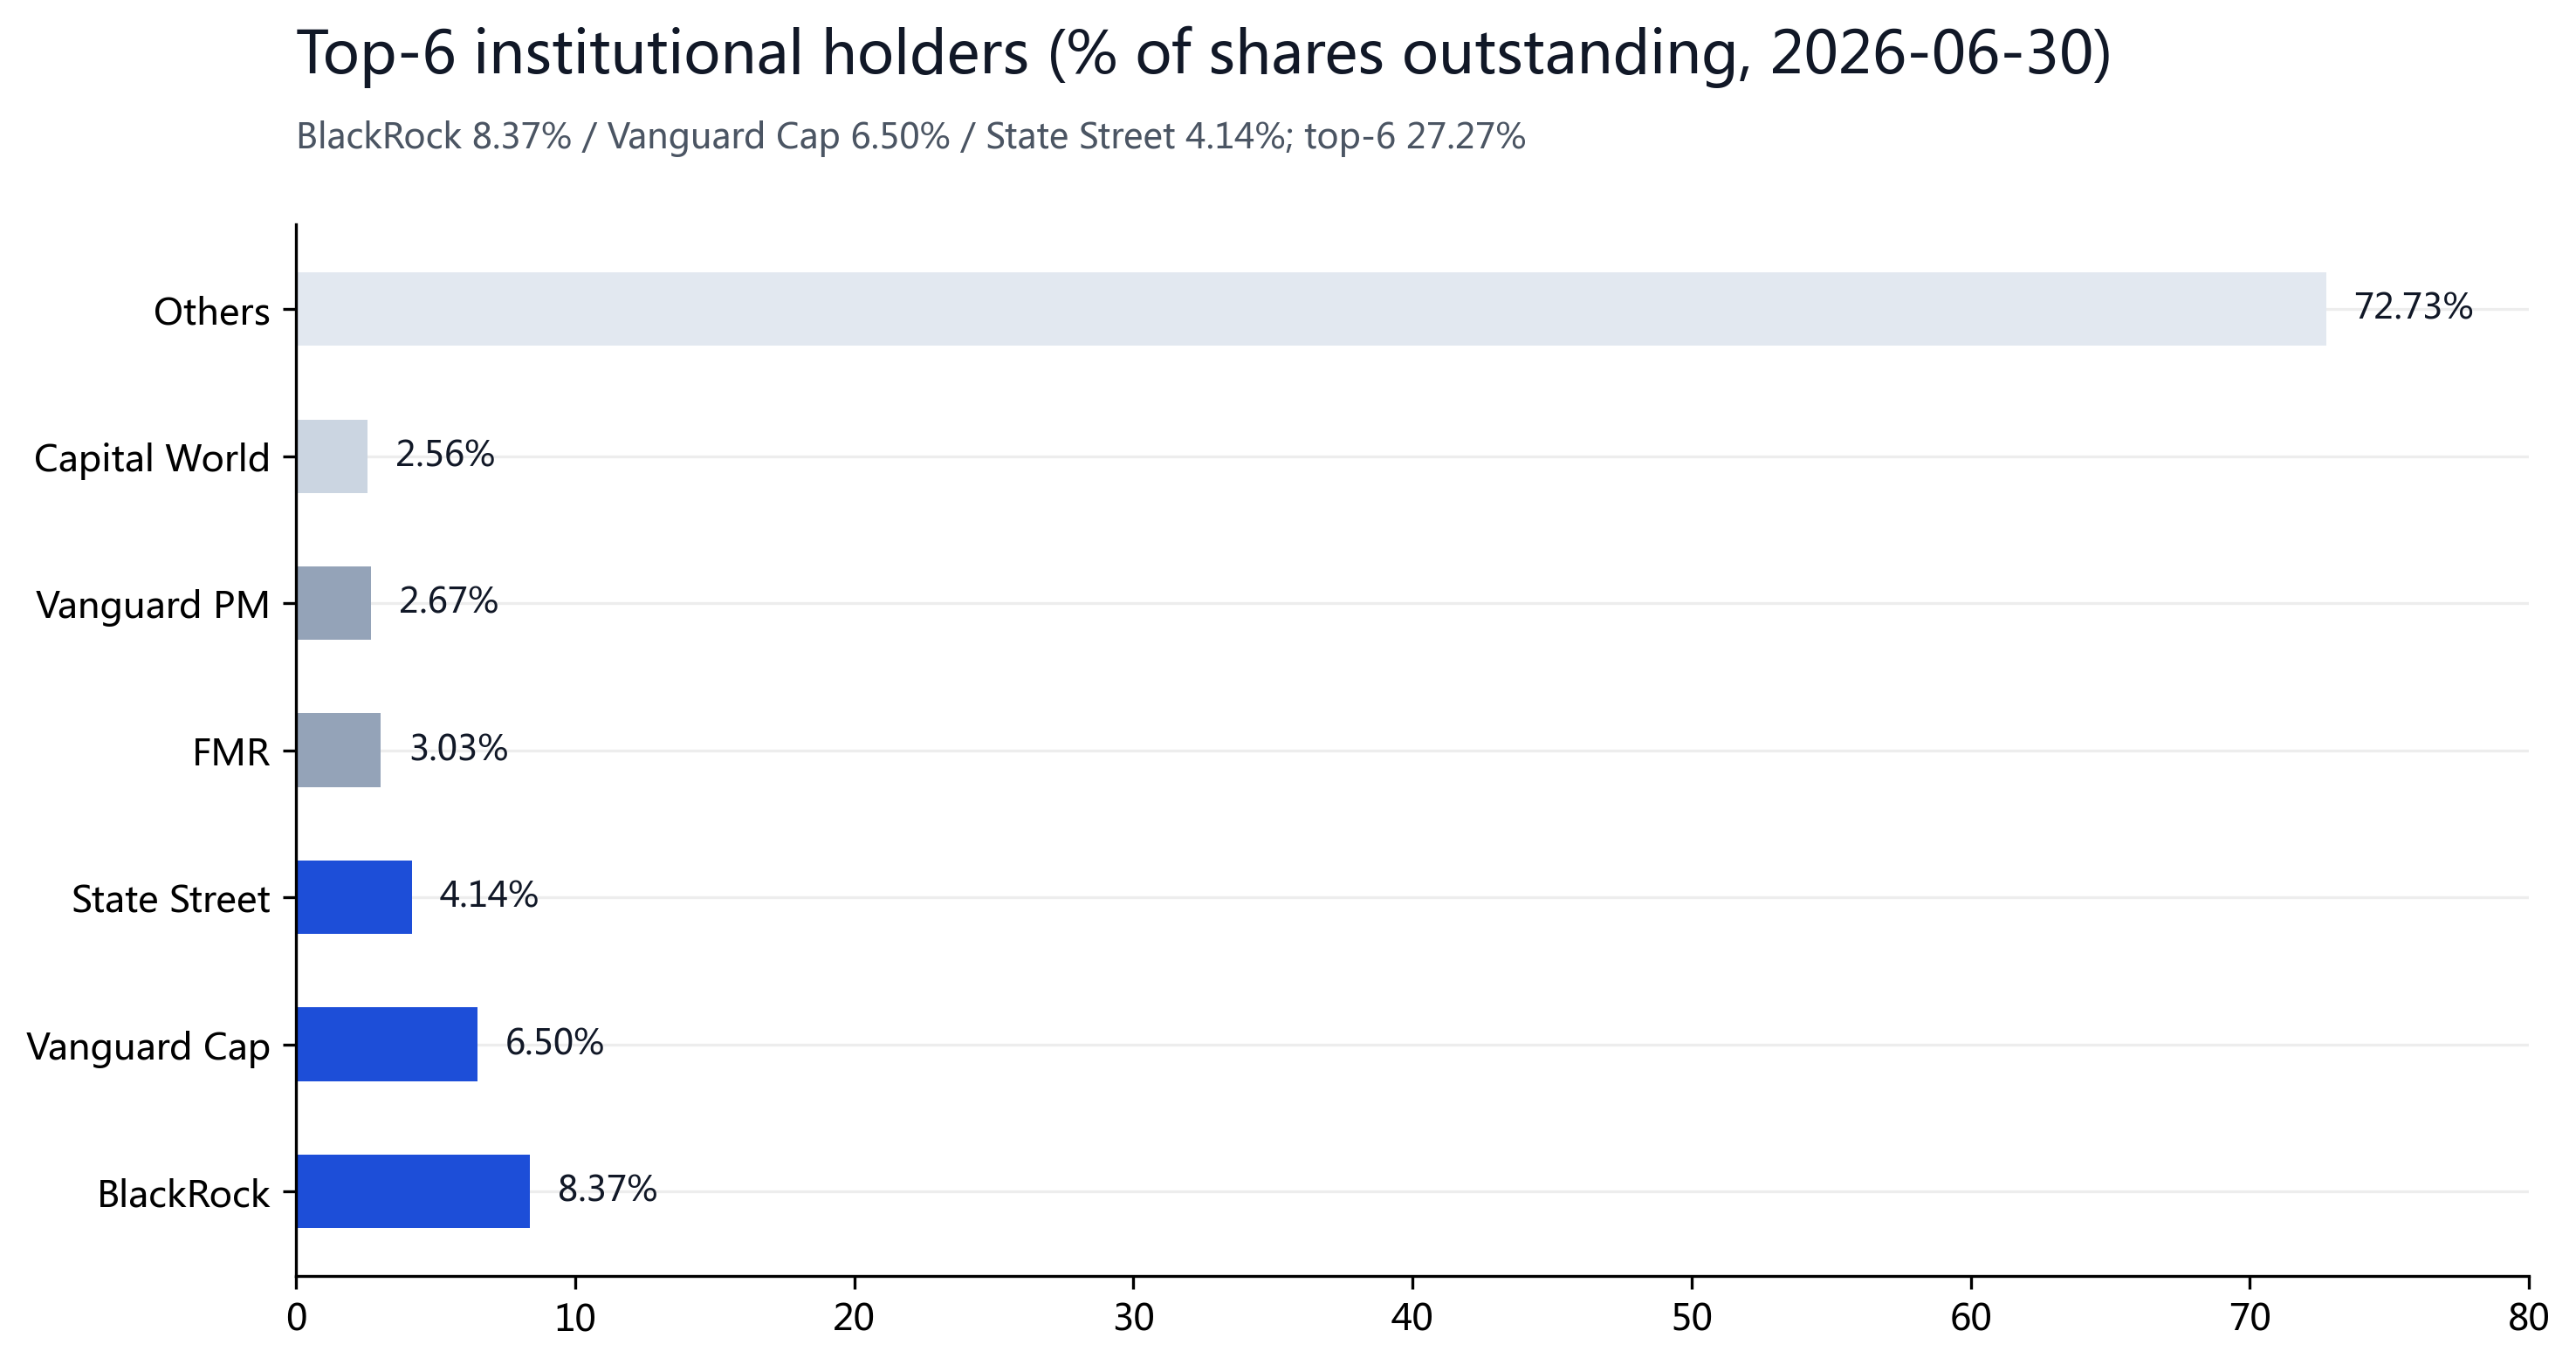
Institutions are concentrated (NeoData top-10 holders, 2026-06-30): BlackRock 8.37%, Vanguard Cap 6.50%, State Street 4.14%, FMR 3.03%, Vanguard PM 2.67%, Capital World 2.56%. Top-6 27.27%. Congressional level (QuiverQuant): 8-12 trades in 6 months (range in count/direction, small size), not a directional signal. Insider level: 146 trades in 6 months, 1 buy / 145 sells; co-founder Henry Samueli 38 sales ($500M), mostly scheduled 10b5-1.
§07Valuation & Price Target
Broadcom is profitable with exploding earnings (FY2025 GAAP EPS $4.77, FY2027E consensus EPS $19.57), but the FY2025 77.0x anchors to pre-peak-cycle earnings, unreliable for a semi company. Under a 'semi remains cyclical, but this cycle is structural via AI networking + custom compute' framework: a FY2027E consensus EPS base ($19.57, validated by Yahoo/MarketWatch/Trefis across multiple sources) plus Forward P/E tiers (Bear 22x, Base 27x, Bull 32x) gives: Bear $430 = 22x (customer cut, ASP compresses — $2.05T mcap); Base $528 = 27x (AI-network oligopoly + custom contracts deliver, gets a growth multiple — $2.52T mcap); Bull $626 = 32x (AI re-rating, FY2028 $230B delivers, near but below the $715 sell-side high — $2.98T mcap). Probabilities 25/45/30, weighted $533, with a 12-month base target of $528 (+43.8% vs spot). Rating and scenarios are self-consistent: bull $626 > spot $367.24 > bear $430; weighted $533 > spot. We do not adopt the $715 consensus high — at an 18.8x-forward market it is rich, and under-prices 'customer concentration + cycle may return'; our Base $528 already applies a limited premium for concentration (Method Dispersion: VM Base $528 vs Street consensus avg $535.25 differ by 1.4%, ≤10%, triangulated).
| Scenario | FY2027E EPS x P/E | PT | Weight |
|---|---|---|---|
| Bear | $19.57 × 22x / 4,766M shs | $430 | 25% |
| Base | $19.57 × 27x / 4,766M shs | $528 | 45% |
| Bull | $19.57 × 32x / 4,766M shs | $626 | 30% |
| Weighted PT | 0.25×430 + 0.45×528 + 0.30×626 | $533 | 100% |
Entry pacing: at 18.8x FY27E already attractive, but customer concentration + insider 1-buy/145-sell argue against a single block — scale in: (1) initiate a base position near spot (18.8x FY27E; margin of safety from FY2028 $230B AI visibility); (2) add to target weight if FQ4'26 (Dec) delivers $34.8B / $21.7B AI semi with upward guide; (3) a pullback to 22x FY27E (below $430) is the golden entry, the bear-scenario floor.
Take-profit/stop: trim progressively if re-rated above 32x forward ($626+, bull case); if a large customer cuts, the FY2028 $230B guide is falsified, or a semi-cycle roll-over cuts guides, the downside is $430 (bear case). Key watch: FQ4'26 earnings, AI-semi customer concentration & renewals, Tomahawk/TH shipments, whether insiders resume buying.
This is for personal research reference only, not investment advice, and triggers no trade execution.
§08Catalysts & Risks
| Date / Window | Event | Direction |
|---|---|---|
| Dec 2026 | FQ4'26 earnings (tests $34.8B guide, $21.7B AI semi, 66.0% op margin) | Key test |
| Ongoing | New custom-compute customer signings / AI-network (Tomahawk/TH) shipments beat | Positive |
| Ongoing | Large-customer in-house ASIC substitution / concentration risk | Negative |
| 2027 | FY2027 AI-semi $115B guide validation; VMware subscription renewals | Positive if persists |
| Rate-sensitive | 10Y rate path (high beta 1.47 pressures; but 18.8x FY27E already largely immune) | A hike pressures |
| Capital return | Quarterly dividend $0.65/sh + ongoing buyback (FCF $13.67B supports) | Positive |
(1) Customer concentration: custom AI semi revenue is overwhelmingly from 3 hyperscalers; a single customer's capex slowdown or in-house substitution hits hard (Broadcom's biggest differentiated risk vs NVDA);
(2) Cycle-memory discount: the market prices AVGO at only 18.8x FY27E, implying meaningful probability of a 2027-28 earnings roll-over (20-yr semi boom-bust); if AI networking/custom fails to prove 'this time is different', the multiple centroid could fall;
(3) Insider net-sell: 146 trades in 6 months, 1 buy / 145 sells (mostly 10b5-1 scheduled, but the 1-buy signal is weak);
(4) Gross-margin pressure: rising custom-AI-semi mix pulled non-GAAP GM from 77.1% to 74.0%; further mix tilt pressures it;
(5) Valuation-assumption risk: FY2027E EPS $19.57 is a consensus estimate (Yahoo/MarketWatch/Trefis multi-source validated); if actual comes in well below, the Base PT fails;
(6) Macro/rates: beta 1.47, a 10Y rise pressures growth stocks, though the current discount is already largely full;
(7) Geopolitics/trade: China export controls and tariffs cut both ways.
Upside risk: if FQ4'26 delivers $34.8B/$21.7B AI semi and the FY2028 $230B guide persists, the market could re-rate above 32x forward — the $626 bull case (+70% vs spot); a new custom-compute customer (4th hyperscaler) signing is an extra option.
§09Sources, Limits & Disclosure
- Broadcom FY2026 Q3 earnings (official IR investor.broadcom.com, ended 2026-08-02, issued after close 2026-09-02; 8-K same day
- SEC 10-Q (FQ2'26, ended 2026-05-03): segment revenue, gross margin, EPS, cash flow, shares
- Quarterly/annual financials & quotes: NeoData / westock-data (income/cash-flow/metrics/market-cap/return/rating/holders, 2026-09-03 snapshot)
- FQ3 actual/consensus & guide: TipRanks, MarketBeat (2026-09-03 snapshot)
- Analyst ratings & targets: NeoData / Alpha (48-56 brokers, avg $535.25, high $715); TipRanks avg $511.88
- Three signals: QuiverQuant congressional trades (8-12, 6-mo range), insider trades (146, 1 buy/145 sell), SEC Form 4 (Samueli et al.)
- AI semi guide: Broadcom IR 8-K + gu.qq.com (2026-09-03) FY2026 $58B / FY2027 $115B / FY2028 $230B
Limitations: spot is the 2026-09-02 regular close of $367.24 (after-hours $354.34, not used); FQ3'26 non-GAAP gross margin 74.0% coexists with GAAP — text uses non-GAAP 74.0% as base, GAAP not separately shown; FY2027E EPS $19.57 is a sell-side consensus estimate (Yahoo/MarketWatch/Trefis multi-source validated 'consistent across multiple analyst estimates'), not Broadcom guidance, and the multiples (22/27/32x) are subjective assignments under a normalized framework; analyst target Low/Avg/High ($400/$535.25/$715) are from NeoData/Alpha aggregation (9/2026 snapshot); congressional trade count is a 8-12 range (QuiverQuant 6-month window); beta 1.47 and short interest 56.21M sh are from NeoData; TTM P/E approximates with FY2025 $4.77 (exact TTM needs FQ1'26/FQ4'25 split, not shown); this report is not investment advice.