Trip.com Group NASDAQ:TCOM
Published 2026-07-25; market data as of the 2026-07-24 close. Q1 2026 income-statement figures are sourced from Trip.com's Form 6-K filed 2026-06-25. On 2026-07-25, China's State Administration for Market Regulation (SAMR) announced an antitrust penalty against Trip.com; this report's rating is accordingly downgraded from Overweight to Sell.
Trip.com Group is Asia's largest online travel platform. In Q1 2026 (three months ended March 31, 2026), revenue reached US$2.34B (+23.2% YoY) and operating profit grew 16.4% YoY — but this is the pre-penalty financial picture. The penalty disclosed that day changes the calculus: regulators found Trip.com abused a dominant position in China's domestic online hotel-booking platform services market, prohibiting its forced "nationwide lowest-price" (parity) clause and forced exclusive-dealing arrangements. These two practices were precisely the core mechanisms of its near-monopoly OTA moat — pricing power plus exclusive inventory — and their removal by law dismantles the domestic franchise.
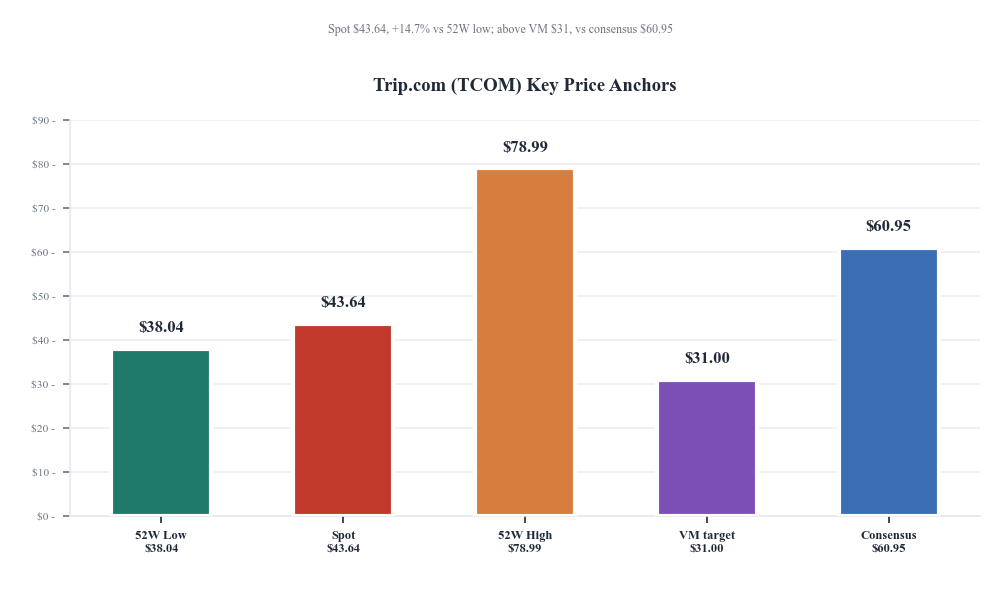
We assign a Sell rating with moderate-high conviction and a 12-month price target of $31, implying −29% downside from the $43.64 close. The prior "cheap 7.4x EV/EBITDA" thesis rested on the assumption that the domestic moat would persist; that assumption no longer holds. Net cash of ~$10B is a defensive floor, not a repair for the banned monopoly pricing and exclusive inventory. The $60.95 sell-side consensus was formed pre-penalty and is now stale.
§01Executive Summary
Trip.com's narrative was rewritten on 2026-07-25. That day, China's State Administration for Market Regulation (SAMR) announced that Trip.com abused its dominant position in China's domestic online hotel-booking platform services market, imposing a combined penalty of ¥5.179 billion (¥1.658B disgorgement + ¥3.521B fine) and, separately, ordering a ¥0.122B order-deposit refund (a separate administrative measure, not counted in the penalty) and a comprehensive rectification. The two prohibited practices — the forced "nationwide lowest-price" (parity) clause and forced exclusive-dealing arrangements — were precisely the core mechanisms of its near-monopoly OTA moat. Their removal by law dismantles the domestic franchise's pricing power and exclusive inventory. On this basis, we downgrade from Overweight to Sell.
Conclusion: Sell, moderate-high conviction. 12-month price target $31, implying −29% downside from the $43.64 close and running opposite to the (now stale) $60.95 sell-side consensus. The thesis is not "expensive" — it is that the near-monopoly domestic model is being dismantled by regulation. The prior "buy the cash cow at a balance-sheet discount" floor is gone: net cash of $10B defends the downside but cannot restore the banned monopoly pricing or exclusive inventory, and the FCF engine depends precisely on the take rate and share now being impaired.
1) The moat is being dismantled by law: with the parity clause and exclusivity banned, domestic-hotel take rate and exclusive inventory disappear and pricing power returns to hotels.
2) The domestic business is the direct target: SAMR defined the relevant market as China's domestic online hotel-booking platform services — squarely the highest-margin, highest-share segment (accommodation = 41.8% of FY2025 revenue).
3) Net cash is defensive, not offensive: $10B net cash more than covers the ¥5.179B penalty, but cannot restore the banned practices; the rectification's hit to take rate/share is ongoing, not one-time.
4) The valuation anchor is broken: the prior "cheap 7.4x EV/EBITDA" assumed the domestic moat would persist; the market's −39% YTD had already begun pricing regulatory risk, and the penalty confirms and extends that re-rating.
§02Regulatory Trigger: The Antitrust Penalty
On 2026-07-25, SAMR announced an administrative penalty against Trip.com Group for abusing a dominant market position (reported by Xinhua the same day). This is the direct trigger for the Overweight-to-Sell downgrade. Core facts:
| Item | Amount / Detail | Note |
|---|---|---|
| Disgorgement of illegal gains | ¥1.658B | Proceeds from the monopolistic conduct confiscated |
| Fine | ¥3.521B | Levied as a percentage of prior-year sales |
| Order-deposit refund | ¥0.122B | Full refund of forcibly withheld hotel order deposits |
| Total penalty | ¥5.179B (≈$0.72B) | ~2.6% of $27.48B mkt cap; ~15.6% of FY2025 net income |
| Relevant market defined | Domestic online hotel booking | China's domestic (not outbound/international) hotel-booking platform services |
| Two monopolistic conducts found | Exclusive dealing + unfair terms | ① Forced exclusivity with some hotels; ② Forced "nationwide lowest price" (parity) |
| Rectification | Comprehensive + public | Case opened Jan 2026; ordered to abandon the above and publish remedies |
Qualitative assessment of the "business decline" (analyst judgment, not financials): the penalty amount itself (≈$0.72B) is coverable by net cash and is one-time; the real downside is structural — we expect domestic-hotel take rate and share to face systemic compression over the next 12–24 months, exerting roughly −10% to −25% pressure on FY2026E EBITDA (see §08 scenarios). This qualitative conclusion follows directly from the specifically banned practices and China's domestic OTA competitive landscape, and must be validated by actual operating data in subsequent quarters.
§03Price & Analyst View
At the 2026-07-24 close, TCOM traded at $43.64, +1.44% on the day; +2.80% / +7.78% over 5 / 20 days, but still −39.31% YTD — a sharp drawdown from the ≈$72 area at 2025 year-end (the 52-week high of $78.99 was set on 2026-01-12). The −39% YTD already signaled the market pricing in regulatory and narrative stress; the 2026-07-25 penalty converts "regulatory risk" from implicit to explicit, from tail to realized.
| Item | Value | Source / Note |
|---|---|---|
| Current price | $43.64 | 2026-07-24 close, VM Genius |
| Market cap | $27.48B | ~617.9M shares outstanding |
| 5d / 20d / YTD | +2.80% / +7.78% / −39.31% | VM Genius实时行情 |
| TTM P/E (reported, distorted) | 6.65x | Inflated by FY25 investment gains |
| TTM P/B | 1.13x | VM Genius |
| EV/EBITDA (FY25, ex-moat) | 7.4x | EV=$27.48B−$10B net cash; EBITDA $2.35B |
| SAMR penalty (2026-07-25) | ¥5.179B | ≈$0.72B, ~2.6% of mkt cap |
| Sell-side consensus (stale) | $60.95 | Pre-penalty, range $42.08–$80.57 · 29 firms |
Peer comparison (2026-07-24 close, VM Genius)
BKNG and ABNB are the high-multiple representatives, EXPE the mid-multiple one, and TCOM the deep discounter. The gap previously reflected China ADR discount and P/E distortion; now, with a realized antitrust penalty, TCOM's discount has a fundamental rationale — its domestic moat is being dismantled by law, while peers face no equivalent structural hit.
| Company | Price | Mkt Cap | P/E (TTM) | P/B | YTD |
|---|---|---|---|---|---|
| Trip.com (TCOM) | $43.64 | $27.48B | 6.65x | 1.13x | −39.31% |
| Booking (BKNG) | $177.46 | $137.5B | 23.40x | n/m | −16.76% |
| Expedia (EXPE) | $259.94 | $31.20B | 22.96x | 54.16x | −7.85% |
| Airbnb (ABNB) | $141.10 | $83.74B | 34.84x | 10.97x | +3.96% |
Source: VM Genius, 2026-07-24 16:00 ET. BKNG $177.46 reflects a recent stock split. P/B "n/m" denotes not meaningful due to buyback-thinned equity.
§04Bull / Bear
Bull (materially weakened): net cash floors, but the moat is gone
① Net cash ~$10B (~36% of market cap) — post-net-cash EV is only ~$17.5B, a substantial downside buffer; the ¥5.179B penalty (≈$0.72B) is easily covered. ② Stable operating cash flow: FY2025 OCF $2.00B, FCF $1.89B — the asset-light model still works. ③ Outbound/international business (Trip.com's overseas brand) sits outside the defined relevant market, so that growth leg is not directly hit. ④ Possible post-rectification efficiency: the tech and compliance cost of maintaining price-parity matching and exclusivity may fall.
But every bull point above is defensive — net cash protects the floor and the international business is independent, yet neither can rebuild the domestic pricing power and exclusive inventory that were the core offensive engine and are now banned.
Bear (dominant): moat dismantled + systemic share/margin pressure
① The domestic near-monopoly mechanism is banned: with parity and exclusivity removed, hotels regain pricing power and cross-platform freedom; Meituan / Douyin / Fliggy / Tongcheng re-compete for the mid-to-high-end and exclusive inventory, and accommodation (41.8% of FY2025 revenue) faces a double hit to take rate and share. ② Rectification is ongoing, not one-time: the penalty is coverable, but the forced business-model change hits the very take rate/share the FCF engine depends on. ③ The valuation anchor is broken: 7.4x EV/EBITDA did not embed the moat dismantling; the −39% YTD had already begun the re-rating, and "cheap" was an illusion. ④ Demonstration effect of normalized antitrust enforcement: the case signals "strengthened normalized antitrust supervision," systematically raising compliance costs and growth constraints across platforms.
VM Genius synthesis: regulatory structural hit (moat dismantling) > net-cash protection + international independence. The bull/bear balance has inverted — the prior debate over "whether the discount is justified" is now resolved by the penalty: the discount has fundamental support. We rate it Sell.
§05Financial Truth
Core Q1 2026 (three months ended March 31, 2026, pre-penalty) data, sourced from Trip.com's 6-K and cross-validated via VM Genius. Note: these figures reflect results generated while the banned monopolistic mechanisms were still operating; the domestic moat economics behind them are now impaired (see §02 / §04).
| Metric (USD) | Q1 2026 | Q1 2025 (YoY) | Q4 2025 (QoQ) | YoY | QoQ |
|---|---|---|---|---|---|
| Revenue | $2,340.7M | $1,900.6M | $2,171.6M | +23.2% | +7.8% |
| Operating profit | $569.7M | $489.6M | $357.4M | +16.4% | +59.4% |
| Operating margin | 24.3% | 25.8% | 16.5% | −1.5pp | +7.9pp |
| EBITDA | $597.8M | $517.7M | $388.0M | +15.5% | +54.1% |
| Net income | $360.9M | $587.8M | $603.8M | −38.6% | −40.2% |
| Diluted EPS | $0.53 | $0.84 | $0.86 | −36.9% | −38.4% |
| Income tax expense | $129.0M | $87.7M | $117.8M | +47.1% | +9.5% |
| SG&A | $1,290.1M | $1,039.2M | $1,357.3M | +24.1% | −4.9% |
YoY direction check: revenue +23.2% YoY, operating profit +16.4% YoY, net income −38.6% YoY, EPS −36.9% YoY — all directions verified against source (revenue/operating profit/EBITDA up, net income/EPS down), consistent with the 6-K. QoQ: revenue +7.8%, operating profit +59.4% (low base), net income −40.2%.
Deconstructing the −39% net income: revenue +23% and operating profit +16% grew strongly, yet net income fell −39%, the gap falling on: ① income tax expense stepping up from $87.7M to $129.0M (+47%), the effective tax rate (income tax / pre-tax income) rising from ~13.0% to ~26.3%; ② a softer year-on-year contribution from non-operating items. Conclusion: the quarterly net-income dip is tax- and one-off-driven, not operating deterioration — but this "operating resilience" was built on the domestic monopoly mechanisms still running; post-penalty, that resilience must be re-assessed.
§06Business Mix
Trip.com's revenue comprises five segments (FY2025 annual basis, VM Genius as of 2025-12-31):
| Segment | FY2025 Revenue | Share |
|---|---|---|
| Accommodation Reservation | $3,631M | 41.82% |
| Transportation Ticketing | $3,128M | 36.03% |
| Others | $891M | 10.26% |
| Packaged Tours | $652M | 7.51% |
| Corporate Travel | $394M | 4.53% |
| Total (excl. sales-tax reversal) | $8,682M | 100% |
FY2025 vs FY2024: revenue $8,681.8M (+17.2%), operating profit $2,194.2M (+11.4%), EBITDA $2,348.5M (+10.6%), net income $4,631.6M (+95.4% — includes non-operating / one-off items), diluted EPS $6.63 (vs $3.44). The growth structure is clear: operating-layer growth of 10–17%, with net-income growth amplified by one-offs, confirming the 6.65x P/E distortion — and this "operating resilience" must now be re-rated for the domestic take-rate/share downdraft post-penalty.
§07Balance Sheet & Cash Flow
Balance sheet (2026-03-31) — a classic cash-fortress OTA, which is also the source of the "defensive floor" under our Sell rating:
| Item | Value | Note |
|---|---|---|
| Cash & short-term investments | $11.73B | Cash + short-term investments |
| Long-term borrowings | $1.63B | Very low leverage |
| Net cash | ≈$10B | ~36% of $27.48B market cap |
| Equity | $24.13B | VM Genius balance-sheet structure |
| SAMR penalty (2026-07-25) | ≈$0.72B | ¥5.179B, coverable by net cash |
Cash flow statement (FY2025 annual basis, VM Genius filed 2026-02-26):
| Item | FY2025 | Note |
|---|---|---|
| Operating cash flow | $2,000.3M | Strong cash generation |
| Capital expenditure | $110.9M | CapEx only 5.5% of OCF |
| Free cash flow | $1,889.4M | FCF/OCF conversion 94% |
| Investing cash flow | −$612.0M | Includes equity investments |
| Financing cash flow | −$2,009.5M | Buybacks + dividends |
| D&A | $152.3M | Asset-light model |
Synthesis of the financial truth: even using FY2025 operating cash flow of $2.00B for valuation (EV / FY25 OCF = $17.5B / $2.00B = 8.75x), the figure is numerically below peers; but this method does not yet capture the moat dismantling. In the Sell framework, the $10B net cash shifts from "upside optionality" to "downside buffer" — and the downgrade of the target from the prior $57 to $31 embeds exactly the synchronized compression of both the EV/EBITDA multiple and forward EBITDA.
§08Valuation & Target Price (Sell framework)
Framework: we retain EV/EBITDA (given the distorted P/E) but compress both the multiple and forward EBITDA — the essential change versus the prior Overweight framework. The former 9.5x multiple assumed the domestic moat would persist; with that assumption removed by regulation, it must be revised down.
Assumptions (Sell scenario): ① the ¥5.179B penalty (≈$0.72B) is absorbed by net cash, leaving adjusted net cash ≈$9.3B; ② rectification drives FY2026E EBITDA down from the prior $2.65B to ≈$2.17B (base case, reflecting roughly −15% to −20% pressure on domestic-hotel take rate/share); ③ 617.9M shares. Per-share value = (EV + net cash) / 617.9M.
| Scenario | EV/EBITDA | EV | + Net Cash | Per Share | vs Price |
|---|---|---|---|---|---|
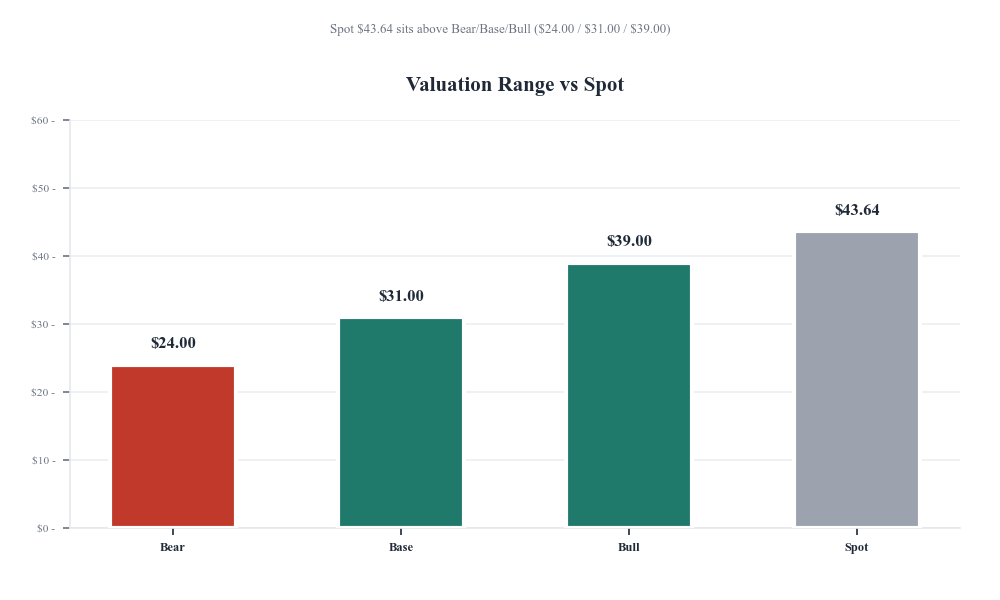
| Bear | 2.8x | $5.5B | $14.8B | $24 | −45.3% |
| Base (target) | 4.6x | $10.0B | $19.3B | $31 | −29.2% |
| Bull | 6.5x | $14.9B | $24.2B | $39 | −10.4% |
Target placement: $31 uses the base-case 4.6x EV/EBITDA, implying −29% downside. The 4.6x is justified as follows: the prior 7.4x did not embed the moat dismantling; under the "domestic pricing power and exclusive inventory removed by law" new normal, the near-monopoly premium vanishes and the valuation reverts toward "ordinary China ADR + regulatory discount." Even the Bull case (6.5x, only mildly impaired EBITDA) at $39 remains below the $43.64 close — i.e., even the best case still implies modest 12-month downside.
Sensitivity (EV/EBITDA × EBITDA, net cash $9.3B):
| Per Share | 3.5x | 4.5x (base) | 5.5x |
|---|---|---|---|
| EBITDA $2.00B (−15%) | $26 | $30 | $33 |
| EBITDA $2.17B (−18%, base) | $27 | $31 | $34 |
| EBITDA $2.35B (flat vs FY25) | $28 | $32 | $36 |
§09Catalysts & Risks
Upside catalysts (materially weakened)
- Independent international/outbound growth: Trip.com's overseas brand lies outside the relevant market; if outbound recovery beats, it partially offsets the domestic decline — but cannot rebuild the banned domestic mechanism.
- Post-rectification cost reduction: the tech and compliance spend on price-parity matching and exclusivity may fall, marginally lifting margins.
- Net-cash returns: FY2025 financing cash flow −$2.01B (buybacks + dividends); the thick cash fortress underpins a price floor.
- ADR-risk relief: improved US-China audit oversight or a Hong Kong secondary listing could drive a re-rating — but must yield to the realized regulatory fundamental hit.
Downside risks (antitrust is the primary, realized risk)
- Antitrust rectification execution (realized, primary risk): with parity and exclusivity banned, domestic-hotel take rate and exclusive inventory disappear; accommodation (41.8% of revenue) faces a share-and-margin double hit — the basis for this downgrade.
- Normalized industry-wide antitrust enforcement: the case signals "strengthened normalized antitrust supervision," systematically raising compliance costs and growth constraints, with extension risk via follow-on penalties or配套 rules.
- Accelerating share loss: Meituan / Douyin / Fliggy / Tongcheng re-compete for mid-to-high-end and exclusive inventory; if Trip.com's share loss exceeds expectations, EBITDA could breach the −25% Bear assumption.
- Outbound recovery below expectations: geopolitical / visa / FX headwinds could keep FY2026 outbound growth single-digit, limiting the offset to the domestic decline.
- Persistently high tax rate: if the effective tax rate holds above 26%, net income stays pressured.
- ADR delisting / audit oversight: PCAOB audit reverberations or forced delisting would directly compress valuation.
§10Sources, Limitations & Disclosure
Primary sources:
- Trip.com Group Limited Form 6-K, Q1 2026 quarterly report (filed 2026-06-25); FY2025 annual report (filed 2026-02-26); FY2024 annual report (filed 2025-02-25) — primary financial data.
- State Administration for Market Regulation (SAMR) announcement / Xinhua, "Ctrip fined and confiscated ¥5.179 billion" (2026-07-25) — source of the antitrust penalty facts and the direct trigger for the Overweight-to-Sell downgrade.
- VM Genius financial search: 2026-07-24 quotes / valuation / 2025Q1-Q4 income statements / FY2025 segment revenue / cash-flow statements.
Method & basis:
- Valuation basis (Sell framework): EV/EBITDA (FY2026E EBITDA cut to ≈$2.17B, assuming −15% to −20% rectification impact; the prior Overweight framework used $2.65B / +13%), net cash $9.3B (net of the ¥5.179B penalty), 617.9M shares; price / valuation data as of 2026-07-24.
- Q1 2026 revenue / profit / YoY / QoQ are consistent with the 6-K and are all pre-penalty; quarterly cash-flow line items are not separately disclosed in VM Genius and use FY2025 annual basis.
- Peer comparison basis: same-day close, market cap, P/E(TTM), P/B, YTD for BKNG / EXPE / ABNB vs TCOM.
- Penalty converted at ¥5.179B and an exchange rate of ≈7.15 RMB/USD to ≈$0.72B.
Limitations:
- No 6-K PDF was available locally; all 6-K figures were cross-validated via VM Genius. For finer granularity (segment operating profit, geographic split), refer to Trip.com IR official PDFs.
- Q1 2026 quarterly cash-flow line items (OCF / CapEx / FCF) are not disclosed in VM Genius's quarterly interface; FY2025 annual basis is used.
- 52-week exact highs/lows were retrieved via VM Genius's historical interface: the 52-week range is $38.04–$78.99 (low on 2026-06-25, high on 2026-01-12), with the $43.64 close in the lower-middle of the range.
- This rating reversal is based on the public facts of the 2026-07-25 antitrust penalty; the quantified impact on the domestic "business decline" (EBITDA −10% to −25%) is an analyst scenario assumption to be validated by actual operating data in subsequent quarters, with upside/downside deviation risk.
Disclosure: This report is independently prepared by the VM Genius team for personal research reference only. It does not constitute investment advice and we do not execute any transactions. Providing investment advisory services to third parties requires a license. We hold no position in or conflict of interest with TCOM.